272 Mansfield G #272 · Boca Raton, FL
Flood risk 1/10 · Minimal
- FEMA flood zone
- X (unshaded)
- Chance of flooding over 30 yrs
- 0.0%
- Est. flood insurance / yr
- $507 – $1,088
Fire risk 1/10 · Minimal
- Est. fire insurance / yr
- $947 – $1,759
Heat risk 9/10 · Severe
- Hot days now (above 107°F)
- 7 days/yr
- Hot days in 30 yrs
- 27 days/yr
Wind risk 10/10 · Severe
- Chance of severe wind over 30 yrs
- 99.0%
Air-quality risk 2/10 · Minimal
- Unhealthy air days now
- 2 days/yr
- Unhealthy air days in 30 yrs
- 2 days/yr
Risk factors via First Street. Map © Google.
Why this score? — see what drove the C+ grade
The composite is a weighted blend of 9 inputs, each scored 0–100. Each bar is that input's sub-score; the figure is the points it added to the 100-point composite (weight × sub-score).
- Cash flow +24.4/30.0
- 1% rule +10.0/10.0
- DSCR +7.9/10.0
- ARV discount +7.5/15.0
- Schools +4.3/10.0
- Livability +3.9/5.0
- Rent growth +3.0/5.0
- Condition / age +2.5/5.0
- Appreciation +0.0/10.0
$94,900
🖨 Deal sheet 📄 Offer letter ✓ Due diligence
Listing remarks
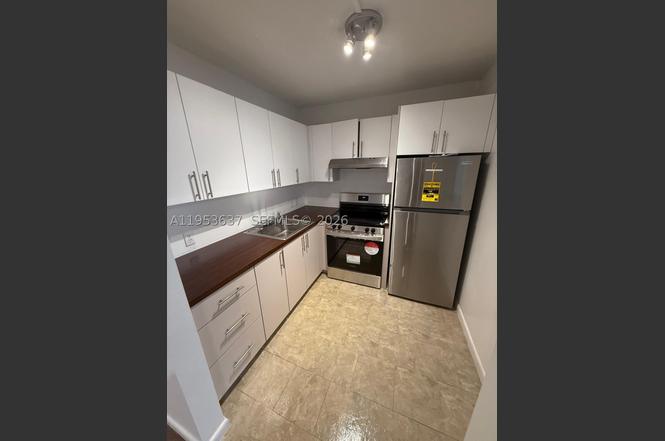
This beautiful, highly desirable 1-bedroom, 1.5-bathroom apartment is located on the second floor of Century Village, a premier 55+ community. Residents can enjoy numerous amenities, including walking and biking paths, billiards, tennis courts, and more. The open-concept floor plan provides a bright, light-filled space with versatile design options. The unit features updated wood laminate flooring throughout, along with upgraded fixtures and finishes.
Key facts
- Billiards
- Tennis courts
- $497 HOA
Tags
Property features AI
Finance
- Financial info: Pets allowed with restrictions or possible restrictions
- HOA & community: Monthly association fee; Association fee includes amenities; Association amenities: cabana, clubhouse, barbecue, picnic area, pool, spa/hot tub, tennis courts, trails; Senior community
Exterior
- Parking: One parking space
- Security: Complex fenced; Smoke detectors
- Home design: Attached property; 4-story building; Entry on level 2
- Construction: Block construction; Resale property
- Exterior features: Fenced; Association pool
Interior
- Kitchen: Electric range; Refrigerator
- Bedrooms: Bedroom on main level
- Flooring: Carpet; Laminate
- Bathrooms: 1 full bathroom; 1 half bathroom
- Interior features: First-floor entry; Elevator; Bedroom on main level
Neighborhood map
What this means for you Summary
Snapshot
- This is a 1-bed/1.5-bath condo listed at $95k.
Deal economics
- At list price, monthly cash flow is $193 ($2k/yr) — positive.
- The deal already cash-flows at list — no discount required.
- Meets the 1% rule at list price ($2k rent vs $95k).
- Recommended offer: $84k (12.0% below list) — sets the bar for market timing.
- Cap rate 8.7% vs local median 2.8% in Boca Raton — top-decile yield for the area; either an underpriced asset or a hidden risk that comps aren't pricing in. Stress-test before assuming the spread holds.
Location & tenants
- Location reads 77/100 on livability (#192 in FL, #3,070 nationally) — a middle-class / working-renter tenant base. Strengths: schools A+, employment A+, health & safety A+; Watch: amenities D, cost of living F.
- Palm Beach (suburban): math 46% / reading 53% proficiency, ranked #34 of 73 in FL (top 47%) — families likely to look elsewhere, expect single-tenant / working-renter base with shorter leases.
- Market conditions: Rents rising (+1.8%/yr); 418 active listings in the ZIP; 39 comparable units currently listed for rent nearby; rentals at typical pace (median 25d on market — plan ~3-4 weeks tenant-placement turnaround); solid renter incomes; 3,974 units permitted in Palm Beach County in 2024 (1,012 in 5+ unit buildings).
Forward outlook
- Local home prices are declining (-3.0%/yr); year-one equity from $656 of loan paydown is wiped out by about $3k of value loss. Plan a longer hold.
- Palm Beach County population projected at +30% by 2050 — long-run rental-demand tailwind backs the buy-and-hold thesis.
Negotiation context
- It's been on market 142 days — a 12% lower offer ($84k) is reasonable based on typical stale-listing flexibility.
- 9 sale attempts since 8y ago with the ask held roughly flat each time — persistent listings suggest the price (not the market) is what's stuck; bring a comps-based counter.
- Current owner paid $42k; list at $95k implies a 123% gain — meaningful room to come down on a strong offer.
Risks & watch-outs
- Watch-outs: HOA is 29% of rent.
- Climate carrying-cost: severe wind risk, 99% chance of damaging wind over 30y; extreme-heat days projected 7→27/yr by 2055 (HVAC capex compounding) — expect insurance premiums to compound above CPI over the hold.
Questions for the listing agent
- It's been on market 142 days. Have you received any prior offers? Is the seller open to a 12% concession, seller financing, or rate buy-down credit?
- What does the HOA fee cover, when was the last increase, and are there any pending special assessments or reserve-fund shortfalls?
- Any open or pending special assessments — roof, HVAC, plumbing, elevator, façade? What's the per-unit balance and payoff schedule, and is the seller paying it off at close or rolling it to the buyer?
- Why hasn't it sold? Are there any deal-killer items the seller is aware of (foundation, flood, title, zoning, code violations)?
- Is there a deadline driving the sale (1031 exchange, divorce, estate, relocation)? That informs how much negotiation room exists.
- Schools are A-rated — typically a magnet for longer-tenancy family renters. What's the average tenant stay here, and is there a school-zone premium baked into asking?
- What's the average days-on-market for RENTAL listings here right now (not sales)? A rising rental-DOM trend means longer vacancies and softer asking-rent achievability than the comps imply.
- What's the recent tenant-quality profile in this submarket — average credit score on applications, eviction rate, late-payment / NSF rate, and stable-employment percentage? A property-management company in the area should have these aggregated.
- How much new apartment / multifamily construction is in the pipeline within 1–3 miles? Heavy new supply (>2% of stock underway) typically softens rents 12–24 months out; light construction supports rent growth.
Investment metrics
- 1% rule
- 1.79% ✓
- Cap rate
- 8.73%
- Cash-on-cash
- 8.71%
- DSCR
- 1.39
- GRM
- 4.6
CMA / ARV
No comps found within radius.
Projected returns pro-forma
-3.0% appreciation · 1.81% rent growth · sell at horizon
- IRR
- -4.9%
- Equity multiple
- 0.82×
- Total profit
- $-4,778
- Equity at exit
- $14,150
- IRR
- 2.8%
- Equity multiple
- 1.19×
- Total profit
- $4,927
- Equity at exit
- $8,205
Cash invested: $26,572 (down + closing). Projections, not guarantees.
Landlord ↔ Tenant lean methodology
- Overall (STATE)
- 87 Strongly Landlord-Friendly
- State Florida
- 87 Strongly Landlord-Friendly · R+3
- County
- — inherits STATE
- City
- — inherits STATE
ZIP-level market 33434
- Rents YoY
- 1.8%
- Active inventory
- 418
- Price-to-rent
- 4.6×
Monthly cashflow live
- Estimated rent
- $1,703 high interval (Pro) →
- Mortgage (P&I)
- −$498
- Tax est. 1.5%
- −$119 /mo · $1,424/yr
- Insurance
- −$40
- HOA
- −$497
- Vacancy / Maint / Mgmt
- −$358
- Net cashflow
- $193
Break-even live
UW: 25.0% down · 7.5% · 30yr · 1.5% tax · 5.0% vac · 8.0% maint · 8.0% mgmt
Financing live
Cash to close
- Down payment
- $23,725
- Closing costs
- $2,847
- Reserves months
- —
- Total cash needed
- —
Loan-product check · same deal, 3 products live
Conventional
25% down · 7.5% · 30yr
- Down + closing
- —
- Monthly P&I
- —
- Monthly cashflow
- —
- DSCR
- —
- Eligible?
- —
Personal DTI + credit; lowest rate.
DSCR
20% down · 8.5% · 30yr
- Down + closing
- —
- Monthly P&I
- —
- Monthly cashflow
- —
- DSCR
- —
- Eligible?
- —
No personal income docs; deal must DSCR.
Hard money
10% down · 12.0% · 12mo
- Down + closing
- —
- Monthly P&I
- —
- Monthly cashflow
- —
- DSCR
- —
- Eligible?
- —
Short-term bridge; refi at stabilization.
Rent comps 39 comps
| Address | Beds | Baths | Sqft | Rent | $/sqft | DOM | Units | Dist |
|---|---|---|---|---|---|---|---|---|
| 86 Mansfield C Unit C Boca Raton, FL | 1.0 | 1.5 | 720 | $1,700 | $2.36 | 11d | 1 | 0.02mi |
| 534 Mansfield M #534 Boca Raton, FL | 1.0 | 1.5 | 715 | $1,300 | $1.82 | 24d | 1 | 0.02mi |
| 4014 Newcastle A Unit A Boca Raton, FL | 1.0 | 1.5 | 738 | $1,495 | $2.03 | 24d | 1 | 0.09mi |
| 457 Mansfield I Unit 457 Boca Raton, FL | 1.0 | 1.5 | 720 | $1,700 | $2.36 | 3d | 1 | 0.10mi |
| 517 Mansfield M Unit 517 Boca Raton, FL | 1.0 | 1.5 | 715 | $1,550 | $2.17 | 24d | 1 | 0.14mi |
| 474 Mansfield L Unit L Boca Raton, FL | 1.0 | 1.5 | 720 | $1,400 | $1.94 | 11d | 1 | 0.17mi |
| 77 Preston Way #77 Boca Raton, FL | 1.0 | 1.0 | 600 | $1,450 | $2.42 | 22d | 1 | 0.18mi |
| 77 Preston Way #77 Boca Raton, FL | 1.0 | 1.0 | 600 | $1,350 | $2.25 | 7d | 1 | 0.18mi |
| 91 Preston Way Unit 91 Boca Raton, FL | 1.0 | 1.0 | 600 | $1,500 | $2.50 | 24d | 1 | 0.27mi |
| 149 Preston Way #149 Boca Raton, FL | 1.0 | 1.5 | 720 | $1,350 | $1.88 | 24d | 1 | 0.27mi |
| 149 Preston Way #149 Boca Raton, FL | 1.0 | 1.5 | 720 | $1,300 | $1.81 | 2d | 1 | 0.27mi |
| 119 Fanshaw C Unit 119 Boca Raton, FL | 1.0 | 1.0 | 585 | $1,299 | $2.22 | 24d | 1 | 0.43mi |
| 147 Fanshaw D Boca Raton, FL | 1.0 | 1.0 | 601 | $1,350 | $2.25 | 24d | 1 | 0.43mi |
| 454 Fanshaw K Unit K Boca Raton, FL | 1.0 | 1.5 | 715 | $1,500 | $2.10 | 15d | 1 | 0.44mi |
| 96 Fanshaw C Boca Raton, FL | 1.0 | 1.5 | 702 | $1,650 | $2.35 | 15d | 1 | 0.44mi |
| 250 Suffolk F #250 Boca Raton, FL | 1.0 | 1.5 | 720 | $1,450 | $2.01 | 3d | 1 | 0.46mi |
| 171 Suffolk F #171 Boca Raton, FL | 1.0 | 1.5 | 720 | $1,500 | $2.08 | 11d | 1 | 0.46mi |
| 68 Suffolk F Unit 68 Boca Raton, FL | 1.0 | 1.5 | 720 | $2,750 | $3.82 | 24d | 1 | 0.46mi |
| 209 Suffolk F Unit F Boca Raton, FL | 1.0 | 1.5 | 720 | $1,400 | $1.94 | 24d | 1 | 0.46mi |
| 3031 Cornwall B Boca Raton, FL | 1.0 | 1.5 | 738 | $1,550 | $2.10 | 24d | 1 | 0.46mi |
| 4074 Cornwall D Boca Raton, FL | 1.0 | 1.5 | 738 | $1,450 | $1.96 | 24d | 1 | 0.51mi |
| 8 Fanshaw Dr Unit 8 Boca Raton, FL | 1.0 | 1.0 | 585 | $1,300 | $2.22 | 7d | 1 | 0.51mi |
| 3070 Cornwall D Boca Raton, FL | 1.0 | 1.5 | 738 | $3,200 | $4.34 | 24d | 1 | 0.52mi |
| 2052 Cornwall Dr Unit 2052 Boca Raton, FL | 1.0 | 1.5 | 738 | $3,150 | $4.27 | 24d | 1 | 0.52mi |
| 3014 Cornwall a Boca Raton, FL | 1.0 | 1.5 | 738 | $1,775 | $2.41 | 2d | 1 | 0.52mi |
| 3014 Cornwall a Boca Raton, FL | 1.0 | 1.5 | 738 | $1,650 | $2.24 | 2d | 1 | 0.52mi |
| 4067 Yarmouth D Boca Raton, FL | 1.0 | 1.5 | 738 | $1,650 | $2.24 | 3d | 1 | 0.54mi |
| 1072 Yarmouth E #1072 Boca Raton, FL | 1.0 | 1.5 | 738 | $1,950 | $2.64 | 24d | 1 | 0.54mi |
| 4008 Cornwall a Boca Raton, FL | 1.0 | 1.5 | 738 | $1,600 | $2.17 | 24d | 1 | 0.56mi |
| 82 Fanshaw Dr Unit 82 Boca Raton, FL | 1.0 | 1.5 | 702 | $1,250 | $1.78 | 24d | 1 | 0.63mi |
| 321 Dorset Dr Boca Raton, FL | 1.0 | 1.5 | 720 | $1,590 | $2.21 | 24d | 1 | 0.64mi |
| 119 Dorset Dr Unit 119 Boca Raton, FL | 1.0 | 1.0 | 600 | $1,400 | $2.33 | 24d | 1 | 0.72mi |
| 129 Brighton D Boca Raton, FL | 1.0 | 1.5 | 720 | $1,300 | $1.81 | 24d | 1 | 0.72mi |
| 359 Brighton I Unit I Boca Raton, FL | 1.0 | 1.5 | 735 | $1,550 | $2.11 | 24d | 1 | 0.72mi |
| 314 Brighton H Unit H Boca Raton, FL | 1.0 | 1.5 | 720 | $1,500 | $2.08 | 14d | 1 | 0.73mi |
| 251 Brighton F Boca Raton, FL | 1.0 | 1.5 | 720 | $1,450 | $2.01 | 24d | 1 | 0.73mi |
| 251 Brighton Dr Unit 251 Boca Raton, FL | 1.0 | 1.5 | 720 | $1,450 | $2.01 | 7d | 1 | 0.74mi |
| 156 Brighton Dr Unit 156 Boca Raton, FL | 1.0 | 1.5 | 720 | $1,350 | $1.88 | 24d | 1 | 0.74mi |
| 22 Brighton Dr Unit 22 Boca Raton, FL | 1.0 | 1.0 | 600 | $1,300 | $2.17 | 7d | 1 | 0.76mi |
HOA detail condo
- Monthly dues
- $497 · $5,964/yr
- Assessments
- None detected in remarks — confirm with the listing agent.
Listing history 35 events
-
2026-06-18days on market $94,900 Active 142 DOM
-
2026-06-17days on market $94,900 Active 141 DOM
-
2026-06-16days on market $94,900 Active 140 DOM
-
2026-06-15days on market $94,900 Active 139 DOM
-
2026-06-13days on market $94,900 Active 137 DOM
-
2026-06-09days on market $94,900 Active 133 DOM
-
2026-06-07days on market $94,900 Active 131 DOM
-
2026-06-04days on market $94,900 Active 128 DOM
-
2026-06-03days on market $94,900 Active 127 DOM
-
2026-06-01days on market $94,900 Active 125 DOM
-
2026-05-31days on market $94,900 Active 124 DOM
-
2026-03-03price $94,900
-
2026-01-27$95,000 Active
-
2025-07-24historical
-
2025-06-23historical $1,400
-
2025-05-19$1,400
-
2025-05-14historical $1,400
-
2025-05-03price $1,400
-
2025-04-22$1,450
-
2025-04-16historical $1,400
-
2025-04-16$1,400
-
2025-03-27historical $1,400
-
2025-02-19price $1,400
-
2025-02-18price $114,900
-
2025-02-05$1,450
-
2024-07-25price $120,000
-
2024-07-24$115,000 Active
-
2019-07-01status Active
-
2019-06-13historical
-
2019-06-13historical
-
2019-05-02price $65,000
-
2019-02-22$68,550 Active
-
2018-06-29soldstatus $42,500 Closed
-
2018-05-31status Pending
-
2018-03-10$45,000 Active
ⓘ Source: listings_history table (triggers on properties + properties_extension) + one-shot
backfill from property_details.listing_events for pre-trigger history.
Climate risk First Street
- Flood 1/10 Low FEMA zone X (unshaded) · 0% chance over 30 yrs
- Wildfire 1/10 Low
- Heat 9/10 Extreme 7 d/yr ≥107°F today · 27 d/yr by 30 yrs out
- Wind 10/10 Extreme 99% chance of damaging wind over 30 yrs
- Air quality 2/10 Low 2 unhealthy d/yr today · 2 by 30 yrs out
Nearby sold comps map
Loading sold comps map…
Walkable amenities ~0.75 mi
Loading nearby amenities…
Taxation est. · year 1
- Rental income
- $20,441
- − Mortgage interest
- −$5,316
- − Property taxes
- −$1,424
- − Insurance
- −$474
- − Repairs & maintenance
- −$1,635
- − Management
- −$1,635
- − HOA
- −$5,964
- − Depreciation
- −$2,761
- Taxable income
- $1,232
- Est. tax owed @ 24.0%
- −$296
- After-tax cash flow
- $2,019/yr
For passive investors: Depreciation is non-cash, so a rental often shows a tax loss while cash-flowing — sheltering income. Rental losses are passive: they offset passive income freely, and up to $25,000/yr can offset ordinary (W-2) income if you actively participate and your MAGI is under $100k (phasing out to $0 by $150k); unused losses carry forward. On sale, claimed depreciation is recaptured at up to 25%, and gains may owe capital-gains tax (a 1031 exchange can defer both). Figures are a year-1 estimate at your 24.0% rate — not tax advice; consult a CPA.
Schools (NCES district)
- District
- Palm Beach
- NCES district ID
- 1201500
- Math proficiency
- 46% ▼ -16.00%
- Reading proficiency
- 53% ▼ -4.00%
- Median HH income
- $53,943
- Composite
- 42.72/100
- National rank
- #3160
- State rank
- #34 of 73 in FL
Livability — Boca Raton
- Score
- 77/100
- State rank
- #192
- US rank
- #3070
Category grades
Schools grade is shown separately in the Schools card above.
Census & demographics
- County
- Palm Beach County · 1,438,312 people
- City population
- 250,102
- Metro
- Miami-Fort Lauderdale-Pompano Beach, FL
- Population (ZIP)
- 21,686
- Household income
- $77,269
- Rent vs Own
- Severe rent burden
- 812.0
Population outlook (Palm Beach County) Hauer SSP2
- Today (2025)
- 1,637,487 people
- By 2030
- 1,743,255 · +6.5%
- By 2040
- 1,948,712 · +19.0%
- By 2050
- 2,132,979 · +30.3%
- By 2075
- 2,530,027 · +54.5%
- By 2100
- 2,706,979 · +65.3%
Race, ethnicity, and origin ACS 2023
- Neighborhood character
- Predominantly White (72%)
- Race & ethnicity
- White 72% Hispanic / Latino 18% Two or more races 13% Asian 3% Black 3%
- Hispanic origin (detail)
- Mexican 2% Puerto Rican 2% Cuban 1%
- Common ancestry
- Romanian 9% Scotch-Irish 8% Italian 2%
- Foreign-born
- 25% · Canada, Jamaica, South Korea
- Languages at home
- 73% English-only · Spanish 15% Other Indo-European 4% Russian/Polish/Slavic 1%
Political lean MEDSL · Palm Beach
- 2024 margin
- Toss-up / Even · D 50.0% · R 49.2%
- 2008→2024 swing
- -22.1pp toward R · 2008: 22.9pp · 2024: 0.8pp
- All cycles
- 2024: D+0.8 2020: D+12.8 2016: D+15.3 2012: D+17.0 2008: D+22.9
Not yet ingested
- Civics
- —
Market trends
- HPI YoY
- ▼ -279.89%
- Current HPI
- 271.1328
- Rent YoY
- ▲ 1.81%
- Metro
- Miami-Fort Lauderdale-Pompano Beach, FL
- State GDP YoY
- ▲ 3.28%
- F500 in state
- 36
Industry mix (Fortune 500 HQ in FL)
| Industry | F500 HQs | Revenue |
|---|---|---|
| Industrial Technology | 2 | $29B |
|
||
| Insurance | 2 | $17B |
|
||
| Retail | 1 | $60B |
|
||
| Technology Distribution | 1 | $58B |
|
||
| Homebuilding | 1 | $35B |
|
||
| Technology Manufacturing | 1 | $35B |
|
||
Price history
+110.9% since first listed24 events — show timeline
- 2026-03-03 Price Changed $94,900 MARMLS
- 2026-01-27 Listed $95,000 MARMLS
- 2025-07-24 Listing Removed — MARMLS
- 2025-06-23 Rental Removed $1,400 MARMLS
- 2025-05-19 Listed for Rent $1,400 MARMLS
- 2025-05-14 Rental Removed $1,400 MARMLS
- 2025-05-03 Price Changed $1,400 MARMLS
- 2025-04-22 Listed for Rent $1,450 MARMLS
- 2025-04-16 Rental Removed $1,400 MARMLS
- 2025-04-16 Listed for Rent $1,400 MARMLS
- 2025-03-27 Rental Removed $1,400 MARMLS
- 2025-02-19 Price Changed $1,400 MARMLS
- 2025-02-18 Price Changed $114,900 MARMLS
- 2025-02-05 Listed for Rent $1,450 MARMLS
- 2024-07-25 Price Changed $120,000 MARMLS
- 2024-07-24 Listed $115,000 MARMLS
- 2019-07-01 Relisted — MARMLS
- 2019-06-13 Listing Removed — MARMLS
- 2019-06-13 Listing Removed — MARMLS
- 2019-05-02 Price Changed $65,000 MARMLS
- 2019-02-22 Listed $68,550 MARMLS
- 2018-06-29 Sold (MLS) $42,500 Beaches MLS
- 2018-05-31 Pending — Beaches MLS
- 2018-03-10 Listed $45,000 Beaches MLS
Cash-flow waterfall
monthlySold comps — $/sqft
last 12 mo · ≤1 miLoading sold comps…