 🏷️ Likely Rental
12 Jackson Dr · Millville, NJ
Flood risk No data
- FEMA flood zone
- —
- Chance of flooding over 30 yrs
- —
- Est. flood insurance / yr
- —
Fire risk No data
- Est. fire insurance / yr
- —
Heat risk No data
- Hot days now (above threshold)
- —
- Hot days in 30 yrs
- —
Wind risk No data
- Chance of severe wind over 30 yrs
- —
Air-quality risk No data
- Unhealthy air days now
- —
- Unhealthy air days in 30 yrs
- —
Risk factors via First Street. Map © Google.
Why this score? — see what drove the B- grade
The composite is a weighted blend of 9 inputs, each scored 0–100. Each bar is that input's sub-score; the figure is the points it added to the 100-point composite (weight × sub-score).
- Cash flow +25.2/30.0
- ARV discount +15.0/15.0
- DSCR +8.3/10.0
- 1% rule +6.6/10.0
- Condition / age +4.2/5.0
- Livability +3.2/5.0
- Rent growth +3.0/5.0
- Schools +1.5/10.0
- Appreciation +0.0/10.0
$137,500
🖨 Deal sheet (PDF) 📄 Offer letter ✓ Due diligence
Listing remarks MLS
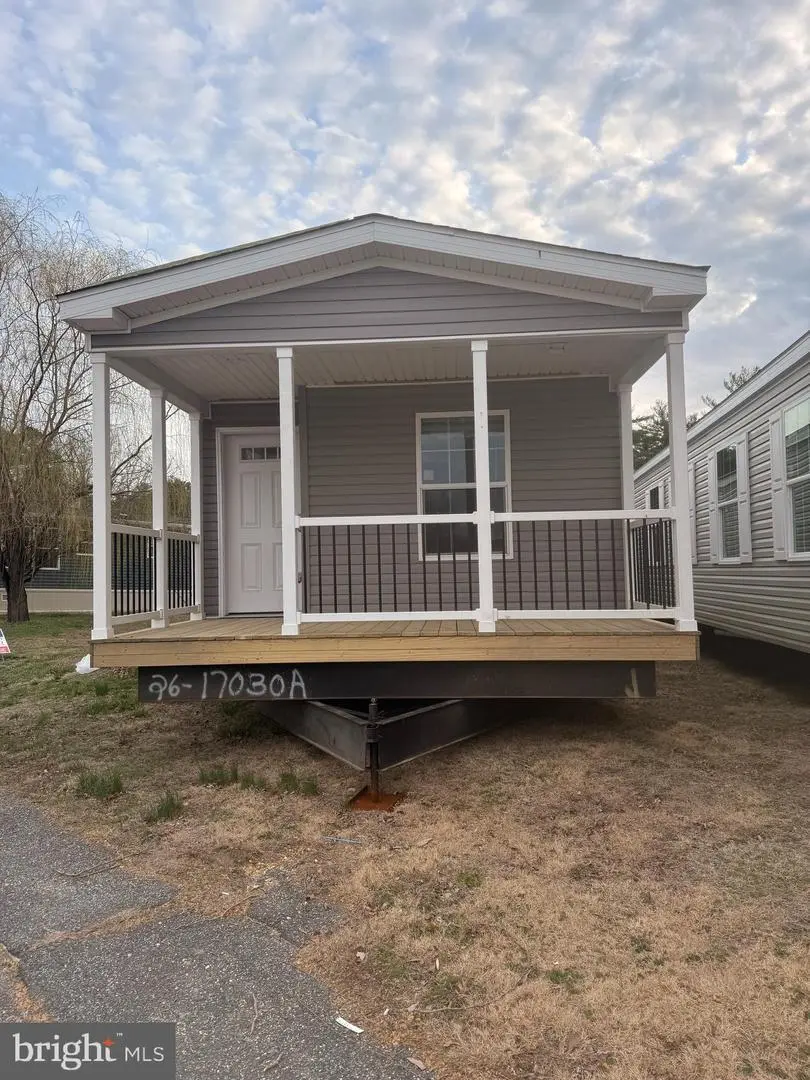
New Colony model with open floor plan offering 2 bedrooms and 2 full baths, generously sized island in kitchen with electric outlets for additional use of countertop space on island; an abundant amount of kitchen cabinets and space for a kitchen table; large walk in closet in primary bedroom and ceramic tile in large walk in shower in the primary bathroom. Enjoy the beautiful covered front porch while passing the time. Washer and dryer hook up in unit for added convenience. Lot rent includes sewer, trash, road maintenance and snow removal. Holly Village is an all age community and is conveniently located close to town but offers a rural feel. Home is on site but must be set on the lot and stabilized before any showings can take place. New park residents are responsible for $12 per month toward the water bill in addition to the lot rent of $615.00 per month. Financing information is available! (Traditional mortgage will not work for a mobile home).
Key facts
- Open floor plan
- Large walk in closet
- Parking
Tags
Neighborhood map
What this means for you Summary
Snapshot
- This is a 2-bed/2.0-bath single-family listed at $138k. Condition is rated good.
Deal economics
- At list price, monthly cash flow is $308 ($4k/yr) — positive.
- The deal already cash-flows at list — no discount required.
- Meets the 1% rule at list price ($2k rent vs $138k).
- Recommended offer: $129k (6.0% below list) — sets the bar for market timing.
- Cap rate 9.0% vs local median 4.2% in Millville — top-decile yield for the area; either an underpriced asset or a hidden risk that comps aren't pricing in. Stress-test before assuming the spread holds.
Location & tenants
- Location reads 63/100 on livability (#431 in NJ) — a middle-class / working-renter tenant base. Strengths: housing A+, health & safety B+; Watch: schools F, crime F, amenities F.
- Millville School District (suburban): math 6% / reading 28% proficiency, ranked #447 of 472 in NJ (top 95%) — low school quality limits family demand, transient renter base, plan for 1-2y turnover; 60% free/reduced lunch — lower-income household profile, screen leases tightly.
- Market conditions: Rents rising (+1.9%/yr); 296 active listings in the ZIP; 216 units permitted in Cumberland County in 2024 (73 in 5+ unit buildings).
Forward outlook
- Local home prices are declining (-3.0%/yr); year-one equity from $951 of loan paydown is wiped out by about $4k of value loss. Plan a longer hold.
- Cumberland County population projected to shrink 7% by 2050 — rents likely to lag national; underwrite the cash flow, not the appreciation.
Negotiation context
- It's been on market 81 days — a 6% lower offer ($129k) is reasonable based on typical stale-listing flexibility.
Questions for the listing agent
- It's been on market 81 days. Have you received any prior offers? Is the seller open to a 6% concession, seller financing, or rate buy-down credit?
- Why hasn't it sold? Are there any deal-killer items the seller is aware of (foundation, flood, title, zoning, code violations)?
- Is there a deadline driving the sale (1031 exchange, divorce, estate, relocation)? That informs how much negotiation room exists.
- Schools are F-rated, which usually means shorter tenancies and higher turnover. Who's the typical renter profile here, and what's been the actual vacancy rate?
- Crime grade is F in this area — have there been break-ins, vandalism, or insurance claims at this property in the last 3 years? What carrier currently insures it and at what premium?
- What's the average days-on-market for RENTAL listings here right now (not sales)? A rising rental-DOM trend means longer vacancies and softer asking-rent achievability than the comps imply.
- What's the recent tenant-quality profile in this submarket — average credit score on applications, eviction rate, late-payment / NSF rate, and stable-employment percentage? A property-management company in the area should have these aggregated.
- How much new for-sale + rental construction is in the pipeline within 1–3 miles? Heavy new supply typically softens prices + rents 12–24 months out; constrained supply supports both.
Investment metrics
- 1% rule
- 1.16% ✓
- Cap rate
- 8.98%
- Cash-on-cash
- 9.61%
- DSCR
- 1.43
- GRM
- 7.2
CMA / ARV
- ARV (on-the-fly)
- $182,358
- Comps found
- 12
Show comp detail 12 sales within ~0.75 mi
| Address | Dist | Beds/Ba | Sqft | Sold | Price | $/sf | Match |
|---|---|---|---|---|---|---|---|
| 10 Jackson Dr | 0.02mi | 2/1.0 | 870 (-6%) | 8mo | $106,400 | $122 | 79 |
| 14 Eisenhower Blvd | 0.19mi | 2/2.0 | 980 (+6%) | 15mo | $95,000 | $97 | 68 |
| 11 Mckinley Dr | 0.28mi | 3/2.0 (+1) | 933 (+1%) | 19mo | $100,000 | $107 | 64 |
| 15A Jfk Blvd | 0.04mi | 2/1.0 | 816 (-11%) | 17mo | $70,000 | $86 | 61 |
| 153 S 2nd St S | 0.44mi | 3/1.0 (+1) | 893 (-3%) | 10mo | $199,500 | $223 | 57 |
| 420 Fulton St | 0.65mi | 2/1.0 | 865 (-6%) | 3mo | $255,000 | $295 | 53 |
| 427 Fulton St | 0.66mi | 3/2.0 (+1) | 857 (-7%) | 4mo | $180,000 | $210 | 49 |
| 839 S 2nd St | 0.67mi | 2/1.0 | 938 (+2%) | 16mo | $205,000 | $219 | 48 |
| 17-19 S 5th St S | 0.63mi | 3/1.0 (+1) | 968 (+5%) | 8mo | $175,000 | $181 | 47 |
| 510 Sassafras St | 0.73mi | 2/1.0 | 908 (-1%) | 19mo | $60,000 | $66 | 44 |
| 200 5th St S | 0.55mi | 2/1.0 | 1,009 (+10%) | 13mo | $199,900 | $198 | 43 |
| 14 Wildwood Ave | 0.63mi | 2/1.0 | 832 (-10%) | 11mo | $240,000 | $288 | 42 |
Match score weights: distance 35% · size 25% · config 20% · recency 20%. Top-matched comps best support the ARV.
Projected returns pro-forma
-3.0% appreciation · 1.94% rent growth · sell at horizon
- IRR
- -3.0%
- Equity multiple
- 0.89×
- Total profit
- $-4,298
- Equity at exit
- $20,502
- IRR
- 5.5%
- Equity multiple
- 1.39×
- Total profit
- $14,891
- Equity at exit
- $11,888
Cash invested: $38,500 (down + closing). Projections, not guarantees.
Landlord ↔ Tenant lean methodology
- Overall (STATE)
- 21 Tenant-Leaning
- State New Jersey
- 21 Tenant-Leaning · D+6
- County
- — inherits STATE
- City
- — inherits STATE
ZIP-level market 08332
- Home prices YoY
- -28.9%
- Rents YoY
- 1.9%
- Active inventory
- 296
- Price-to-rent
- 7.2×
Monthly cashflow live
- Estimated rent
- $1,593 medium interval (Pro) →
- Mortgage (P&I)
- −$721
- Tax est. 1.5%
- −$172 /mo · $2,062/yr
- Insurance
- −$57
- HOA
- −$0
- Vacancy / Maint / Mgmt
- −$335
- Net cashflow
- $308
Break-even live
Sensitivity live
| Price | -10% $403 | -5% $356 | +0% $308 | +5% $261 | +10% $213 |
|---|---|---|---|---|---|
| Rent | -10% $183 | -5% $245 | +0% $308 | +5% $371 | +10% $434 |
| Rate | -1.0pp $378 | -0.5pp $343 | base $308 | +0.5pp $273 | +1.0pp $236 |
UW: 25.0% down · 7.5% · 30yr · 1.5% tax · 5.0% vac · 8.0% maint · 8.0% mgmt
Financing live
Cash to close
- Down payment
- $34,375
- Closing costs
- $4,125
- Reserves months
- —
- Total cash needed
- —
Loan-product check · same deal, 3 products live
Conventional
25% down · 7.5% · 30yr
- Down + closing
- —
- Monthly P&I
- —
- Monthly cashflow
- —
- DSCR
- —
- Eligible?
- —
Personal DTI + credit; lowest rate.
DSCR
20% down · 8.5% · 30yr
- Down + closing
- —
- Monthly P&I
- —
- Monthly cashflow
- —
- DSCR
- —
- Eligible?
- —
No personal income docs; deal must DSCR.
Hard money
10% down · 12.0% · 12mo
- Down + closing
- —
- Monthly P&I
- —
- Monthly cashflow
- —
- DSCR
- —
- Eligible?
- —
Short-term bridge; refi at stabilization.
Listing history 16 events
-
2026-06-19days on market $137,500 Active 81 DOM
-
2026-06-18days on market $137,500 Active 80 DOM
-
2026-06-17days on market $137,500 Active 79 DOM
-
2026-06-16days on market $137,500 Active 78 DOM
-
2026-06-15days on market $137,500 Active 77 DOM
-
2026-06-14days on market $137,500 Active 75 DOM
-
2026-06-13days on market $137,500 Active 74 DOM
-
2026-06-10days on market $137,500 Active 72 DOM
-
2026-06-09days on market $137,500 Active 71 DOM
-
2026-06-08days on market $137,500 Active 70 DOM
-
2026-06-07days on market $137,500 Active 69 DOM
-
2026-06-02days on market $137,500 Active 64 DOM
-
2026-06-01days on market $137,500 Active 63 DOM
-
2026-05-31days on market $137,500 Active 62 DOM
-
2026-05-30days on market $137,500 Active 61 DOM
-
2026-03-30$137,500 Active 961-char remark
Show marketing remark (961 chars)
New Colony model with open floor plan offering 2 bedrooms and 2 full baths, generously sized island in kitchen with electric outlets for additional use of countertop space on island; an abundant amount of kitchen cabinets and space for a kitchen table; large walk in closet in primary bedroom and ceramic tile in large walk in shower in the primary bathroom. Enjoy the beautiful covered front porch while passing the time. Washer and dryer hook up in unit for added convenience. Lot rent includes sewer, trash, road maintenance and snow removal. Holly Village is an all age community and is conveniently located close to town but offers a rural feel. Home is on site but must be set on the lot and stabilized before any showings can take place. New park residents are responsible for $12 per month toward the water bill in addition to the lot rent of $615.00 per month. Financing information is available! (Traditional mortgage will not work for a mobile home).
ⓘ Source: listings_history table (triggers on properties + properties_extension) + one-shot
backfill from property_details.listing_events for pre-trigger history.
Nearby sold comps map
Loading sold comps map…
Walkable amenities ~0.75 mi
Loading nearby amenities…
Taxation est. · year 1
- Rental income
- $19,118
- − Mortgage interest
- −$7,702
- − Property taxes
- −$2,062
- − Insurance
- −$688
- − Repairs & maintenance
- −$1,529
- − Management
- −$1,529
- − Depreciation
- −$4,000
- Taxable income
- $1,607
- Est. tax owed @ 24.0%
- −$386
- After-tax cash flow
- $3,315/yr
For passive investors: Depreciation is non-cash, so a rental often shows a tax loss while cash-flowing — sheltering income. Rental losses are passive: they offset passive income freely, and up to $25,000/yr can offset ordinary (W-2) income if you actively participate and your MAGI is under $100k (phasing out to $0 by $150k); unused losses carry forward. On sale, claimed depreciation is recaptured at up to 25%, and gains may owe capital-gains tax (a 1031 exchange can defer both). Figures are a year-1 estimate at your 24.0% rate — not tax advice; consult a CPA.
Condition & rehab AI · 12 photos
This home is in excellent condition with a good curb appeal and a well-maintained interior. It is move-in ready and would benefit from some minor cosmetic updates to enhance its resale and rental value.
Value-add opportunities
- Both Painting the exterior and interior walls — Fresh paint can enhance the curb appeal and interior aesthetics.
- Both Landscaping the front yard — A well-maintained front yard can improve the home's curb appeal and attract potential buyers/tenants.
- Both Adding a small garden or flower bed — A small garden can enhance the curb appeal and add a touch of greenery to the front yard.
Renovation cost estimate screening
Value-add ROI direction
- Both Painting the exterior and interior walls — Fresh paint can enhance the curb appeal and interior aesthetics. ↑
- Both Landscaping the front yard — A well-maintained front yard can improve the home's curb appeal and attract potential buyers/tenants. ↑
- Both Adding a small garden or flower bed — A small garden can enhance the curb appeal and add a touch of greenery to the front yard. ↑
ⓘ Cost ranges are severity-bucket heuristics (US national rule-of-thumb). Get contractor quotes + a written scope before underwriting a rehab budget.
Schools (NCES district)
- District
- Millville School District
- NCES district ID
- 3410320
- Math proficiency
- 6% ▼ -11.00%
- Reading proficiency
- 28% ▲ 1.00%
- Median HH income
- $48,851
- Composite
- 15.23/100
- National rank
- #9338
- State rank
- #447 of 472 in NJ
Livability — Millville
- Score
- 63/100
- State rank
- #431
- US rank
- #15561
Category grades
Schools grade is shown separately in the Schools card above.
Census & demographics
- Census place
- Millville, NJ
- County
- Cumberland County · 80,266 people
- City population
- 35,228
- Metro
- Vineland-Bridgeton, NJ
- Population (ZIP)
- 35,228
- Household income
- $67,496
- Rent vs Own
- Severe rent burden
- 1761.0
Population outlook (Cumberland County) Hauer SSP2
- Today (2025)
- 152,743 people
- By 2030
- 150,373 · -1.6%
- By 2040
- 146,881 · -3.8%
- By 2050
- 142,653 · -6.6%
- By 2075
- 129,468 · -15.2%
- By 2100
- 107,456 · -29.6%
Race, ethnicity, and origin ACS 2023
- Neighborhood character
- Diverse neighborhood (Simpson 0.60)
- Race & ethnicity
- White 59% Hispanic / Latino 17% Black 15% Two or more races 11% Asian 2%
- Hispanic origin (detail)
- Mexican 4% Puerto Rican 10%
- Common ancestry
- Romanian 4% Lithuanian 2% Slovak 1%
- Foreign-born
- 7% · Canada
- Languages at home
- 85% English-only · Spanish 11% Other Indo-European 1% Other Asian/Pacific 1%
Political lean MEDSL · Cumberland
- 2024 margin
- Toss-up / Even · D 47.6% · R 51.3% · Other 1.1%
- 2008→2024 swing
- -25.4pp toward R · 2008: 21.6pp · 2024: -3.8pp
- All cycles
- 2024: R+3.8 2020: D+6.0 2016: D+5.3 2012: D+23.1 2008: D+21.6
Not yet ingested
- Civics
- —
Market trends
- HPI YoY
- ▼ -111.45%
- Current HPI
- 274.8011
- Rent YoY
- ▲ 1.94%
- Metro
- Vineland-Bridgeton, NJ
- State GDP YoY
- ▲ 2.05%
- F500 in state
- 34
Industry mix (Fortune 500 HQ in NJ)
| Industry | F500 HQs | Revenue |
|---|---|---|
| Consumer Goods | 3 | $31B |
|
||
| Pharmaceuticals | 2 | $153B |
|
||
| Technology | 2 | $21B |
|
||
| Insurance | 2 | $20B |
|
||
| Healthcare | 2 | $19B |
|
||
| Financial Services | 1 | $70B |
|
||
Price history
1 event — show timeline
- 2026-03-30 Listed $137,500 BRIGHT MLS
Cash-flow waterfall
monthlySold comps — $/sqft
last 12 mo · ≤1 miLoading sold comps…