 🌊 Lakefront
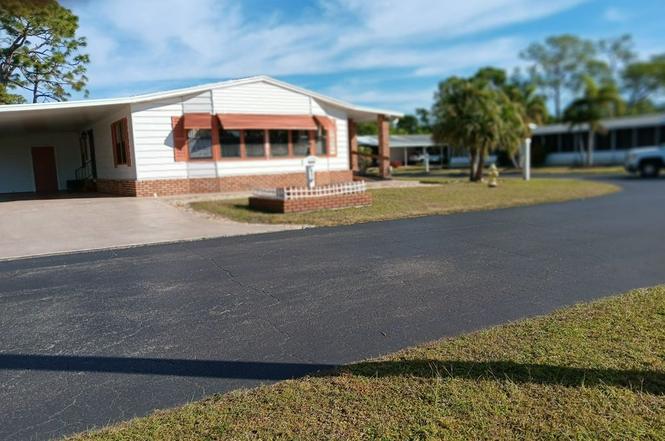
2869 Tara Lakes Cir · North Fort Myers, FL
Flood risk 1/10 · Minimal
- FEMA flood zone
- X (unshaded)
- Chance of flooding over 30 yrs
- 0.0%
- Est. flood insurance / yr
- $507 – $1,088
Fire risk 7/10 · Major
- Est. fire insurance / yr
- $947 – $1,759
Heat risk 10/10 · Severe
- Hot days now (above 107°F)
- 7 days/yr
- Hot days in 30 yrs
- 30 days/yr
Wind risk 10/10 · Severe
- Chance of severe wind over 30 yrs
- 99.0%
Air-quality risk 2/10 · Minimal
- Unhealthy air days now
- 1 days/yr
- Unhealthy air days in 30 yrs
- 1 days/yr
Risk factors via First Street. Map © Google.
Why this score? — see what drove the D+ grade
The composite is a weighted blend of 9 inputs, each scored 0–100. Each bar is that input's sub-score; the figure is the points it added to the 100-point composite (weight × sub-score).
- Cash flow +15.0/30.0
- ARV discount +7.5/15.0
- 1% rule +5.0/10.0
- DSCR +5.0/10.0
- Schools +4.1/10.0
- Livability +3.7/5.0
- Rent growth +3.2/5.0
- Condition / age +2.5/5.0
- Appreciation +0.0/10.0
$44,900
🖨 Deal sheet 📄 Offer letter ✓ Due diligence
Listing remarks
new roof, gutters, carport, utility laundry room. one owner non-smoker. kitchen island cooktop, with stools, 4 season room with porch, huge driveway [3car] rear patio, 2-bedroom, 2 bath, large living room, office/pantry, brand new hot water heater 40-gallon, new washer dryer set, utility sink. approx. 1800 sq ft corner property with lake view Home in Tara Woods, Hometown America located Rt 41 north, North Fort Myers, Fl Gated 55+ community, need to be checked by office. RENT $780.00 ASSUMABLE FOR THE CALANDER YEAR 2026. being sold "as is" previous price was 95k but market soft as of 3/11/2026 a/c unit maintained and repaired
Key facts
- 4 season room
- Huge driveway
- Utility laundry room
Tags
Neighborhood map
What this means for you Summary
Snapshot
- This is a 2-bed/2.0-bath single-family listed at $45k.
Deal economics
- At list price, monthly cash flow is $2k ($24k/yr) — positive.
- The deal already cash-flows at list — no discount required.
- Meets the 1% rule at list price ($3k rent vs $45k).
- Recommended offer: $40k (12.0% below list) — sets the bar for market timing.
- Cap rate 60.3% vs local median 3.6% in North Fort Myers — top-decile yield for the area; either an underpriced asset or a hidden risk that comps aren't pricing in. Stress-test before assuming the spread holds.
Location & tenants
- Location reads 74/100 on livability (#269 in FL, #4,409 nationally) — a middle-class / working-renter tenant base. Strengths: cost of living A+, housing A+, health & safety A+; Watch: employment C-, amenities F, commute F.
- Lee (suburban): math 47% / reading 50% proficiency, ranked #42 of 73 in FL (top 58%) — families likely to look elsewhere, expect single-tenant / working-renter base with shorter leases.
- Market conditions: Rents rising (+2.6%/yr); 841 active listings in the ZIP; 16 comparable units currently listed for rent nearby; rentals at typical pace (median 21d on market — plan ~3-4 weeks tenant-placement turnaround); 15,411 units permitted in Lee County in 2024 (4,686 in 5+ unit buildings).
- At $2,951/mo this rent would consume 64% of the median local household income ($55k/yr) (locally 775% of renters already pay >50% of income on rent) — very limited rent-growth headroom before tenants either downsize or default.
Forward outlook
- Local home prices are declining (-3.0%/yr); year-one equity from $310 of loan paydown is wiped out by about $1k of value loss. Plan a longer hold.
- Lee County population projected at +44% by 2050 — long-run rental-demand tailwind backs the buy-and-hold thesis.
- At projected returns (-3.0% appreciation + 2.6% rent growth), your $13k cash investment doubles in ~1 year — after that, you're playing with house money.
Negotiation context
- It's been on market 178 days — a 12% lower offer ($40k) is reasonable based on typical stale-listing flexibility.
Risks & watch-outs
- Climate carrying-cost: severe wind risk, 99% chance of damaging wind over 30y; major wildfire risk; extreme-heat days projected 7→30/yr by 2055 (HVAC capex compounding) — expect insurance premiums to compound above CPI over the hold.
Questions for the listing agent
- It's been on market 178 days. Have you received any prior offers? Is the seller open to a 12% concession, seller financing, or rate buy-down credit?
- Why hasn't it sold? Are there any deal-killer items the seller is aware of (foundation, flood, title, zoning, code violations)?
- Is there a deadline driving the sale (1031 exchange, divorce, estate, relocation)? That informs how much negotiation room exists.
- The area grade is low — what's the realistic commute time and amenity access for the typical tenant pool here? Any planned neighborhood developments (good or bad) we should know about?
- This sits on a lake — are riparian / water-frontage rights deeded with the parcel? Any dock permits, shoreline easements, or HOA water-use restrictions?
- What's the documented flood / surge / shoreline-erosion history here (FEMA AND non-FEMA — e.g., storm surge, creek backup, septic-field saturation)?
- Any water-quality or seasonal algae-bloom issues that affect tenant satisfaction or short-term-rental demand?
- What's the average days-on-market for RENTAL listings here right now (not sales)? A rising rental-DOM trend means longer vacancies and softer asking-rent achievability than the comps imply.
- What's the recent tenant-quality profile in this submarket — average credit score on applications, eviction rate, late-payment / NSF rate, and stable-employment percentage? A property-management company in the area should have these aggregated.
- How much new for-sale + rental construction is in the pipeline within 1–3 miles? Heavy new supply typically softens prices + rents 12–24 months out; constrained supply supports both.
Investment metrics
- 1% rule
- 6.57% ✓
- Cap rate
- 60.30%
- Cash-on-cash
- 192.89%
- DSCR
- 9.58
- GRM
- 1.3
CMA / ARV
- ARV (on-the-fly)
- $343,800
- Comps found
- 6
Show comp detail 6 sales within ~0.75 mi
| Address | Dist | Beds/Ba | Sqft | Sold | Price | $/sf | Match |
|---|---|---|---|---|---|---|---|
| 20056 Sweetbay Dr | 0.73mi | 3/2.0 (+1) | 1,672 (-7%) | 4mo | $278,500 | $167 | 46 |
| 20457 Camino Torcido Loop | 0.54mi | 3/2.0 (+1) | 1,647 (-8%) | 14mo | $329,900 | $200 | 44 |
| 3200 Magnolia Landing Ln | 0.69mi | 3/2.0 (+1) | 1,997 (+11%) | 6mo | $550,000 | $275 | 39 |
| 20341 Camino Torcido Loop | 0.57mi | 3/2.0 (+1) | 1,670 (-7%) | 23mo | $307,999 | $184 | 38 |
| 20325 Camino Torcido Loop | 0.59mi | 3/2.0 (+1) | 1,670 (-7%) | 24mo | $319,000 | $191 | 36 |
| 20224 Camino Torcido Loop | 0.75mi | 3/2.0 (+1) | 1,670 (-7%) | 16mo | $315,000 | $189 | 34 |
Match score weights: distance 35% · size 25% · config 20% · recency 20%. Top-matched comps best support the ARV.
Projected returns pro-forma
-3.0% appreciation · 2.63% rent growth · sell at horizon
- IRR
- —
- Equity multiple
- 10.58×
- Total profit
- $120,386
- Equity at exit
- $6,695
- IRR
- —
- Equity multiple
- 22.18×
- Total profit
- $266,290
- Equity at exit
- $3,882
Cash invested: $12,572 (down + closing). Projections, not guarantees.
Landlord ↔ Tenant lean methodology
- Overall (STATE)
- 87 Strongly Landlord-Friendly
- State Florida
- 87 Strongly Landlord-Friendly · R+3
- County
- — inherits STATE
- City
- — inherits STATE
ZIP-level market 33917
- Home prices YoY
- -30.2%
- Rents YoY
- 2.6%
- Active inventory
- 841
- Price-to-rent
- 1.3×
Monthly cashflow live
- Estimated rent
- $2,951 high interval (Pro) →
- Mortgage (P&I)
- −$235
- Tax est. 1.5%
- −$56 /mo · $674/yr
- Insurance
- −$19
- HOA
- −$0
- Vacancy / Maint / Mgmt
- −$620
- Net cashflow
- $2,021
Break-even live
UW: 25.0% down · 7.5% · 30yr · 1.5% tax · 5.0% vac · 8.0% maint · 8.0% mgmt
Financing live
Cash to close
- Down payment
- $11,225
- Closing costs
- $1,347
- Reserves months
- —
- Total cash needed
- —
Loan-product check · same deal, 3 products live
Conventional
25% down · 7.5% · 30yr
- Down + closing
- —
- Monthly P&I
- —
- Monthly cashflow
- —
- DSCR
- —
- Eligible?
- —
Personal DTI + credit; lowest rate.
DSCR
20% down · 8.5% · 30yr
- Down + closing
- —
- Monthly P&I
- —
- Monthly cashflow
- —
- DSCR
- —
- Eligible?
- —
No personal income docs; deal must DSCR.
Hard money
10% down · 12.0% · 12mo
- Down + closing
- —
- Monthly P&I
- —
- Monthly cashflow
- —
- DSCR
- —
- Eligible?
- —
Short-term bridge; refi at stabilization.
Rent comps 16 comps
| Address | Beds | Baths | Sqft | Rent | $/sqft | DOM | Units | Dist |
|---|---|---|---|---|---|---|---|---|
| 20559 Long Pond Rd North Fort Myers, FL | 3.0 | 2.0 | 1805 | $2,295 | $1.27 | 23d | 1 | 0.71mi |
| 20056 Sweetbay Dr North Fort Myers, FL | 3.0 | 2.0 | 1672 | $4,000 | $2.39 | 23d | 1 | 0.75mi |
| 20728 Tisbury Ln North Fort Myers, FL | 3.0 | 2.5 | 2133 | $5,000 | $2.34 | 14d | 1 | 0.83mi |
| 20038 Fiddlewood Ave North Fort Myers, FL | 3.0 | 2.0 | 1519 | $1,999 | $1.32 | 19d | 1 | 0.84mi |
| 10401 Circle Pine Rd North Fort Myers, FL | 2.0 | 2.0 | 1294 | $3,000 | $2.32 | 23d | 1 | 1.08mi |
| 2431 Palo Duro Blvd North Fort Myers, FL | 2.0 | 2.0 | 2456 | $2,900 | $1.18 | 23d | 1 | 1.16mi |
| 2481 Palo Duro Blvd North Fort Myers, FL | 3.0 | 2.0 | 1450 | $4,000 | $2.76 | 21d | 1 | 1.20mi |
| 2481 Palo Duro Blvd North Fort Myers, FL | 3.0 | 2.0 | 1450 | $4,000 | $2.76 | 16d | 1 | 1.20mi |
| 19414 Bermuda Ct North Fort Myers, FL | 3.0 | 2.0 | 1251 | $1,499 | $1.20 | 2d | 1 | 1.23mi |
| 19477 Bermuda Ct North Fort Myers, FL | 3.0 | 2.0 | 1460 | $1,499 | $1.03 | 2d | 1 | 1.23mi |
| 4036 Avenue Del Tura North Fort Myers, FL | 2.0 | 2.0 | 1568 | $1,950 | $1.24 | 23d | 1 | 1.23mi |
| 20719 Kaidon Ln North Fort Myers, FL | 2.0 | 2.0 | 1538 | $4,000 | $2.60 | 23d | 1 | 1.24mi |
| 19152 Meadowbrook Ct North Fort Myers, FL | 3.0 | 2.0 | 1251 | $1,499 | $1.20 | 2d | 1 | 1.29mi |
| 2130 Rio Nuevo Dr Unit 1546442P North Fort Myers, FL | 2.0 | 2.0 | 1248 | $4,682 | $3.75 | 14d | 1 | 1.42mi |
| 2300 Valparaiso Blvd North Fort Myers, FL | 2.0 | 2.0 | 1237 | $3,000 | $2.43 | 16d | 1 | 1.50mi |
| 2300 Valparaiso Blvd North Fort Myers, FL | 2.0 | 2.0 | 1237 | $4,000 | $3.23 | 23d | 1 | 1.50mi |
Listing history 9 events
-
2026-06-17days on market $44,900 Active 178 DOM
-
2026-06-16days on market $44,900 Active 177 DOM
-
2026-06-16days on market $44,900 Active 176 DOM
-
2026-06-13days on market $44,900 Active 174 DOM
-
2026-06-09days on market $44,900 Active 170 DOM
-
2026-06-07pricedays on market $44,900 Active 168 DOM
-
2026-06-01days on market $49,900 Active 162 DOM
-
2026-06-01days on market $49,900 Active 161 DOM
-
2025-12-21$49,900 Active
ⓘ Source: listings_history table (triggers on properties + properties_extension) + one-shot
backfill from property_details.listing_events for pre-trigger history.
Climate risk First Street
- Flood 1/10 Low FEMA zone X (unshaded) · 0% chance over 30 yrs
- Wildfire 7/10 Severe
- Heat 10/10 Extreme 7 d/yr ≥107°F today · 30 d/yr by 30 yrs out
- Wind 10/10 Extreme 99% chance of damaging wind over 30 yrs
- Air quality 2/10 Low 1 unhealthy d/yr today · 1 by 30 yrs out
Nearby sold comps map
Loading sold comps map…
Walkable amenities ~0.75 mi
Loading nearby amenities…
Taxation est. · year 1
- Rental income
- $35,410
- − Mortgage interest
- −$2,515
- − Property taxes
- −$674
- − Insurance
- −$224
- − Repairs & maintenance
- −$2,833
- − Management
- −$2,833
- − Depreciation
- −$1,306
- Taxable income
- $25,025
- Est. tax owed @ 24.0%
- −$6,006
- After-tax cash flow
- $18,245/yr
For passive investors: Depreciation is non-cash, so a rental often shows a tax loss while cash-flowing — sheltering income. Rental losses are passive: they offset passive income freely, and up to $25,000/yr can offset ordinary (W-2) income if you actively participate and your MAGI is under $100k (phasing out to $0 by $150k); unused losses carry forward. On sale, claimed depreciation is recaptured at up to 25%, and gains may owe capital-gains tax (a 1031 exchange can defer both). Figures are a year-1 estimate at your 24.0% rate — not tax advice; consult a CPA.
Schools (NCES district)
- District
- Lee
- NCES district ID
- 1201080
- Math proficiency
- 47% ▼ -11.00%
- Reading proficiency
- 50% ▼ -4.00%
- Median HH income
- $49,518
- Composite
- 41.49/100
- National rank
- #3458
- State rank
- #42 of 73 in FL
Livability — North Fort Myers
- Score
- 74/100
- State rank
- #269
- US rank
- #4409
Category grades
Schools grade is shown separately in the Schools card above.
Census & demographics
- Census place
- North Fort Myers, FL
- County
- Lee County · 788,662 people
- City population
- 57,035
- Metro
- Cape Coral-Fort Myers, FL
- Population (ZIP)
- 33,380
- Household income
- $55,000
- Rent vs Own
- Severe rent burden
- 775.0
Population outlook (Lee County) Hauer SSP2
- Today (2025)
- 871,946 people
- By 2030
- 955,468 · +9.6%
- By 2040
- 1,113,587 · +27.7%
- By 2050
- 1,256,891 · +44.1%
- By 2075
- 1,560,270 · +78.9%
- By 2100
- 1,726,848 · +98.0%
Race, ethnicity, and origin ACS 2023
- Neighborhood character
- Predominantly White (85%)
- Race & ethnicity
- White 85% Hispanic / Latino 10% Two or more races 7% Asian 1% Black 1%
- Hispanic origin (detail)
- Mexican 2% Puerto Rican 1% Cuban 3%
- Common ancestry
- Lithuanian 3% Romanian 3% Slovak 2%
- Foreign-born
- 10% · Canada
- Languages at home
- 88% English-only · Spanish 9% Other Indo-European 1% Russian/Polish/Slavic 1%
Political lean MEDSL · Lee
- 2024 margin
- Strong R (+28.4) · D 35.5% · R 63.9%
- 2008→2024 swing
- -18.0pp toward R · 2008: -10.4pp · 2024: -28.4pp
- All cycles
- 2024: R+28.4 2020: R+19.2 2016: R+20.4 2012: R+16.6 2008: R+10.4
Not yet ingested
- Civics
- —
Market trends
- HPI YoY
- ▼ -122.28%
- Current HPI
- 282.2895
- Rent YoY
- ▲ 2.63%
- Metro
- Cape Coral-Fort Myers, FL
- State GDP YoY
- ▲ 3.28%
- F500 in state
- 36
Industry mix (Fortune 500 HQ in FL)
| Industry | F500 HQs | Revenue |
|---|---|---|
| Industrial Technology | 2 | $29B |
|
||
| Insurance | 2 | $17B |
|
||
| Retail | 1 | $60B |
|
||
| Technology Distribution | 1 | $58B |
|
||
| Homebuilding | 1 | $35B |
|
||
| Technology Manufacturing | 1 | $35B |
|
||
Price history
1 event — show timeline
- 2025-12-21 Listed $49,900 ForSaleByOwner.com
Cash-flow waterfall
monthlySold comps — $/sqft
last 12 mo · ≤1 miLoading sold comps…