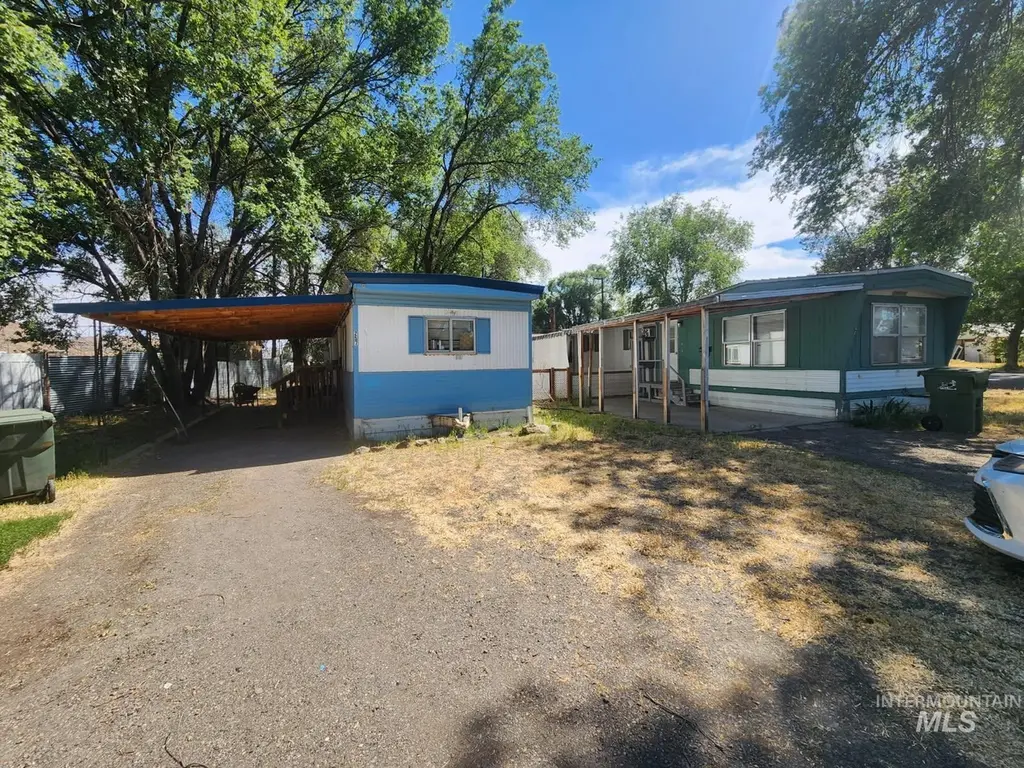
257 D St · Vale, OR
Flood risk 5/10 · Moderate
- FEMA flood zone
- X (shaded)
- Chance of flooding over 30 yrs
- 0.27%
- Est. flood insurance / yr
- $507 – $1,088
Fire risk 7/10 · Major
- Est. fire insurance / yr
- $498 – $926
Heat risk 5/10 · Moderate
- Hot days now (above 98°F)
- 7 days/yr
- Hot days in 30 yrs
- 17 days/yr
Wind risk 1/10 · Minimal
- Chance of severe wind over 30 yrs
- —
Air-quality risk 7/10 · Major
- Unhealthy air days now
- 9 days/yr
- Unhealthy air days in 30 yrs
- 12 days/yr
Risk factors via First Street. Map © Google.
Why this score? — see what drove the D- grade
The composite is a weighted blend of 9 inputs, each scored 0–100. Each bar is that input's sub-score; the figure is the points it added to the 100-point composite (weight × sub-score).
- Appreciation +10.0/10.0
- ARV discount +7.5/15.0
- Cash flow +5.4/30.0
- Schools +3.4/10.0
- Livability +3.4/5.0
- Rent growth +2.5/5.0
- Condition / age +2.5/5.0
- 1% rule +1.0/10.0
- DSCR +0.0/10.0
$160,000
🖨 Deal sheet 📄 Offer letter ✓ Due diligence
Listing remarks MLS
Eureka, You just may have struck GOLD in more ways than one! Purchase this versatile three unit residential complex near the Court House, historic Lytle Field and Vale schools and you can mine your own rich vein of monthly income. Yes, folks, Oregon will permit a gold mine and Vale is at the center of commerce for the mine and housing will be at a premium. 257 D St is occupied and updated and hope to have interior pictures soon. The two vacant units are easy to show and owner has a $4500 bid for roof replacement on the middle unit (448 Bryant St) so the cost to cure has already been factored into the list price. The camper's roof (448A Bryant) also needs some roof repairs and wouldn't take much to be ready for it's next occupant. Owner, selling "As-Is", desires to keep the two units vacant for ease of showing. Zoned commercial, with residential permitted, as well as Multi-Family of more than two, if you want to build new. Contact the helpful planning department at city of Vale for all the details.
Key facts
- Roof replacement
- Rental income
- Investment
Tags
Property features AI
Finance
- Other: Zoned commercial
- Financial info: Six total units; Unit mix: one 2-bed unit (rent $875), two 2-bed units, three 1-bed units; Unit areas: 720 sqft (2-bed types), 200 sqft (1-bed type); Rent includes sewer for at least some units; Cap rate 1.56; Gross rent multiplier 15.24
Exterior
- Parking: Combination of off-street and on-street parking; Total parking for approximately 5 vehicles
- Security: No security features listed
- Utilities: Public water; Public sewer; Electric and gas for fuel and hot water
- Home design: Multi-family property; Not attached; Existing condition; Built in 1969
- Construction: Skirting foundation
- Exterior features: Aluminum exterior; Flat roof; Corner lot; Level lot; Paved public road access
Interior
- Kitchen: Range; Refrigerator
- Bedrooms: Unit type 1: 2 bedrooms; Unit type 2: 2 bedrooms; Unit type 3: 1 bedroom
- Bathrooms: Unit type 1: 1 bathroom; Unit type 2: 1 bathroom; Unit type 3: 1 bathroom
- Heating & cooling: Baseboard heating; Wall heater; Window air conditioning units
- Interior features: Individual storage units; City view
- Laundry & utility: Washer/dryer hookup in some units
Neighborhood map
What this means for you Summary
Snapshot
- This is a 5-bed/3.0-bath manufactured listed at $160k.
Deal economics
- At list price, monthly cash flow is $-345 ($-4k/yr) — negative.
- To cash-flow at today's rent, offer at most $110k (31.2% below list).
- To meet the 1% rule (rent ≥ 1% of price), the offer needs to be $96k (39.8% below list).
- Recommended offer: $96k (39.8% below list) — sets the bar for 1% rule.
- Cap rate 3.7% vs local median 1.5% in Vale — top-decile yield for the area; either an underpriced asset or a hidden risk that comps aren't pricing in. Stress-test before assuming the spread holds.
Location & tenants
- Location reads 68/100 on livability (#155 in OR) — a middle-class / working-renter tenant base. Strengths: cost of living A+, housing A+, crime B+; Watch: amenities F, commute F, employment F.
- Vale SD 84 (rural): math 34% / reading 47% proficiency, ranked #15 of 58 in OR (top 26%) — families likely to look elsewhere, expect single-tenant / working-renter base with shorter leases.
- Zoned schools: Vale Elementary School (math 24% / reading 32%, grade F, #284 of 412 statewide, top 70%, 436 students, 870% FRL); Vale Middle School (math 37% / reading 44%, grade F, #41 of 128 statewide, top 32%, 135 students, 658% FRL); Vale High School (math 24% / reading 74%, grade D, #50 of 143 statewide, top 37%, 291 students, 223% FRL) — zoned schools average 584% FRL vs 50% district-wide (534 pts higher); higher-poverty schools than district average — tighter screening recommended.
- Market conditions: 35 active listings in the ZIP; 44 units permitted in Malheur County in 2024 (0 in 5+ unit buildings).
Forward outlook
- In year one you build about $17k of equity ($1k loan paydown + $16k appreciation (10.0% local appreciation)).
- Malheur County population projected at -20% by 2050 — secular population decline; favor cash flow + early exit over multi-decade hold.
- By year 3, paydown + projected appreciation supports a ~$43k cash-out refi (75% LTV) — recoverable capital for the next deal without selling this one.
Negotiation context
- Only 12 days on market — expect competitive offers; lowballing is unlikely to land.
- 4 sale attempts since 5y ago with the ask held roughly flat each time — persistent listings suggest the price (not the market) is what's stuck; bring a comps-based counter.
- Current owner paid $135k; 19% above their basis — modest negotiation headroom, anchor on the comps not their cost.
Risks & watch-outs
- Climate carrying-cost: moderate flood risk; major wildfire risk; extreme-heat days projected 7→17/yr by 2055 (HVAC capex compounding) — expect insurance premiums to compound above CPI over the hold.
Questions for the listing agent
- What do current leases actually rent for vs. the listed asking? Can we see a recent rent roll and the last 12 months of T-12 income?
- Built in 1969 — when were the roof, HVAC, electrical panel, plumbing, and water heater last replaced?
- Is there a deadline driving the sale (1031 exchange, divorce, estate, relocation)? That informs how much negotiation room exists.
- The area grade is low — what's the realistic commute time and amenity access for the typical tenant pool here? Any planned neighborhood developments (good or bad) we should know about?
- What's the average days-on-market for RENTAL listings here right now (not sales)? A rising rental-DOM trend means longer vacancies and softer asking-rent achievability than the comps imply.
- What's the recent tenant-quality profile in this submarket — average credit score on applications, eviction rate, late-payment / NSF rate, and stable-employment percentage? A property-management company in the area should have these aggregated.
- How much new for-sale + rental construction is in the pipeline within 1–3 miles? Heavy new supply typically softens prices + rents 12–24 months out; constrained supply supports both.
Investment metrics
- 1% rule
- 0.60% ✗
- Cap rate
- 3.70%
- Cash-on-cash
- -9.25%
- DSCR
- 0.59
- GRM
- 13.9
CMA / ARV
No comps found within radius.
Projected returns pro-forma
10.0% appreciation · 3.0% rent growth · sell at horizon
- IRR
- 17.8%
- Equity multiple
- 2.45×
- Total profit
- $65,157
- Equity at exit
- $144,141
- IRR
- 16.7%
- Equity multiple
- 5.67×
- Total profit
- $209,204
- Equity at exit
- $310,845
Cash invested: $44,800 (down + closing). Projections, not guarantees.
Landlord ↔ Tenant lean methodology
- Overall (STATE)
- 28 Tenant-Leaning
- State Oregon
- 28 Tenant-Leaning · D+6
- County
- — inherits STATE
- City
- — inherits STATE
ZIP-level market 97918
- Home prices YoY
- 14.8%
- Active inventory
- 35
- Price-to-rent
- 13.9×
Monthly cashflow live
- Estimated rent
- $962 medium interval (Pro) →
- Mortgage (P&I)
- −$839
- Tax est. 1.5%
- −$200 /mo · $2,400/yr
- Insurance
- −$67
- HOA
- −$0
- Vacancy / Maint / Mgmt
- −$202
- Net cashflow
- $-345
Break-even live
UW: 25.0% down · 7.5% · 30yr · 1.5% tax · 5.0% vac · 8.0% maint · 8.0% mgmt
Financing live
Cash to close
- Down payment
- $40,000
- Closing costs
- $4,800
- Reserves months
- —
- Total cash needed
- —
Loan-product check · same deal, 3 products live
Conventional
25% down · 7.5% · 30yr
- Down + closing
- —
- Monthly P&I
- —
- Monthly cashflow
- —
- DSCR
- —
- Eligible?
- —
Personal DTI + credit; lowest rate.
DSCR
20% down · 8.5% · 30yr
- Down + closing
- —
- Monthly P&I
- —
- Monthly cashflow
- —
- DSCR
- —
- Eligible?
- —
No personal income docs; deal must DSCR.
Hard money
10% down · 12.0% · 12mo
- Down + closing
- —
- Monthly P&I
- —
- Monthly cashflow
- —
- DSCR
- —
- Eligible?
- —
Short-term bridge; refi at stabilization.
Listing history 11 events
-
2026-06-18days on market $160,000 Active 12 DOM
-
2026-06-17days on market $160,000 Active 11 DOM
-
2026-06-16days on market $160,000 Active 10 DOM
-
2026-06-15days on market $160,000 Active 9 DOM
-
2026-06-13days on market $160,000 Active 7 DOM
-
2026-06-12days on market $160,000 Active 6 DOM
-
2026-06-09remarks 575-char remark
-
2026-06-09days on market $160,000 Active 3 DOM
-
2026-06-08days on market $160,000 Active 2 DOM
-
2026-06-07remarks 535-char remark
-
2026-06-07$160,000 Active 1 DOM
ⓘ Source: listings_history table (triggers on properties + properties_extension) + one-shot
backfill from property_details.listing_events for pre-trigger history.
Climate risk First Street
- Flood 5/10 Major FEMA zone X (shaded) · 27% chance over 30 yrs
- Wildfire 7/10 Severe
- Heat 5/10 Major 7 d/yr ≥98°F today · 17 d/yr by 30 yrs out
- Wind 1/10 Low
- Air quality 7/10 Severe 9 unhealthy d/yr today · 12 by 30 yrs out
Nearby sold comps map
Loading sold comps map…
Walkable amenities ~0.75 mi
Loading nearby amenities…
Taxation est. · year 1
- Rental income
- $11,549
- − Mortgage interest
- −$8,962
- − Property taxes
- −$2,400
- − Insurance
- −$800
- − Repairs & maintenance
- −$924
- − Management
- −$924
- − Depreciation
- −$4,655
- Taxable loss
- −$7,116
- Est. tax savings @ 24.0%
- +$1,708
- After-tax cash flow
- $-2,437/yr
For passive investors: Depreciation is non-cash, so a rental often shows a tax loss while cash-flowing — sheltering income. Rental losses are passive: they offset passive income freely, and up to $25,000/yr can offset ordinary (W-2) income if you actively participate and your MAGI is under $100k (phasing out to $0 by $150k); unused losses carry forward. On sale, claimed depreciation is recaptured at up to 25%, and gains may owe capital-gains tax (a 1031 exchange can defer both). Figures are a year-1 estimate at your 24.0% rate — not tax advice; consult a CPA.
Schools (NCES district)
- District
- Vale SD 84
- NCES district ID
- 4100014
- Math proficiency
- 34% ▼ -2.00%
- Reading proficiency
- 47% ▼ -12.00%
- Median HH income
- $40,453
- Composite
- 33.95/100
- National rank
- #5329
- State rank
- #15 of 58 in OR
Livability — Vale
- Score
- 68/100
- State rank
- #155
- US rank
- #9125
Category grades
Schools grade is shown separately in the Schools card above.
Census & demographics
- Census place
- Vale, OR
- Population (ZIP)
- 4,358
Population outlook (Malheur County) Hauer SSP2
- Today (2025)
- 28,275 people
- By 2030
- 27,112 · -4.1%
- By 2040
- 24,731 · -12.5%
- By 2050
- 22,507 · -20.4%
- By 2075
- 17,168 · -39.3%
- By 2100
- 11,382 · -59.7%
Race, ethnicity, and origin ACS 2023
- Neighborhood character
- Predominantly White (83%)
- Race & ethnicity
- White 83% Hispanic / Latino 14% Two or more races 7% Native American 1%
- Hispanic origin (detail)
- Mexican 12%
- Common ancestry
- Italian 7% Slovak 3% Lithuanian 2%
- Foreign-born
- 6% · Canada
- Languages at home
- 89% English-only · Spanish 10% Other Asian/Pacific 1%
Political lean MEDSL · Malheur
- 2024 margin
- Solid R (+44.4) · D 26.4% · R 70.7% · Other 2.9%
- 2008→2024 swing
- -4.0pp toward R · 2008: -40.3pp · 2024: -44.4pp
- All cycles
- 2024: R+44.4 2020: R+41.7 2016: R+49.5 2012: R+41.7 2008: R+40.3
Not yet ingested
- Civics
- —
Market trends
- HPI YoY
- ▲ 45.93%
- Current HPI
- 357.2394
- Rent YoY
- —
- Metro
- —
- State GDP YoY
- ▲ 2.05%
- F500 in state
- 2
Industry mix (Fortune 500 HQ in OR)
| Industry | F500 HQs | Revenue |
|---|---|---|
| Consumer Goods | 1 | $51B |
|
||
Price history
+400.0% since first listed10 events — show timeline
- 2026-06-05 Listed $160,000 IMLS
- 2026-06-05 Listed $160,000 RMLS
- 2024-03-05 Listing Removed — IMLS
- 2024-02-14 Listed $165,000 IMLS
- 2021-08-19 Sold (Public Records) $135,000 Public Records
- 2021-07-30 Listing Removed — IMLS
- 2021-06-05 Pending — IMLS
- 2021-05-21 Listed $135,000 IMLS
- 2015-03-02 Sold (Public Records) $53,000 Public Records
- 2006-04-20 Sold (Public Records) $32,000 Public Records
Property tax history
+5.3%/yrLatest (2025): $107 · +2.1% YoY. Source: county tax records.
Cash-flow waterfall
monthlySold comps — $/sqft
last 12 mo · ≤1 miLoading sold comps…