 Duplex
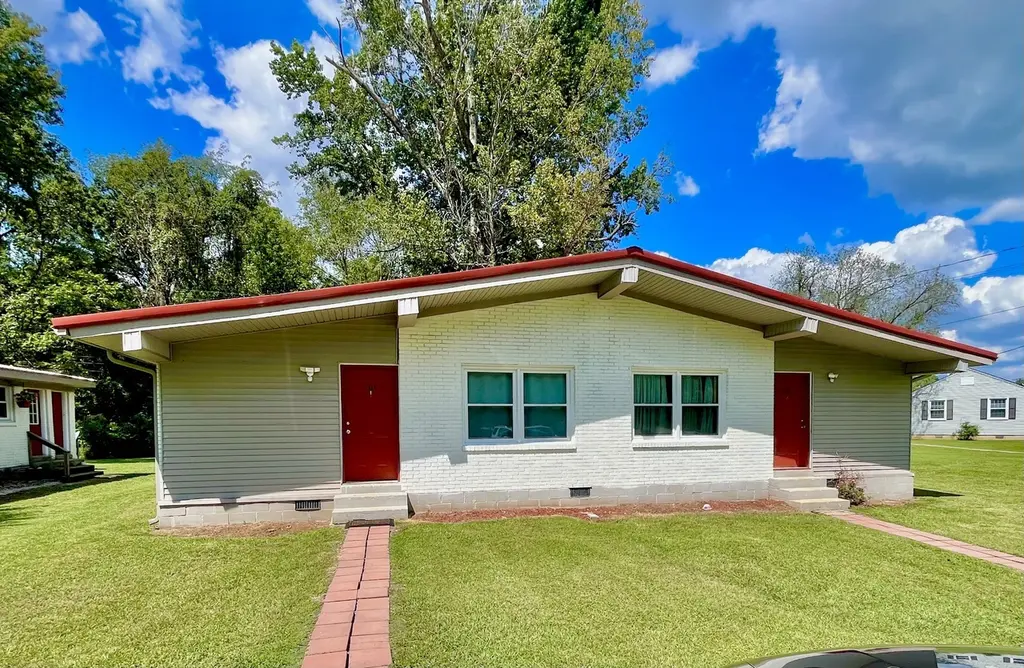
101 Chamberlain Cir · Tullahoma, TN
Flood risk No data
- FEMA flood zone
- —
- Chance of flooding over 30 yrs
- —
- Est. flood insurance / yr
- —
Fire risk No data
- Est. fire insurance / yr
- —
Heat risk No data
- Hot days now (above threshold)
- —
- Hot days in 30 yrs
- —
Wind risk No data
- Chance of severe wind over 30 yrs
- —
Air-quality risk No data
- Unhealthy air days now
- —
- Unhealthy air days in 30 yrs
- —
Risk factors via First Street. Map © Google.
Why this score? — see what drove the C- grade
The composite is a weighted blend of 9 inputs, each scored 0–100. Each bar is that input's sub-score; the figure is the points it added to the 100-point composite (weight × sub-score).
- Cash flow +21.2/30.0
- DSCR +6.8/10.0
- ARV discount +6.2/15.0
- 1% rule +5.6/10.0
- Livability +3.4/5.0
- Rent growth +2.5/5.0
- Condition / age +2.5/5.0
- Schools +2.0/10.0
- Appreciation +0.0/10.0
$240,000
🖨 Deal sheet (PDF) 📄 Offer letter ✓ Due diligence
Multi-family units
County records classify this as Multi-Family (2-4 Unit). Listing-text estimate: 2 units. confirmed
Listing remarks MLS
Great Investment property! This duplex has two bedrooms and one bathroom on each side. Only 15 Minutes form Arnold AFB. New flooring, new paint, new fixtures. Washer & dryer hookups. The duplex next door is also for sale, see listing for 105 Chamberlain circle.
Key facts
- 0.5 acre lot
- 2 parking spots
- Built 1962
Property features AI
Finance
- Other: Zoned Commercial
- Financial info: Property listed as residential income with 2 total units; Gross income reported at $23,040; Net operating income reported at $21,480; Owner pays electricity, gas, and water; Tenants pay cable TV, electricity, and gas
- HOA & community:
Exterior
- Parking: 2 open parking spaces (no covered spaces)
- Security:
- Utilities: Public water; Public sewer; Electricity available
- Home design: Duplex (attached); One level
- Construction: Brick and vinyl siding exterior; Metal roof
- Exterior features: Gravel parking area; Lot dimensions approximately 127 x 172.77 (irregular)
Interior
- Kitchen:
- Bedrooms: Two 2-bedroom units
- Flooring: Laminate
- Bathrooms: Each unit has 1 bathroom
- Heating & cooling: Central electric heating; Central electric air conditioning
- Interior features: Laminate flooring; Individual laundry in each unit; Central heating (electric); Central air conditioning (electric)
- Laundry & utility: Each unit has its own laundry (individual)
Neighborhood map
What this means for you Summary
Snapshot
- This is a 2 × 2-bed/1.0-bath units multifamily listed at $240k.
Deal economics
- At list price, monthly cash flow is $349 ($4k/yr) — positive. Per door: $174/mo.
- The deal already cash-flows at list — no discount required.
- Meets the 1% rule at list price ($3k rent vs $240k).
- Cap rate 8.0% vs local median 3.4% in Tullahoma — top-decile yield for the area; either an underpriced asset or a hidden risk that comps aren't pricing in. Stress-test before assuming the spread holds.
Location & tenants
- Location reads 67/100 on livability (#109 in TN) — a middle-class / working-renter tenant base. Strengths: cost of living A+, housing A+; Watch: health & safety C-, crime D+, employment D+.
- Tullahoma (town): math 23% / reading 24% proficiency, ranked #101 of 139 in TN (top 73%) — low school quality limits family demand, transient renter base, plan for 1-2y turnover.
- Zoned schools: East Lincoln Elementary (math 22% / reading 12%, grade F, #709 of 952 statewide, top 77%, 475 students, 0% FRL); Tullahoma High School (math 15% / reading 32%, grade F, #145 of 332 statewide, top 44%, 1,137 students, 0% FRL) — zoned schools average 0% FRL vs 46% district-wide (46 pts lower); this property's tenant base skews higher-income than the district average.
- Market conditions: 326 active listings in the ZIP; 389 units permitted in Coffee County in 2024 (6 in 5+ unit buildings).
- At $2,541/mo this rent would consume 51% of the median local household income ($60k/yr) (locally 693% of renters already pay >50% of income on rent) — very limited rent-growth headroom before tenants either downsize or default.
Forward outlook
- Local home prices are declining (-3.0%/yr); year-one equity from $2k of loan paydown is wiped out by about $7k of value loss. Plan a longer hold.
- Coffee County population projected at +9% by 2050 — modest demand growth; plan on rents tracking national, not racing it.
Negotiation context
- Only 11 days on market — expect competitive offers; lowballing is unlikely to land.
- 7 sale attempts since 8y ago with the ask held roughly flat each time — persistent listings suggest the price (not the market) is what's stuck; bring a comps-based counter.
- Current owner paid $115k; list at $240k implies a 109% gain — meaningful room to come down on a strong offer.
Questions for the listing agent
- Can we see the unit-by-unit rent roll, current vacancy, and any below-market leases? What's the average tenancy length?
- What capital expenditures (roof, boiler, parking lot, exteriors) have been made in the last 5 years, and what's planned in the next 2?
- Built in 1962 — when were the roof, HVAC, electrical panel, plumbing, and water heater last replaced?
- Is there a deadline driving the sale (1031 exchange, divorce, estate, relocation)? That informs how much negotiation room exists.
- Schools are F-rated, which usually means shorter tenancies and higher turnover. Who's the typical renter profile here, and what's been the actual vacancy rate?
- Crime grade is D in this area — have there been break-ins, vandalism, or insurance claims at this property in the last 3 years? What carrier currently insures it and at what premium?
- What's the average days-on-market for RENTAL listings here right now (not sales)? A rising rental-DOM trend means longer vacancies and softer asking-rent achievability than the comps imply.
- What's the recent tenant-quality profile in this submarket — average credit score on applications, eviction rate, late-payment / NSF rate, and stable-employment percentage? A property-management company in the area should have these aggregated.
- How much new apartment / multifamily construction is in the pipeline within 1–3 miles? Heavy new supply (>2% of stock underway) typically softens rents 12–24 months out; light construction supports rent growth.
Investment metrics
- 1% rule
- 1.06% ✓
- Cap rate
- 8.04%
- Cash-on-cash
- 6.23%
- DSCR
- 1.28
- GRM
- 7.9
CMA / ARV
- ARV (on-the-fly)
- $233,376
- Comps found
- 2
Show comp detail 2 sales within ~0.75 mi
| Address | Dist | Beds/Ba | Sqft | Sold | Price | $/sf | Match |
|---|---|---|---|---|---|---|---|
| 101 Chamberlain Cir | 0.00mi | 4/2.0 | 1,632 (0%) | 0mo | $220,000 | $135 | 100 |
| 404 Chamberlain Dr | 0.05mi | 4/2.0 | 1,568 (-4%) | 14mo | $225,000 | $143 | 79 |
Match score weights: distance 35% · size 25% · config 20% · recency 20%. Top-matched comps best support the ARV.
Projected returns pro-forma
-3.0% appreciation · 3.0% rent growth · sell at horizon
- IRR
- -6.7%
- Equity multiple
- 0.75×
- Total profit
- $-16,636
- Equity at exit
- $35,785
- IRR
- 2.9%
- Equity multiple
- 1.21×
- Total profit
- $14,275
- Equity at exit
- $20,751
Cash invested: $67,200 (down + closing). Projections, not guarantees.
Landlord ↔ Tenant lean methodology
- Overall (STATE)
- 87 Strongly Landlord-Friendly
- State Tennessee
- 87 Strongly Landlord-Friendly · R+13
- County
- — inherits STATE
- City
- — inherits STATE
ZIP-level market 37388
- Home prices YoY
- -19.9%
- Active inventory
- 326
- Price-to-rent
- 15.7×
Monthly cashflow live
- Estimated rent
- $2,541 medium interval (Pro) →
- Mortgage (P&I)
- −$1,259
- Tax est. 1.5%
- −$300 /mo · $3,600/yr
- Insurance
- −$100
- HOA
- −$0
- Vacancy / Maint / Mgmt
- −$534
- Net cashflow
- $349
Break-even live
Sensitivity live
| Price | -10% $515 | -5% $432 | +0% $349 | +5% $266 | +10% $183 |
|---|---|---|---|---|---|
| Rent | -10% $148 | -5% $248 | +0% $349 | +5% $449 | +10% $550 |
| Rate | -1.0pp $470 | -0.5pp $410 | base $349 | +0.5pp $287 | +1.0pp $223 |
2-unit breakdown (identical units grouped — click to expand)
| Units | Beds | Baths | Est. rent |
|---|---|---|---|
| 2× units | 2 | 1 | $2,540 |
| #1 | 2 | 1 | $1,270 |
| #2 | 2 | 1 | $1,270 |
| Total (2 units) | $2,541 | ||
UW: 25.0% down · 7.5% · 30yr · 1.5% tax · 5.0% vac · 8.0% maint · 8.0% mgmt
Financing live
Cash to close
- Down payment
- $60,000
- Closing costs
- $7,200
- Reserves months
- —
- Total cash needed
- —
Loan-product check · same deal, 3 products live
Conventional
25% down · 7.5% · 30yr
- Down + closing
- —
- Monthly P&I
- —
- Monthly cashflow
- —
- DSCR
- —
- Eligible?
- —
Personal DTI + credit; lowest rate.
DSCR
20% down · 8.5% · 30yr
- Down + closing
- —
- Monthly P&I
- —
- Monthly cashflow
- —
- DSCR
- —
- Eligible?
- —
No personal income docs; deal must DSCR.
Hard money
10% down · 12.0% · 12mo
- Down + closing
- —
- Monthly P&I
- —
- Monthly cashflow
- —
- DSCR
- —
- Eligible?
- —
Short-term bridge; refi at stabilization.
Listing history 18 events
-
2026-05-03status Pending
-
2026-04-22$240,000 Active
-
2024-09-30historical
-
2024-09-05$259,000 Active
-
2020-03-03soldstatus $115,000 Closed 267-char remark
Show marketing remark (267 chars)
Great Investment property! This duplex has two bedrooms and one bathroom on each side. Only 15 Minutes form Arnold AFB. New flooring, new paint, new fixtures. Washer & dryer hookups. The duplex next door is also for sale, see listing for 105 Chamberlain circle.
-
2020-01-27historical Contingent - Inspection 267-char remark
Show marketing remark (267 chars)
Great Investment property! This duplex has two bedrooms and one bathroom on each side. Only 15 Minutes form Arnold AFB. New flooring, new paint, new fixtures. Washer & dryer hookups. The duplex next door is also for sale, see listing for 105 Chamberlain circle.
-
2019-12-06status Active 267-char remark
Show marketing remark (267 chars)
Great Investment property! This duplex has two bedrooms and one bathroom on each side. Only 15 Minutes form Arnold AFB. New flooring, new paint, new fixtures. Washer & dryer hookups. The duplex next door is also for sale, see listing for 105 Chamberlain circle.
-
2019-11-26historical Contingent - Inspection 267-char remark
Show marketing remark (267 chars)
Great Investment property! This duplex has two bedrooms and one bathroom on each side. Only 15 Minutes form Arnold AFB. New flooring, new paint, new fixtures. Washer & dryer hookups. The duplex next door is also for sale, see listing for 105 Chamberlain circle.
-
2019-10-24$124,900 Active 267-char remark
Show marketing remark (267 chars)
Great Investment property! This duplex has two bedrooms and one bathroom on each side. Only 15 Minutes form Arnold AFB. New flooring, new paint, new fixtures. Washer & dryer hookups. The duplex next door is also for sale, see listing for 105 Chamberlain circle.
-
2019-02-26historical
-
2019-02-01status Active
-
2019-01-28status Pending
-
2019-01-23price $90,500
-
2019-01-23price $89,500
-
2019-01-02price $91,000
-
2018-11-09historical
-
2018-11-09$99,000 Active
-
2018-10-11$50,000 Active
ⓘ Source: listings_history table (triggers on properties + properties_extension) + one-shot
backfill from property_details.listing_events for pre-trigger history.
Nearby sold comps map
Loading sold comps map…
Walkable amenities ~0.75 mi
Loading nearby amenities…
Taxation est. · year 1
- Rental income
- $30,492
- − Mortgage interest
- −$13,444
- − Property taxes
- −$3,600
- − Insurance
- −$1,200
- − Repairs & maintenance
- −$2,439
- − Management
- −$2,439
- − Depreciation
- −$6,982
- Taxable income
- $388
- Est. tax owed @ 24.0%
- −$93
- After-tax cash flow
- $4,093/yr
For passive investors: Depreciation is non-cash, so a rental often shows a tax loss while cash-flowing — sheltering income. Rental losses are passive: they offset passive income freely, and up to $25,000/yr can offset ordinary (W-2) income if you actively participate and your MAGI is under $100k (phasing out to $0 by $150k); unused losses carry forward. On sale, claimed depreciation is recaptured at up to 25%, and gains may owe capital-gains tax (a 1031 exchange can defer both). Figures are a year-1 estimate at your 24.0% rate — not tax advice; consult a CPA.
Schools (NCES district)
- District
- Tullahoma
- NCES district ID
- 4704200
- Math proficiency
- 23% ▼ -5.00%
- Reading proficiency
- 24% ▼ -4.00%
- Median HH income
- $37,384
- Composite
- 19.61/100
- National rank
- #8752
- State rank
- #101 of 139 in TN
Livability — Tullahoma
- Score
- 67/100
- State rank
- #109
- US rank
- #11169
Category grades
Schools grade is shown separately in the Schools card above.
Census & demographics
- Census place
- Tullahoma, TN
- County
- Coffee County · 57,744 people
- City population
- 27,939
- Metro
- Tullahoma-Manchester, TN
- Population (ZIP)
- 27,939
- Household income
- $59,537
- Rent vs Own
- Severe rent burden
- 693.0
Population outlook (Coffee County) Hauer SSP2
- Today (2025)
- 57,234 people
- By 2030
- 58,571 · +2.3%
- By 2040
- 60,972 · +6.5%
- By 2050
- 62,537 · +9.3%
- By 2075
- 65,694 · +14.8%
- By 2100
- 63,355 · +10.7%
Race, ethnicity, and origin ACS 2023
- Neighborhood character
- Predominantly White (86%)
- Race & ethnicity
- White 86% Two or more races 6% Hispanic / Latino 5% Black 5%
- Hispanic origin (detail)
- Mexican 2%
- Common ancestry
- Slovak 3% Italian 3% Serbian 2%
- Foreign-born
- 2% · Canada, China
- Languages at home
- 96% English-only · Spanish 3%
Political lean MEDSL · Coffee
- 2024 margin
- Solid R (+55.1) · D 21.8% · R 76.9% · Other 1.3%
- 2008→2024 swing
- -25.7pp toward R · 2008: -29.4pp · 2024: -55.1pp
- All cycles
- 2024: R+55.1 2020: R+50.2 2016: R+48.6 2012: R+37.1 2008: R+29.4
Not yet ingested
- Civics
- —
Market trends
- HPI YoY
- ▼ -78.82%
- Current HPI
- 317.7062
- Rent YoY
- —
- Metro
- Tullahoma-Manchester, TN
- State GDP YoY
- ▲ 2.78%
- F500 in state
- 22
Industry mix (Fortune 500 HQ in TN)
| Industry | F500 HQs | Revenue |
|---|---|---|
| Healthcare | 3 | $91B |
|
||
| Retail | 3 | $72B |
|
||
| Transportation / Logistics | 1 | $88B |
|
||
| Paper / Packaging | 1 | $19B |
|
||
| Insurance | 1 | $13B |
|
||
| Energy | 1 | $12B |
|
||
Price history
+380.0% since first listed18 events — show timeline
- 2026-05-03 Pending — REALTRACS as Distributed by MLS Grid
- 2026-04-22 Listed $240,000 REALTRACS as Distributed by MLS Grid
- 2024-09-30 Listing Removed — REALTRACS as Distributed by MLS Grid
- 2024-09-05 Listed $259,000 REALTRACS as Distributed by MLS Grid
- 2020-03-03 Sold (MLS) $115,000 REALTRACS as Distributed by MLS Grid
- 2020-01-27 Contingent — REALTRACS as Distributed by MLS Grid
- 2019-12-06 Relisted — REALTRACS as Distributed by MLS Grid
- 2019-11-26 Contingent — REALTRACS as Distributed by MLS Grid
- 2019-10-24 Listed $124,900 REALTRACS as Distributed by MLS Grid
- 2019-02-26 Listing Removed — REALTRACS as Distributed by MLS Grid
- 2019-02-01 Relisted — REALTRACS as Distributed by MLS Grid
- 2019-01-28 Pending — REALTRACS as Distributed by MLS Grid
- 2019-01-23 Price Changed $90,500 REALTRACS as Distributed by MLS Grid
- 2019-01-23 Price Changed $89,500 REALTRACS as Distributed by MLS Grid
- 2019-01-02 Price Changed $91,000 REALTRACS as Distributed by MLS Grid
- 2018-11-09 Listing Removed — REALTRACS as Distributed by MLS Grid
- 2018-11-09 Listed $99,000 REALTRACS as Distributed by MLS Grid
- 2018-10-11 Listed $50,000 REALTRACS as Distributed by MLS Grid
Cash-flow waterfall
monthlySold comps — $/sqft
last 12 mo · ≤1 miLoading sold comps…