 Triplex
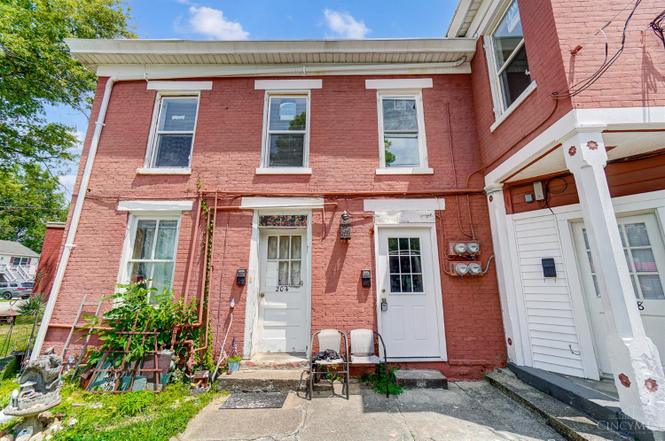
204 Washington St · New Richmond, OH
Flood risk 9/10 · Severe
- FEMA flood zone
- AE
- Chance of flooding over 30 yrs
- 0.99%
- Est. flood insurance / yr
- $1,737 – $8,500
Fire risk 1/10 · Minimal
- Est. fire insurance / yr
- $713 – $1,323
Heat risk 5/10 · Moderate
- Hot days now (above 103°F)
- 7 days/yr
- Hot days in 30 yrs
- 20 days/yr
Wind risk 2/10 · Minimal
- Chance of severe wind over 30 yrs
- 1.0%
Air-quality risk 3/10 · Minor
- Unhealthy air days now
- 2 days/yr
- Unhealthy air days in 30 yrs
- 4 days/yr
Risk factors via First Street. Map © Google.
Why this score? — see what drove the B grade
The composite is a weighted blend of 9 inputs, each scored 0–100. Each bar is that input's sub-score; the figure is the points it added to the 100-point composite (weight × sub-score).
- Cash flow +30.0/30.0
- DSCR +10.0/10.0
- ARV discount +10.0/15.0
- 1% rule +8.6/10.0
- Schools +4.8/10.0
- Livability +3.5/5.0
- Rent growth +2.5/5.0
- Condition / age +2.5/5.0
- Appreciation +0.0/10.0
$285,000
🖨 Deal sheet 📄 Offer letter ✓ Due diligence
Multi-family units
County records classify this as Multi-Family (2-4 Unit). Listing-text estimate: 3 units. confirmed
Listing remarks
Fantastic income producing opportunity in a growing area! Fully occupied three unit building with two one bedroom units downstairs and a larger, two bedroom unit upstairs. Units 206 and 208 have been recently updated and both have their own laundry hook up! Located in the heart of New Richmond near the new Liberty Landing project! Major recent updates include new roof and gutters in 2020, windows and water heater replaced in '24. The hard work is done making this a smart choice if you're a seasoned investor or just starting your portfolio!
Key facts
- Recently updated
- Three unit building
- Laundry hook up
Tags
Property features AI
Finance
- Other: Located on approximately 0.173-acre lot
- Financial info: Total of 3 rental units; Two 1-bedroom units (approx. 750 sq ft) renting at $750 and $750; One 2-bedroom unit (approx. 1,038 sq ft) renting at $1,170; One efficiency/unit renting at $510 (unit-level rents indicate one unit at $510); Heat paid by tenants
Exterior
- Parking: Off-street parking with 4 open spaces
- Utilities: Public water; Public sewer; Natural gas; Gas and electric separately metered (separate gas/electric); Gas and electric billed at listed amount for reference
- Home design: Triplex; Two levels
- Construction: Brick and vinyl siding exterior; Stone foundation; Shingle roof
- Exterior features: Front porch; Vinyl windows
Interior
- Bedrooms: Three separate units: two 1-bedroom units and one 2-bedroom unit
- Bathrooms: Each unit has one full bathroom
- Heating & cooling: Baseboard and electric heating; Forced air heating; Central air; Window air units; Separate furnaces and separate A/C for units
- Interior features: Crawl basement; Individual laundry
- Laundry & utility: Individual laundry provided; Water service paid by owner
Neighborhood map
What this means for you Summary
Snapshot
- This is a 2×1bd/1.0ba + 1×2bd/1.0ba units multifamily listed at $285k.
Deal economics
- At list price, monthly cash flow is $873 ($10k/yr) — positive. Per door: $291/mo.
- The deal already cash-flows at list — no discount required.
- Meets the 1% rule at list price ($4k rent vs $285k).
- Cap rate 11.8% vs local median 2.4% in New Richmond — top-decile yield for the area; either an underpriced asset or a hidden risk that comps aren't pricing in. Stress-test before assuming the spread holds.
Location & tenants
- Location reads 69/100 on livability (#490 in OH) — a middle-class / working-renter tenant base. Strengths: crime A+, cost of living A+, housing A+; Watch: amenities F, commute F, health & safety F.
- New Richmond Exempted Village (rural): math 51% / reading 59% proficiency, ranked #349 of 656 in OH (top 53%) — acceptable for families but not a draw, mixed tenant base, ~2y average lease.
- Market conditions: 48 active listings in the ZIP; solid renter incomes; 996 units permitted in Clermont County in 2024 (210 in 5+ unit buildings).
- At $3,866/mo this rent would consume 48% of the median local household income ($97k/yr) — very limited rent-growth headroom before tenants either downsize or default.
Forward outlook
- Local home prices are declining (-3.0%/yr); year-one equity from $2k of loan paydown is wiped out by about $9k of value loss. Plan a longer hold.
- At projected returns (-3.0% appreciation + 3.0% rent growth), your $80k cash investment doubles in ~9 years — after that, you're playing with house money.
Negotiation context
- Only 3 days on market — expect competitive offers; lowballing is unlikely to land.
- Current owner paid $40k; list at $285k implies a 612% gain — meaningful room to come down on a strong offer.
Risks & watch-outs
- Watch-outs: flood insurance adds $427/mo; built in 1919 — expect roof / HVAC / electrical / plumbing capex.
- Climate carrying-cost: in FEMA flood zone AE (mandatory federal flood insurance); extreme-heat days projected 7→20/yr by 2055 (HVAC capex compounding) — expect insurance premiums to compound above CPI over the hold.
Questions for the listing agent
- Can we see the unit-by-unit rent roll, current vacancy, and any below-market leases? What's the average tenancy length?
- What capital expenditures (roof, boiler, parking lot, exteriors) have been made in the last 5 years, and what's planned in the next 2?
- Built in 1919 — when were the roof, HVAC, electrical panel, plumbing, and water heater last replaced?
- What's the actual annual flood-insurance premium (NFIP or private), and is the property in a SFHA with mandatory coverage?
- Is there a deadline driving the sale (1031 exchange, divorce, estate, relocation)? That informs how much negotiation room exists.
- What's the average days-on-market for RENTAL listings here right now (not sales)? A rising rental-DOM trend means longer vacancies and softer asking-rent achievability than the comps imply.
- What's the recent tenant-quality profile in this submarket — average credit score on applications, eviction rate, late-payment / NSF rate, and stable-employment percentage? A property-management company in the area should have these aggregated.
- How much new apartment / multifamily construction is in the pipeline within 1–3 miles? Heavy new supply (>2% of stock underway) typically softens rents 12–24 months out; light construction supports rent growth.
Investment metrics
- 1% rule
- 1.36% ✓
- Cap rate
- 11.77%
- Cash-on-cash
- 19.55%
- DSCR
- 1.87
- GRM
- 6.1
CMA / ARV
- ARV (on-the-fly)
- $302,022
- Comps found
- 1
Show comp detail 1 sale within ~0.75 mi
| Address | Dist | Beds/Ba | Sqft | Sold | Price | $/sf | Match |
|---|---|---|---|---|---|---|---|
| 201 Washington St | 0.03mi | 2/— (-1) | 2,730 (+8%) | 11mo | $325,000 | $119 | 72 |
Match score weights: distance 35% · size 25% · config 20% · recency 20%. Top-matched comps best support the ARV.
Projected returns pro-forma
-3.0% appreciation · 3.0% rent growth · sell at horizon
- IRR
- 3.1%
- Equity multiple
- 1.12×
- Total profit
- $9,634
- Equity at exit
- $42,494
- IRR
- 12.7%
- Equity multiple
- 2.01×
- Total profit
- $80,784
- Equity at exit
- $24,642
Cash invested: $79,800 (down + closing). Projections, not guarantees.
Landlord ↔ Tenant lean methodology
- Overall (STATE)
- 73 Landlord-Friendly
- State Ohio
- 73 Landlord-Friendly · R+6
- County
- — inherits STATE
- City
- — inherits STATE
ZIP-level market 45157
- Home prices YoY
- -19.1%
- Active inventory
- 48
- Price-to-rent
- 18.3×
Monthly cashflow live
- Estimated rent
- $3,866 medium interval (Pro) →
- Mortgage (P&I)
- −$1,495
- Tax from tax record
- −$141 /mo · $1,690/yr
- Insurance
- −$119
- Flood insurance flood zone
- −$427 /mo · $5,118/yr
- HOA
- −$0
- Vacancy / Maint / Mgmt
- −$812
- Net cashflow
- $873
Break-even live
3-unit breakdown (identical units grouped — click to expand)
| Units | Beds | Baths | Est. rent |
|---|---|---|---|
| 2× units | 1 | 1 | $2,594 |
| #1 | 1 | 1 | $1,297 |
| #2 | 1 | 1 | $1,297 |
| 1× unit | 2 | 1 | $1,272 |
| Total (3 units) | $3,866 | ||
UW: 25.0% down · 7.5% · 30yr · 1.5% tax · 5.0% vac · 8.0% maint · 8.0% mgmt
Financing live
Cash to close
- Down payment
- $71,250
- Closing costs
- $8,550
- Reserves months
- —
- Total cash needed
- —
Loan-product check · same deal, 3 products live
Conventional
25% down · 7.5% · 30yr
- Down + closing
- —
- Monthly P&I
- —
- Monthly cashflow
- —
- DSCR
- —
- Eligible?
- —
Personal DTI + credit; lowest rate.
DSCR
20% down · 8.5% · 30yr
- Down + closing
- —
- Monthly P&I
- —
- Monthly cashflow
- —
- DSCR
- —
- Eligible?
- —
No personal income docs; deal must DSCR.
Hard money
10% down · 12.0% · 12mo
- Down + closing
- —
- Monthly P&I
- —
- Monthly cashflow
- —
- DSCR
- —
- Eligible?
- —
Short-term bridge; refi at stabilization.
Listing history 5 events
-
2026-06-18days on market $285,000 Active 3 DOM
-
2026-06-17remarks 545-char remark
-
2026-06-17days on market $285,000 Active 2 DOM
-
2026-06-16remarks 317-char remark
-
2026-06-16$285,000 Active 1 DOM
ⓘ Source: listings_history table (triggers on properties + properties_extension) + one-shot
backfill from property_details.listing_events for pre-trigger history.
Tax reassessment forecast OH · Partial reset (capped growth)
- Current annual tax
- $1,690 · $141/mo
- Projected year-2 tax
- $3,068 · $256/mo
- Expected delta
- +$1,378/yr (+$115/mo · 81.5%)
ⓘ Screening estimate from a state-policy table — verify with the county assessor before closing.
Climate risk First Street
- Flood 9/10 Extreme FEMA zone AE · 99% chance over 30 yrs
- Wildfire 1/10 Low
- Heat 5/10 Major 7 d/yr ≥103°F today · 20 d/yr by 30 yrs out
- Wind 2/10 Low 100% chance of damaging wind over 30 yrs
- Air quality 3/10 Moderate 2 unhealthy d/yr today · 4 by 30 yrs out
Nearby sold comps map
Loading sold comps map…
Walkable amenities ~0.75 mi
Loading nearby amenities…
Taxation est. · year 1
- Rental income
- $46,392
- − Mortgage interest
- −$15,964
- − Property taxes
- −$1,690
- − Insurance
- −$6,544
- − Repairs & maintenance
- −$3,711
- − Management
- −$3,711
- − Depreciation
- −$8,291
- Taxable income
- $6,480
- Est. tax owed @ 24.0%
- −$1,555
- After-tax cash flow
- $8,926/yr
For passive investors: Depreciation is non-cash, so a rental often shows a tax loss while cash-flowing — sheltering income. Rental losses are passive: they offset passive income freely, and up to $25,000/yr can offset ordinary (W-2) income if you actively participate and your MAGI is under $100k (phasing out to $0 by $150k); unused losses carry forward. On sale, claimed depreciation is recaptured at up to 25%, and gains may owe capital-gains tax (a 1031 exchange can defer both). Figures are a year-1 estimate at your 24.0% rate — not tax advice; consult a CPA.
Schools (NCES district)
- District
- New Richmond Exempted Village
- NCES district ID
- 3904555
- Math proficiency
- 51% ▼ -13.00%
- Reading proficiency
- 59% ▼ -7.00%
- Median HH income
- $60,612
- Composite
- 47.92/100
- National rank
- #2210
- State rank
- #349 of 656 in OH
Livability — New Richmond
- Score
- 69/100
- State rank
- #490
- US rank
- #8208
Category grades
Schools grade is shown separately in the Schools card above.
Census & demographics
- Census place
- New Richmond, OH
- County
- Clermont · 218,829 people
- Metro
- Cincinnati, OH-KY-IN
- Population (ZIP)
- 9,650
- Household income
- $96,875
- Rent vs Own
- Severe rent burden
- 5.4
Population outlook (Clermont County) Hauer SSP2
- Today (2025)
- 210,162 people
- By 2030
- 212,463 · +1.1%
- By 2040
- 212,504 · +1.1%
- By 2050
- 205,957 · -2.0%
- By 2075
- 182,728 · -13.1%
- By 2100
- 143,986 · -31.5%
Race, ethnicity, and origin ACS 2023
- Neighborhood character
- Predominantly White (95%)
- Race & ethnicity
- White 95% Black 2% Two or more races 2%
- Common ancestry
- Italian 2% Romanian 2% Lithuanian 1%
- Foreign-born
- 1%
Political lean MEDSL · Clermont
- 2024 margin
- Solid R (+35.8) · D 31.7% · R 67.4%
- 2008→2024 swing
- -3.4pp toward R · 2008: -32.4pp · 2024: -35.8pp
- All cycles
- 2024: R+35.8 2020: R+36.6 2016: R+41.3 2012: R+35.5 2008: R+32.4
Not yet ingested
- Civics
- —
Market trends
- HPI YoY
- ▼ -73.10%
- Current HPI
- 308.7478
- Rent YoY
- —
- Metro
- —
- State GDP YoY
- ▲ 1.98%
- F500 in state
- 48
Industry mix (Fortune 500 HQ in OH)
| Industry | F500 HQs | Revenue |
|---|---|---|
| Insurance | 3 | $145B |
|
||
| Industrial Machinery | 3 | $49B |
|
||
| Financial Services | 3 | $24B |
|
||
| Consumer Goods | 2 | $93B |
|
||
| Aerospace / Defense | 2 | $47B |
|
||
| Utilities | 2 | $33B |
|
||
Price history
+612.5% since first listed2 events — show timeline
- 2026-06-15 Listed $285,000 Cincy MLS
- 2019-12-27 Sold (Public Records) $40,000 Public Records
Property tax history
+8.1%/yrLatest (2025): $1,690 · -0.2% YoY. Source: county tax records.
Cash-flow waterfall
monthlySold comps — $/sqft
last 12 mo · ≤1 miLoading sold comps…