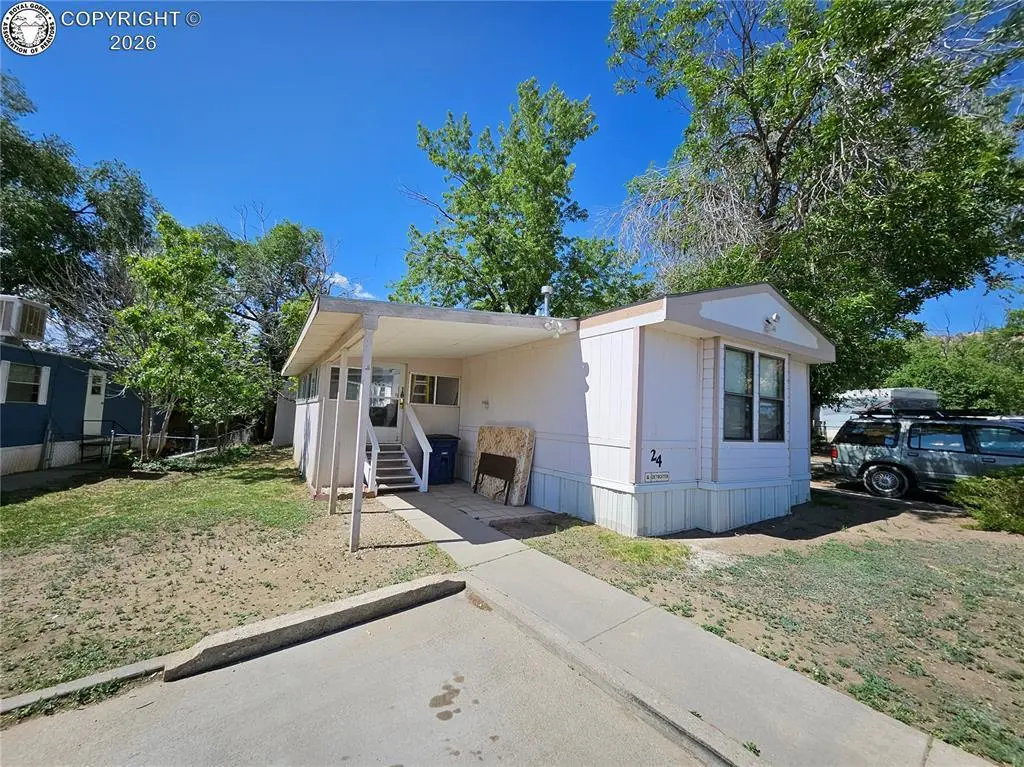
600 Raintree Blvd #24 · Williamsburg, CO
Flood risk 1/10 · Minimal
- FEMA flood zone
- X (unshaded)
- Chance of flooding over 30 yrs
- 0.0%
- Est. flood insurance / yr
- $507 – $1,088
Fire risk 7/10 · Major
- Est. fire insurance / yr
- $939 – $1,743
Heat risk 4/10 · Minor
- Hot days now (above 93°F)
- 8 days/yr
- Hot days in 30 yrs
- 21 days/yr
Wind risk 1/10 · Minimal
- Chance of severe wind over 30 yrs
- —
Air-quality risk 1/10 · Minimal
- Unhealthy air days now
- 0 days/yr
- Unhealthy air days in 30 yrs
- 0 days/yr
Risk factors via First Street. Map © Google.
Why this score? — see what drove the B- grade
The composite is a weighted blend of 9 inputs, each scored 0–100. Each bar is that input's sub-score; the figure is the points it added to the 100-point composite (weight × sub-score).
- Cash flow +30.0/30.0
- 1% rule +10.0/10.0
- DSCR +10.0/10.0
- ARV discount +4.3/15.0
- Rent growth +3.1/5.0
- Schools +2.7/10.0
- Livability +2.7/5.0
- Condition / age +2.5/5.0
- Appreciation +0.0/10.0
$69,900
🖨 Deal sheet 📄 Offer letter ✓ Due diligence
Listing remarks
This beautifully remodeled 3-bedroom, 2-bath mobile home offers comfort, style, and affordability in a welcoming mobile home park community. From the moment you step inside, you’ll appreciate the fresh updates and thoughtful improvements that make this home truly move-in ready. The spacious living area features an open and inviting layout with updated flooring, modern finishes, and plenty of natural light throughout. The kitchen has been nicely updated with attractive cabinetry, ample counter space, and room for everyday dining and entertaining. The primary bedroom includes a private full bath, while the additional bedrooms provide flexibility for family, guests, or a home office. Gue
Key facts
- Built 1988
- Listed 20 days
Property features AI
Exterior
- Utilities: Public water; Public sewer; Cable available; Electricity connected; Natural gas connected
- Home design: Single-family residential
- Construction: Wood siding
- Exterior features: Enclosed patio/porch; Level lot
Interior
- Flooring: Carpet; Vinyl
- Bathrooms: 2 full bathrooms
- Heating & cooling: Forced air heating (natural gas); Electric cooling; Window AC unit(s)
- Interior features: Storm windows; No fireplace
Neighborhood map
What this means for you Summary
Snapshot
- This is a 3-bed/2.0-bath manufactured listed at $70k.
Deal economics
- At list price, monthly cash flow is $922 ($11k/yr) — positive.
- The deal already cash-flows at list — no discount required.
- Meets the 1% rule at list price ($2k rent vs $70k).
- Recommended offer: $69k (1.5% below list) — sets the bar for market timing.
Location & tenants
- Location reads 54/100 on livability (#356 in CO) — a working-class tenant base; expect higher turnover. Strengths: cost of living A+, housing A+; Watch: health & safety C-, schools F, crime F.
- Fremont Re-2 (town): math 25% / reading 39% proficiency, ranked #48 of 86 in CO (top 56%) — families likely to look elsewhere, expect single-tenant / working-renter base with shorter leases.
- Market conditions: Rents rising (+2.2%/yr); 10 active listings in the ZIP; 139 units permitted in Fremont County in 2024 (0 in 5+ unit buildings).
- This rent runs 33% of the median local income ($64k/yr) — at the standard rent-burdened threshold; future hikes will face affordability resistance.
Forward outlook
- Local home prices are declining (-3.0%/yr); year-one equity from $483 of loan paydown is wiped out by about $2k of value loss. Plan a longer hold.
- Fremont County population projected to shrink 5% by 2050 — rents likely to lag national; underwrite the cash flow, not the appreciation.
- At projected returns (-3.0% appreciation + 2.2% rent growth), your $20k cash investment doubles in ~3 years — after that, you're playing with house money.
Negotiation context
- It's been on market 21 days — a 2% lower offer ($69k) is reasonable based on typical stale-listing flexibility.
Risks & watch-outs
- Climate carrying-cost: major wildfire risk — expect insurance premiums to compound above CPI over the hold.
Questions for the listing agent
- Is there a deadline driving the sale (1031 exchange, divorce, estate, relocation)? That informs how much negotiation room exists.
- Schools are F-rated, which usually means shorter tenancies and higher turnover. Who's the typical renter profile here, and what's been the actual vacancy rate?
- Crime grade is F in this area — have there been break-ins, vandalism, or insurance claims at this property in the last 3 years? What carrier currently insures it and at what premium?
- What's the average days-on-market for RENTAL listings here right now (not sales)? A rising rental-DOM trend means longer vacancies and softer asking-rent achievability than the comps imply.
- What's the recent tenant-quality profile in this submarket — average credit score on applications, eviction rate, late-payment / NSF rate, and stable-employment percentage? A property-management company in the area should have these aggregated.
- How much new for-sale + rental construction is in the pipeline within 1–3 miles? Heavy new supply typically softens prices + rents 12–24 months out; constrained supply supports both.
Investment metrics
- 1% rule
- 2.54% ✓
- Cap rate
- 22.12%
- Cash-on-cash
- 56.53%
- DSCR
- 3.52
- GRM
- 3.3
CMA / ARV
- ARV (on-the-fly)
- $65,296
- Comps found
- 1
Show comp detail 1 sale within ~0.75 mi
| Address | Dist | Beds/Ba | Sqft | Sold | Price | $/sf | Match |
|---|---|---|---|---|---|---|---|
| 600 Raintree Blvd | 0.00mi | 3/2.0 | 1,088 (-12%) | 9mo | $58,000 | $53 | 73 |
Match score weights: distance 35% · size 25% · config 20% · recency 20%. Top-matched comps best support the ARV.
Projected returns pro-forma
-3.0% appreciation · 2.2% rent growth · sell at horizon
- IRR
- 54.0%
- Equity multiple
- 3.35×
- Total profit
- $46,005
- Equity at exit
- $10,422
- IRR
- 58.9%
- Equity multiple
- 6.62×
- Total profit
- $110,053
- Equity at exit
- $6,044
Cash invested: $19,572 (down + closing). Projections, not guarantees.
Landlord ↔ Tenant lean methodology
- Overall (STATE)
- 38 Tenant-Leaning
- State Colorado
- 38 Tenant-Leaning · D+4
- County
- — inherits STATE
- City
- — inherits STATE
ZIP-level market 81212
- Rents YoY
- 2.2%
- Active inventory
- 10
- Price-to-rent
- 3.3×
Monthly cashflow live
- Estimated rent
- $1,779 medium interval (Pro) →
- Mortgage (P&I)
- −$367
- Tax est. 1.5%
- −$87 /mo · $1,048/yr
- Insurance
- −$29
- HOA
- −$0
- Vacancy / Maint / Mgmt
- −$374
- Net cashflow
- $922
Break-even live
UW: 25.0% down · 7.5% · 30yr · 1.5% tax · 5.0% vac · 8.0% maint · 8.0% mgmt
Financing live
Cash to close
- Down payment
- $17,475
- Closing costs
- $2,097
- Reserves months
- —
- Total cash needed
- —
Loan-product check · same deal, 3 products live
Conventional
25% down · 7.5% · 30yr
- Down + closing
- —
- Monthly P&I
- —
- Monthly cashflow
- —
- DSCR
- —
- Eligible?
- —
Personal DTI + credit; lowest rate.
DSCR
20% down · 8.5% · 30yr
- Down + closing
- —
- Monthly P&I
- —
- Monthly cashflow
- —
- DSCR
- —
- Eligible?
- —
No personal income docs; deal must DSCR.
Hard money
10% down · 12.0% · 12mo
- Down + closing
- —
- Monthly P&I
- —
- Monthly cashflow
- —
- DSCR
- —
- Eligible?
- —
Short-term bridge; refi at stabilization.
Listing history 11 events
-
2026-06-09days on market $69,900 Active 21 DOM
-
2026-06-08days on market $69,900 Active 20 DOM
-
2026-06-07days on market $69,900 Active 19 DOM
-
2026-06-05days on market $69,900 Active 16 DOM
-
2026-06-03days on market $69,900 Active 15 DOM
-
2026-06-03price $69,900 Active 14 DOM
-
2026-06-02days on market $75,000 Active 14 DOM
-
2026-06-01days on market $75,000 Active 13 DOM
-
2026-05-31days on market $75,000 Active 12 DOM
-
2026-05-30days on market $75,000 Active 11 DOM
-
2026-05-20$75,000 Active
ⓘ Source: listings_history table (triggers on properties + properties_extension) + one-shot
backfill from property_details.listing_events for pre-trigger history.
Climate risk First Street
- Flood 1/10 Low FEMA zone X (unshaded) · 0% chance over 30 yrs
- Wildfire 7/10 Severe
- Heat 4/10 Moderate 8 d/yr ≥93°F today · 21 d/yr by 30 yrs out
- Wind 1/10 Low
- Air quality 1/10 Low 0 unhealthy d/yr today · 0 by 30 yrs out
Nearby sold comps map
Loading sold comps map…
Walkable amenities ~0.75 mi
Loading nearby amenities…
Taxation est. · year 1
- Rental income
- $21,343
- − Mortgage interest
- −$3,915
- − Property taxes
- −$1,048
- − Insurance
- −$350
- − Repairs & maintenance
- −$1,707
- − Management
- −$1,707
- − Depreciation
- −$2,033
- Taxable income
- $10,582
- Est. tax owed @ 24.0%
- −$2,540
- After-tax cash flow
- $8,525/yr
For passive investors: Depreciation is non-cash, so a rental often shows a tax loss while cash-flowing — sheltering income. Rental losses are passive: they offset passive income freely, and up to $25,000/yr can offset ordinary (W-2) income if you actively participate and your MAGI is under $100k (phasing out to $0 by $150k); unused losses carry forward. On sale, claimed depreciation is recaptured at up to 25%, and gains may owe capital-gains tax (a 1031 exchange can defer both). Figures are a year-1 estimate at your 24.0% rate — not tax advice; consult a CPA.
Schools (NCES district)
- District
- Fremont Re-2
- NCES district ID
- 0803960
- Math proficiency
- 25% ▲ 3.00%
- Reading proficiency
- 39% ▼ -1.00%
- Median HH income
- $42,196
- Composite
- 27.06/100
- National rank
- #7050
- State rank
- #48 of 86 in CO
Livability — Williamsburg
- Score
- 54/100
- State rank
- #356
- US rank
- #23823
Category grades
Schools grade is shown separately in the Schools card above.
Census & demographics
- Census place
- Williamsburg, CO
- County
- Fremont County · 32,292 people
- Metro
- Ca-¦on City, CO
- Population (ZIP)
- 32,292
- Household income
- $64,235
- Rent vs Own
- Severe rent burden
- 780.0
Population outlook (Fremont County) Hauer SSP2
- Today (2025)
- 46,291 people
- By 2030
- 46,017 · -0.6%
- By 2040
- 45,295 · -2.2%
- By 2050
- 43,881 · -5.2%
- By 2075
- 39,981 · -13.6%
- By 2100
- 31,943 · -31.0%
Race, ethnicity, and origin ACS 2023
- Neighborhood character
- Predominantly White (79%)
- Race & ethnicity
- White 79% Hispanic / Latino 13% Two or more races 6% Black 3% Native American 1%
- Hispanic origin (detail)
- Mexican 3%
- Common ancestry
- Slovak 4% Portuguese 2% Lithuanian 2%
- Foreign-born
- 2% · Canada
- Languages at home
- 95% English-only · Spanish 4%
Political lean MEDSL · Fremont
- 2024 margin
- Solid R (+38.4) · D 29.6% · R 68.0% · Other 2.5%
- 2008→2024 swing
- -9.2pp toward R · 2008: -29.2pp · 2024: -38.4pp
- All cycles
- 2024: R+38.4 2020: R+39.7 2016: R+44.8 2012: R+31.8 2008: R+29.2
Not yet ingested
- Civics
- —
Market trends
- HPI YoY
- ▼ -213.34%
- Current HPI
- 189.8942
- Rent YoY
- ▲ 2.20%
- Metro
- Ca-¦on City, CO
- State GDP YoY
- ▲ 1.95%
- F500 in state
- 14
Industry mix (Fortune 500 HQ in CO)
| Industry | F500 HQs | Revenue |
|---|---|---|
| Technology Distribution | 1 | $31B |
|
||
| Food / Agriculture | 1 | $18B |
|
||
| Packaging | 1 | $14B |
|
||
| Healthcare | 1 | $13B |
|
||
| Energy | 1 | $10B |
|
||
| Technology | 1 | $4B |
|
||
Price history
1 event — show timeline
- 2026-05-20 Listed $75,000 RGAR
Property tax history
-10.3%/yrLatest (2021): $38 · +7.3% YoY. Source: county tax records.
Cash-flow waterfall
monthlySold comps — $/sqft
last 12 mo · ≤1 miLoading sold comps…