 Multi-family
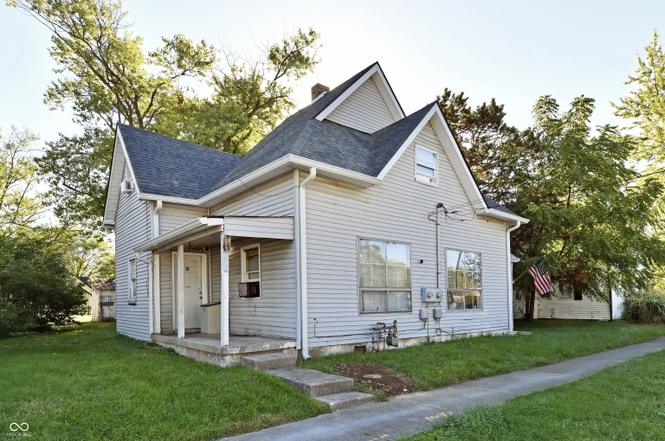
507 S Pennsylvania St · Greenfield, IN
Flood risk 1/10 · Minimal
- FEMA flood zone
- X (unshaded)
- Chance of flooding over 30 yrs
- 0.0%
- Est. flood insurance / yr
- $507 – $1,088
Fire risk 1/10 · Minimal
- Est. fire insurance / yr
- $717 – $1,331
Heat risk 3/10 · Minor
- Hot days now (above 102°F)
- 7 days/yr
- Hot days in 30 yrs
- 18 days/yr
Wind risk 2/10 · Minimal
- Chance of severe wind over 30 yrs
- 1.0%
Air-quality risk 2/10 · Minimal
- Unhealthy air days now
- 1 days/yr
- Unhealthy air days in 30 yrs
- 2 days/yr
Risk factors via First Street. Map © Google.
Why this score? — see what drove the C+ grade
The composite is a weighted blend of 9 inputs, each scored 0–100. Each bar is that input's sub-score; the figure is the points it added to the 100-point composite (weight × sub-score).
- Cash flow +30.0/30.0
- 1% rule +10.0/10.0
- DSCR +10.0/10.0
- Schools +4.0/10.0
- Livability +3.7/5.0
- Rent growth +3.2/5.0
- Condition / age +2.5/5.0
- ARV discount +1.3/15.0
- Appreciation +0.0/10.0
$150,000
🖨 Deal sheet (PDF) 📄 Offer letter ✓ Due diligence
Multi-family units
County records classify this as Multi-Family (2-4 Unit). Listing-text estimate: 1 unit. estimate disagrees with records
Listing remarks
Discover a remarkable investment opportunity in the heart of Greenfield, Indiana, at 507-509 S Pennsylvania St. This inviting home is poised for your finishing touches, setting the stage for a lucrative cash-flowing property. Unit 509 offers an impressive layout with 3 spacious bedrooms, 1 bathroom, and a versatile loft currently used as a 4th bedroom. You'll also find a living room, a kitchen/breakfast area, and an enclosed porch equipped with washer/dryer hookups. Currently, this unit is generating a steady income of $1,200 per month, with a lease in place until August 2026. While the kitchen floor needs some repairs and both the kitchen and bathroom could use a modern update, the potenti
Key facts
- New water heaters
- Washer dryer hookups
- Enclosed porch
Tags
Property features AI
Finance
- Other: Property currently used for residential income; Lot approximately 0.14 acres (<1/4 acre)
- Financial info: Gross potential income reported as $20,400 annually; Operating expenses reported as $0
Exterior
- Parking: On-street parking
- Utilities: Municipal solid waste service; Separate gas meter
- Home design: Duplex residential income property; Two-story building
- Construction: Vinyl siding construction
- Exterior features: Shingle roof; Asphalt road access with street cuts
Interior
- Kitchen: Unit 1 kitchen approximately 10x8; Unit 2 kitchen approximately 8x10
- Bedrooms: One unit is a 3-bedroom (2 levels); One unit is a 1-bedroom (single level)
- Interior features: Forced air heating; Window air conditioning units; Separate gas meter for building
- Laundry & utility: Laundry connections in units
Neighborhood map
What this means for you Summary
Snapshot
- This is a 4-bed/2.0-bath multifamily listed at $150k.
Deal economics
- At list price, monthly cash flow is $1k ($18k/yr) — positive.
- The deal already cash-flows at list — no discount required.
- Meets the 1% rule at list price ($3k rent vs $150k).
- Recommended offer: $132k (12.0% below list) — sets the bar for market timing.
- Cap rate 18.1% vs local median 4.7% in Greenfield — top-decile yield for the area; either an underpriced asset or a hidden risk that comps aren't pricing in. Stress-test before assuming the spread holds.
Location & tenants
- Location reads 73/100 on livability (#88 in IN) — a middle-class / working-renter tenant base. Strengths: cost of living A+, housing A+; Watch: amenities F, commute F.
- Greenfield-Central Community Schools (other): math 47% / reading 45% proficiency, ranked #83 of 301 in IN (top 28%) — families likely to look elsewhere, expect single-tenant / working-renter base with shorter leases.
- Zoned schools: Greenfield-Central High School (math 37% / reading 65%, grade D+, #115 of 369 statewide, top 31%, 1,462 students, 35% FRL).
- Market conditions: Rents rising (+2.9%/yr); 481 active listings in the ZIP; 5 comparable units currently listed for rent nearby; rentals leasing fast (median 12d on market — plan ~1-2 weeks tenant-placement turnaround); solid renter incomes; 1,091 units permitted in Hancock County in 2024 (0 in 5+ unit buildings).
- At $3,174/mo this rent would consume 46% of the median local household income ($83k/yr) (locally 795% of renters already pay >50% of income on rent) — very limited rent-growth headroom before tenants either downsize or default.
Forward outlook
- Local home prices are declining (-3.0%/yr); year-one equity from $1k of loan paydown is wiped out by about $4k of value loss. Plan a longer hold.
- Hancock County population projected at +7% by 2050 — modest demand growth; plan on rents tracking national, not racing it.
- At projected returns (-3.0% appreciation + 2.9% rent growth), your $42k cash investment doubles in ~3 years — after that, you're playing with house money.
Negotiation context
- It's been on market 243 days — a 12% lower offer ($132k) is reasonable based on typical stale-listing flexibility.
- 2 sale attempts; this cycle's ask has dropped $10k (6%) from the opening price — seller is motivated, your offer sets the floor, not the list.
Risks & watch-outs
- Watch-outs: built in 1900 — expect roof / HVAC / electrical / plumbing capex.
Questions for the listing agent
- It's been on market 243 days. Have you received any prior offers? Is the seller open to a 12% concession, seller financing, or rate buy-down credit?
- Built in 1900 — when were the roof, HVAC, electrical panel, plumbing, and water heater last replaced?
- Why hasn't it sold? Are there any deal-killer items the seller is aware of (foundation, flood, title, zoning, code violations)?
- Is there a deadline driving the sale (1031 exchange, divorce, estate, relocation)? That informs how much negotiation room exists.
- Schools are B-rated — typically a magnet for longer-tenancy family renters. What's the average tenant stay here, and is there a school-zone premium baked into asking?
- What's the average days-on-market for RENTAL listings here right now (not sales)? A rising rental-DOM trend means longer vacancies and softer asking-rent achievability than the comps imply.
- What's the recent tenant-quality profile in this submarket — average credit score on applications, eviction rate, late-payment / NSF rate, and stable-employment percentage? A property-management company in the area should have these aggregated.
- How much new apartment / multifamily construction is in the pipeline within 1–3 miles? Heavy new supply (>2% of stock underway) typically softens rents 12–24 months out; light construction supports rent growth.
Investment metrics
- 1% rule
- 2.12% ✓
- Cap rate
- 18.06%
- Cash-on-cash
- 42.02%
- DSCR
- 2.87
- GRM
- 3.9
CMA / ARV
- ARV (on-the-fly)
- $131,880
- Comps found
- 1
Show comp detail 1 sale within ~0.75 mi
| Address | Dist | Beds/Ba | Sqft | Sold | Price | $/sf | Match |
|---|---|---|---|---|---|---|---|
| 515 E Main St | 0.54mi | 3/2.0 (-1) | 2,098 (-4%) | 14mo | $125,000 | $60 | 51 |
Match score weights: distance 35% · size 25% · config 20% · recency 20%. Top-matched comps best support the ARV.
Projected returns pro-forma
-3.0% appreciation · 2.88% rent growth · sell at horizon
- IRR
- 38.6%
- Equity multiple
- 2.64×
- Total profit
- $69,037
- Equity at exit
- $22,365
- IRR
- 45.0%
- Equity multiple
- 5.27×
- Total profit
- $179,371
- Equity at exit
- $12,969
Cash invested: $42,000 (down + closing). Projections, not guarantees.
Landlord ↔ Tenant lean methodology
- Overall (STATE)
- 90 Strongly Landlord-Friendly
- State Indiana
- 90 Strongly Landlord-Friendly · R+11
- County
- — inherits STATE
- City
- — inherits STATE
ZIP-level market 46140
- Rents YoY
- 2.9%
- Active inventory
- 481
- Price-to-rent
- 6.9×
Monthly cashflow live
- Estimated rent
- $3,174 high interval (Pro) →
- Mortgage (P&I)
- −$787
- Tax est. 1.5%
- −$188 /mo · $2,250/yr
- Insurance
- −$62
- HOA
- −$0
- Vacancy / Maint / Mgmt
- −$667
- Net cashflow
- $1,471
Break-even live
Sensitivity live
| Price | -10% $1,575 | -5% $1,523 | +0% $1,471 | +5% $1,419 | +10% $1,367 |
|---|---|---|---|---|---|
| Rent | -10% $1,220 | -5% $1,345 | +0% $1,471 | +5% $1,596 | +10% $1,722 |
| Rate | -1.0pp $1,546 | -0.5pp $1,509 | base $1,471 | +0.5pp $1,432 | +1.0pp $1,392 |
2-unit breakdown (identical units grouped — click to expand)
| Units | Beds | Baths | Est. rent |
|---|---|---|---|
| 1× unit | 3 | 1 | $1,808 |
| 1× unit | 1 | 1 | $1,366 |
| Total (2 units) | $3,174 | ||
UW: 25.0% down · 7.5% · 30yr · 1.5% tax · 5.0% vac · 8.0% maint · 8.0% mgmt
Financing live
Cash to close
- Down payment
- $37,500
- Closing costs
- $4,500
- Reserves months
- —
- Total cash needed
- —
Loan-product check · same deal, 3 products live
Conventional
25% down · 7.5% · 30yr
- Down + closing
- —
- Monthly P&I
- —
- Monthly cashflow
- —
- DSCR
- —
- Eligible?
- —
Personal DTI + credit; lowest rate.
DSCR
20% down · 8.5% · 30yr
- Down + closing
- —
- Monthly P&I
- —
- Monthly cashflow
- —
- DSCR
- —
- Eligible?
- —
No personal income docs; deal must DSCR.
Hard money
10% down · 12.0% · 12mo
- Down + closing
- —
- Monthly P&I
- —
- Monthly cashflow
- —
- DSCR
- —
- Eligible?
- —
Short-term bridge; refi at stabilization.
Rent comps 5 comps
| Address | Beds | Baths | Sqft | Rent | $/sqft | DOM | Units | Dist |
|---|---|---|---|---|---|---|---|---|
| 713 Cattail Dr Greenfield, IN | 3.0 | 2.0 | 1498 | $2,045 | $1.37 | 4d | 1 | 0.38mi |
| 683 Horsetail Dr Greenfield, IN | 5.0 | 3.0 | 2600 | $2,379 | $0.92 | 15d | 1 | 0.50mi |
| 876 Marsh Aster Dr Greenfield, IN | 4.0 | 2.0 | 1771 | $2,245 | $1.27 | 11d | 1 | 0.61mi |
| 968 Lotus Dr Greenfield, IN | 3.0–5.0 | 2.0–3.0 | 2049 | $2,245 | $1.10 | 2d | 8 | 0.66mi |
| 1027 E Fourth St Greenfield, IN | 3.0 | 2.0 | 1430 | $1,700 | $1.19 | 24d | 1 | 1.09mi |
Listing history 18 events
-
2026-06-17status $150,000 Pending 243 DOM
-
2026-06-17days on market $150,000 Active 243 DOM
-
2026-06-16days on market $150,000 Active 242 DOM
-
2026-06-15days on market $150,000 Active 241 DOM
-
2026-06-13days on market $150,000 Active 239 DOM
-
2026-06-13days on market $150,000 Active 238 DOM
-
2026-06-09days on market $150,000 Active 235 DOM
-
2026-06-08days on market $150,000 Active 234 DOM
-
2026-06-07days on market $150,000 Active 233 DOM
-
2026-06-05days on market $150,000 Active 230 DOM
-
2026-06-03days on market $150,000 Active 229 DOM
-
2026-06-02days on market $150,000 Active 228 DOM
-
2026-06-01days on market $150,000 Active 227 DOM
-
2026-05-31days on market $150,000 Active 226 DOM
-
2026-05-01price $150,000
-
2026-01-13status Active
-
2026-01-10status Pending
-
2025-10-13$160,000 Active
ⓘ Source: listings_history table (triggers on properties + properties_extension) + one-shot
backfill from property_details.listing_events for pre-trigger history.
Climate risk First Street
- Flood 1/10 Low FEMA zone X (unshaded) · 0% chance over 30 yrs
- Wildfire 1/10 Low
- Heat 3/10 Moderate 7 d/yr ≥102°F today · 18 d/yr by 30 yrs out
- Wind 2/10 Low 100% chance of damaging wind over 30 yrs
- Air quality 2/10 Low 1 unhealthy d/yr today · 2 by 30 yrs out
Nearby sold comps map
Loading sold comps map…
Walkable amenities ~0.75 mi
Loading nearby amenities…
Taxation est. · year 1
- Rental income
- $38,088
- − Mortgage interest
- −$8,402
- − Property taxes
- −$2,250
- − Insurance
- −$750
- − Repairs & maintenance
- −$3,047
- − Management
- −$3,047
- − Depreciation
- −$4,364
- Taxable income
- $16,228
- Est. tax owed @ 24.0%
- −$3,895
- After-tax cash flow
- $13,755/yr
For passive investors: Depreciation is non-cash, so a rental often shows a tax loss while cash-flowing — sheltering income. Rental losses are passive: they offset passive income freely, and up to $25,000/yr can offset ordinary (W-2) income if you actively participate and your MAGI is under $100k (phasing out to $0 by $150k); unused losses carry forward. On sale, claimed depreciation is recaptured at up to 25%, and gains may owe capital-gains tax (a 1031 exchange can defer both). Figures are a year-1 estimate at your 24.0% rate — not tax advice; consult a CPA.
Schools (NCES district)
- District
- Greenfield-Central Community Schools
- NCES district ID
- 1804050
- Math proficiency
- 47% ▼ -12.00%
- Reading proficiency
- 45% ▼ -11.00%
- Median HH income
- $55,533
- Composite
- 40.01/100
- National rank
- #3827
- State rank
- #83 of 301 in IN
Livability — Greenfield
- Score
- 73/100
- State rank
- #88
- US rank
- #5094
Category grades
Schools grade is shown separately in the Schools card above.
Census & demographics
- Census place
- Greenfield, IN
- County
- Hancock County · 59,521 people
- City population
- 43,511
- Metro
- Indianapolis-Carmel-Anderson, IN
- Population (ZIP)
- 43,511
- Household income
- $83,056
- Rent vs Own
- Severe rent burden
- 795.0
Population outlook (Hancock County) Hauer SSP2
- Today (2025)
- 77,820 people
- By 2030
- 79,914 · +2.7%
- By 2040
- 82,734 · +6.3%
- By 2050
- 83,348 · +7.1%
- By 2075
- 82,439 · +5.9%
- By 2100
- 74,181 · -4.7%
Race, ethnicity, and origin ACS 2023
- Neighborhood character
- Predominantly White (92%)
- Race & ethnicity
- White 92% Two or more races 5% Hispanic / Latino 3% Black 1%
- Common ancestry
- Italian 3% Lithuanian 3% Slovak 1%
- Foreign-born
- 3% · Canada
- Languages at home
- 96% English-only · Spanish 2% Other Indo-European 1%
Political lean MEDSL · Hancock
- 2024 margin
- Solid R (+33.7) · D 32.2% · R 65.9% · Other 1.9%
- 2008→2024 swing
- -4.1pp toward R · 2008: -29.6pp · 2024: -33.7pp
- All cycles
- 2024: R+33.7 2020: R+37.5 2016: R+44.8 2012: R+41.0 2008: R+29.6
Not yet ingested
- Civics
- —
Market trends
- HPI YoY
- ▼ -131.67%
- Current HPI
- 225.0367
- Rent YoY
- ▲ 2.88%
- Metro
- Indianapolis-Carmel-Anderson, IN
- State GDP YoY
- ▲ 2.90%
- F500 in state
- 18
Industry mix (Fortune 500 HQ in IN)
| Industry | F500 HQs | Revenue |
|---|---|---|
| Industrial Machinery | 2 | $37B |
|
||
| Healthcare | 1 | $177B |
|
||
| Pharmaceuticals | 1 | $45B |
|
||
| Metals / Steel | 1 | $18B |
|
||
| Agriculture | 1 | $17B |
|
||
| Packaging | 1 | $12B |
|
||
Price history
-6.2% since first listed4 events — show timeline
- 2026-05-01 Price Changed $150,000 MIBOR as Distributed by MLS Grid
- 2026-01-13 Relisted — MIBOR as Distributed by MLS Grid
- 2026-01-10 Pending — MIBOR as Distributed by MLS Grid
- 2025-10-13 Listed $160,000 MIBOR as Distributed by MLS Grid
Cash-flow waterfall
monthlySold comps — $/sqft
last 12 mo · ≤1 miLoading sold comps…