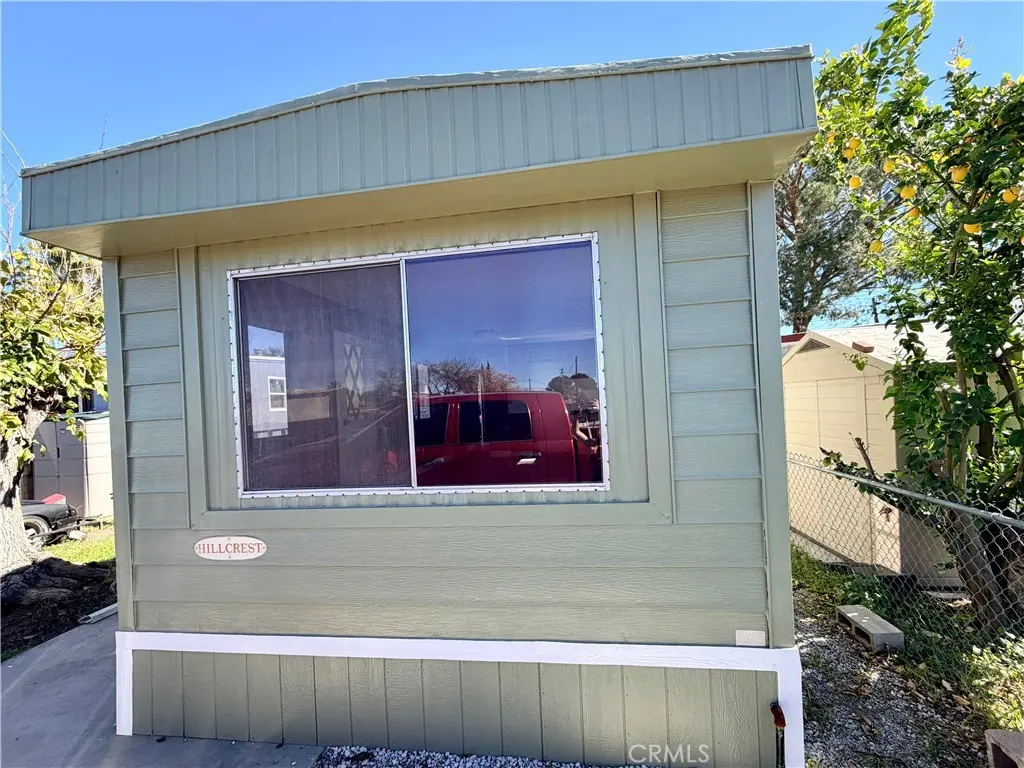
26063 Baseline St Spc 39 · Highland, CA
Flood risk 1/10 · Minimal
- FEMA flood zone
- X (unshaded)
- Chance of flooding over 30 yrs
- 0.0%
- Est. flood insurance / yr
- $507 – $1,088
Fire risk 2/10 · Minimal
- Est. fire insurance / yr
- $659 – $1,223
Heat risk 8/10 · Major
- Hot days now (above 101°F)
- 6 days/yr
- Hot days in 30 yrs
- 19 days/yr
Wind risk 1/10 · Minimal
- Chance of severe wind over 30 yrs
- —
Air-quality risk 10/10 · Severe
- Unhealthy air days now
- 29 days/yr
- Unhealthy air days in 30 yrs
- 35 days/yr
Risk factors via First Street. Map © Google.
Why this score? — see what drove the C+ grade
The composite is a weighted blend of 9 inputs, each scored 0–100. Each bar is that input's sub-score; the figure is the points it added to the 100-point composite (weight × sub-score).
- Cash flow +30.0/30.0
- 1% rule +10.0/10.0
- DSCR +10.0/10.0
- Rent growth +3.9/5.0
- Schools +3.1/10.0
- Livability +3.0/5.0
- Condition / age +2.2/5.0
- ARV discount +0.0/15.0
- Appreciation +0.0/10.0
$79,000
🖨 Deal sheet 📄 Offer letter ✓ Due diligence
Listing remarks MLS
Great Opportunity! Own this spacious home in family friendly park. This home has everything you need to be comfortable, 1 bedroom, 1 bath with indoor laundry hookups, large living room and kitchen. Yard is roomy enough to start a garden or for relaxing with friends and family. Come see what this manufactured home has to offer at a Great Price! * * Financing available * *
Key facts
- Large living room
- Roomy yard
- Community pool
Tags
Neighborhood map
What this means for you Summary
Snapshot
- This is a 1-bed/1.0-bath manufactured listed at $79k. Condition is rated fair.
Deal economics
- At list price, monthly cash flow is $679 ($8k/yr) — positive.
- The deal already cash-flows at list — no discount required.
- Meets the 1% rule at list price ($2k rent vs $79k).
- Recommended offer: $72k (9.0% below list) — sets the bar for market timing.
- Cap rate 16.6% vs local median 2.9% in Highland — top-decile yield for the area; either an underpriced asset or a hidden risk that comps aren't pricing in. Stress-test before assuming the spread holds.
Location & tenants
- Location reads 59/100 on livability (#618 in CA) — a working-class tenant base; expect higher turnover. Strengths: housing A-; Watch: schools C-, commute D+, crime D-.
- San Bernardino City Unified (urban): math 27% / reading 40% proficiency, ranked #959 of 1,400 in CA (top 68%) — families likely to look elsewhere, expect single-tenant / working-renter base with shorter leases; 81% free/reduced lunch — lower-income household profile, screen leases tightly.
- Market conditions: Rents rising fast (+5.5%/yr); 90 active listings in the ZIP; 8 comparable units currently listed for rent nearby; rentals lingering (median 44d on market — plan ~5-8 weeks vacancy on turnover, expect pricing pressure); 50% of comp listings sitting > 30 days — soft ceiling on asking rent; 5,458 units permitted in San Bernardino County in 2024 (1,500 in 5+ unit buildings).
- This rent runs 34% of the median local income ($54k/yr) — at the standard rent-burdened threshold; future hikes will face affordability resistance.
Forward outlook
- Local home prices are declining (-3.0%/yr); year-one equity from $546 of loan paydown is wiped out by about $2k of value loss. Plan a longer hold.
- San Bernardino County population projected at +15% by 2050 — modest demand growth; plan on rents tracking national, not racing it.
- At projected returns (-3.0% appreciation + 5.5% rent growth), your $22k cash investment doubles in ~4 years — after that, you're playing with house money.
Negotiation context
- It's been on market 103 days — a 9% lower offer ($72k) is reasonable based on typical stale-listing flexibility.
Risks & watch-outs
- Climate carrying-cost: extreme-heat days projected 6→19/yr by 2055 (HVAC capex compounding) — expect insurance premiums to compound above CPI over the hold.
Questions for the listing agent
- It's been on market 103 days. Have you received any prior offers? Is the seller open to a 9% concession, seller financing, or rate buy-down credit?
- Have any recent inspections been done? Can we get a copy of the seller's disclosures and any deferred-maintenance estimates?
- Why hasn't it sold? Are there any deal-killer items the seller is aware of (foundation, flood, title, zoning, code violations)?
- Is there a deadline driving the sale (1031 exchange, divorce, estate, relocation)? That informs how much negotiation room exists.
- Crime grade is D in this area — have there been break-ins, vandalism, or insurance claims at this property in the last 3 years? What carrier currently insures it and at what premium?
- What's the average days-on-market for RENTAL listings here right now (not sales)? A rising rental-DOM trend means longer vacancies and softer asking-rent achievability than the comps imply.
- What's the recent tenant-quality profile in this submarket — average credit score on applications, eviction rate, late-payment / NSF rate, and stable-employment percentage? A property-management company in the area should have these aggregated.
- How much new for-sale + rental construction is in the pipeline within 1–3 miles? Heavy new supply typically softens prices + rents 12–24 months out; constrained supply supports both.
Investment metrics
- 1% rule
- 1.96% ✓
- Cap rate
- 16.61%
- Cash-on-cash
- 36.85%
- DSCR
- 2.64
- GRM
- 4.2
CMA / ARV
- ARV (median comp)
- $65,000
- List price
- $79,000
- Delta
- 21.54%
- Verdict
- OVERPRICED
- Comps
- 1 within 2.0 mi
Show comp detail 4 sales within ~0.75 mi
| Address | Dist | Beds/Ba | Sqft | Sold | Price | $/sf | Match |
|---|---|---|---|---|---|---|---|
| 26135 Baseline St #25 | 0.09mi | 2/1.0 (+1) | 610 (+2%) | 18mo | $70,000 | $115 | 73 |
| 26063 E Baseline St #6 | 0.09mi | 2/1.0 (+1) | 672 (+12%) | 15mo | $99,500 | $148 | 58 |
| 26250 9th. Steet #126 | 0.41mi | 1/1.0 | 672 (+12%) | 20mo | $95,000 | $141 | 44 |
| 26250 E 9th #103 | 0.41mi | 2/1.0 (+1) | 510 (-15%) | 12mo | $55,000 | $108 | 40 |
Match score weights: distance 35% · size 25% · config 20% · recency 20%. Top-matched comps best support the ARV.
Projected returns pro-forma
-3.0% appreciation · 5.5% rent growth · sell at horizon
- IRR
- 35.5%
- Equity multiple
- 2.56×
- Total profit
- $34,488
- Equity at exit
- $11,779
- IRR
- 43.6%
- Equity multiple
- 5.66×
- Total profit
- $103,111
- Equity at exit
- $6,830
Cash invested: $22,120 (down + closing). Projections, not guarantees.
Landlord ↔ Tenant lean methodology
- Overall (STATE)
- 18 Strongly Tenant-Friendly
- State California
- 18 Strongly Tenant-Friendly · D+13
- County
- — inherits STATE
- City
- — inherits STATE
ZIP-level market 92410
- Home prices YoY
- -9.7%
- Rents YoY
- 5.5%
- Active inventory
- 90
- Price-to-rent
- 4.2×
Monthly cashflow live
- Estimated rent
- $1,551 high interval (Pro) →
- Mortgage (P&I)
- −$414
- Tax est. 1.5%
- −$99 /mo · $1,185/yr
- Insurance
- −$33
- HOA
- −$0
- Vacancy / Maint / Mgmt
- −$326
- Net cashflow
- $679
Break-even live
UW: 25.0% down · 7.5% · 30yr · 1.5% tax · 5.0% vac · 8.0% maint · 8.0% mgmt
Financing live
Cash to close
- Down payment
- $19,750
- Closing costs
- $2,370
- Reserves months
- —
- Total cash needed
- —
Loan-product check · same deal, 3 products live
Conventional
25% down · 7.5% · 30yr
- Down + closing
- —
- Monthly P&I
- —
- Monthly cashflow
- —
- DSCR
- —
- Eligible?
- —
Personal DTI + credit; lowest rate.
DSCR
20% down · 8.5% · 30yr
- Down + closing
- —
- Monthly P&I
- —
- Monthly cashflow
- —
- DSCR
- —
- Eligible?
- —
No personal income docs; deal must DSCR.
Hard money
10% down · 12.0% · 12mo
- Down + closing
- —
- Monthly P&I
- —
- Monthly cashflow
- —
- DSCR
- —
- Eligible?
- —
Short-term bridge; refi at stabilization.
Rent comps 8 comps
| Address | Beds | Baths | Sqft | Rent | $/sqft | DOM | Units | Dist |
|---|---|---|---|---|---|---|---|---|
| 26030 E Baseline St San Bernardino, CA | 1.0–2.0 | 1.0 | 788 | $1,450 | $1.84 | 43d | 1 | 0.12mi |
| 7239 Sterling Ave San Bernardino, CA | 2.0 | 1.0 | 600 | $1,750 | $2.92 | 18d | 1 | 0.43mi |
| 26660 9th St Highland, CA | 1.0–2.0 | 1.0–2.0 | 755 | $1,825 | $2.42 | 1d | 4 | 0.74mi |
| 26674 Ward St Highland, CA | 1.0 | 1.0 | 720 | $1,432 | $1.99 | 12d | 1 | 1.10mi |
| 2225 Pumalo St San Bernardino, CA | 1.0–2.0 | 1.0–2.0 | 750 | $1,640 | $2.19 | 43d | 1 | 1.12mi |
| 1422 E 9th St San Bernardino, CA | 1.0–2.0 | 1.0 | 675 | $1,599 | $2.37 | 2d | 4 | 1.16mi |
| 1775 E 20th St San Bernardino, CA | 1.0 | 1.0 | 650 | $1,595 | $2.45 | 43d | 1 | 1.17mi |
| 27205 Main St Highland, CA | 1.0 | 1.0 | 700 | $1,575 | $2.25 | 43d | 1 | 1.49mi |
Listing history 7 events
-
2026-06-04days on market $79,000 Active 103 DOM
-
2026-06-03days on market $79,000 Active 102 DOM
-
2026-06-02days on market $79,000 Active 101 DOM
-
2026-06-01days on market $79,000 Active 100 DOM
-
2026-05-31days on market $79,000 Active 99 DOM
-
2026-05-15price $79,000 376-char remark
Show marketing remark (376 chars)
Great Opportunity! Own this spacious home in family friendly park. This home has everything you need to be comfortable, 1 bedroom, 1 bath with indoor laundry hookups, large living room and kitchen. Yard is roomy enough to start a garden or for relaxing with friends and family. Come see what this manufactured home has to offer at a Great Price! * * Financing available * *
-
2026-02-21$86,000 Active 376-char remark
Show marketing remark (376 chars)
Great Opportunity! Own this spacious home in family friendly park. This home has everything you need to be comfortable, 1 bedroom, 1 bath with indoor laundry hookups, large living room and kitchen. Yard is roomy enough to start a garden or for relaxing with friends and family. Come see what this manufactured home has to offer at a Great Price! * * Financing available * *
ⓘ Source: listings_history table (triggers on properties + properties_extension) + one-shot
backfill from property_details.listing_events for pre-trigger history.
Climate risk First Street
- Flood 1/10 Low FEMA zone X (unshaded) · 0% chance over 30 yrs
- Wildfire 2/10 Low
- Heat 8/10 Severe 6 d/yr ≥101°F today · 19 d/yr by 30 yrs out
- Wind 1/10 Low
- Air quality 10/10 Extreme 29 unhealthy d/yr today · 35 by 30 yrs out
Nearby sold comps map
Loading sold comps map…
Walkable amenities ~0.75 mi
Loading nearby amenities…
Taxation est. · year 1
- Rental income
- $18,612
- − Mortgage interest
- −$4,425
- − Property taxes
- −$1,185
- − Insurance
- −$395
- − Repairs & maintenance
- −$1,489
- − Management
- −$1,489
- − Depreciation
- −$2,298
- Taxable income
- $7,331
- Est. tax owed @ 24.0%
- −$1,759
- After-tax cash flow
- $6,393/yr
For passive investors: Depreciation is non-cash, so a rental often shows a tax loss while cash-flowing — sheltering income. Rental losses are passive: they offset passive income freely, and up to $25,000/yr can offset ordinary (W-2) income if you actively participate and your MAGI is under $100k (phasing out to $0 by $150k); unused losses carry forward. On sale, claimed depreciation is recaptured at up to 25%, and gains may owe capital-gains tax (a 1031 exchange can defer both). Figures are a year-1 estimate at your 24.0% rate — not tax advice; consult a CPA.
Condition & rehab AI · 12 photos
This manufactured home is in fair condition with cosmetic updates needed to enhance its curb appeal and value.
Repairs flagged
- Minor exterior siding — Light discoloration
- Minor bathroom walls — Wallpapered walls
Value-add opportunities
- Both Paint exterior siding — Enhances curb appeal and value
- Both Replace bathroom fixtures — Improves functionality and aesthetics
Renovation cost estimate screening
| Repair item | Severity | Est. cost |
|---|---|---|
| exterior siding · Light discoloration | Minor | $500–3,000 |
| bathroom walls · Wallpapered walls | Minor | $500–3,000 |
| Total estimated repair cost · 2 items | $1,000–6,000 |
Value-add ROI direction
- Both Paint exterior siding — Enhances curb appeal and value ↑
- Both Replace bathroom fixtures — Improves functionality and aesthetics ↑
ⓘ Cost ranges are severity-bucket heuristics (US national rule-of-thumb). Get contractor quotes + a written scope before underwriting a rehab budget.
Schools (NCES district)
- District
- San Bernardino City Unified
- NCES district ID
- 0634170
- Math proficiency
- 27% ▲ 1.00%
- Reading proficiency
- 40% ▬ 0.00%
- Median HH income
- $39,758
- Composite
- 30.8/100
- National rank
- #11385
- State rank
- #959 of 1400 in CA
Livability — Highland
- Score
- 59/100
- State rank
- #618
- US rank
- #19608
Category grades
Schools grade is shown separately in the Schools card above.
Census & demographics
- Census place
- Highland, CA
- County
- San Bernardino County · 2,030,291 people
- City population
- 56,179
- Metro
- Riverside-San Bernardino-Ontario, CA
- Population (ZIP)
- 47,869
- Household income
- $54,181
- Rent vs Own
- Severe rent burden
- 2569.0
Population outlook (San Bernardino County) Hauer SSP2
- Today (2025)
- 2,300,329 people
- By 2030
- 2,378,907 · +3.4%
- By 2040
- 2,523,137 · +9.7%
- By 2050
- 2,642,388 · +14.9%
- By 2075
- 2,880,769 · +25.2%
- By 2100
- 2,909,436 · +26.5%
Race, ethnicity, and origin ACS 2023
- Neighborhood character
- Predominantly Hispanic (80%)
- Race & ethnicity
- Hispanic / Latino 80% Two or more races 12% Black 8% White 7% Asian 3%
- Hispanic origin (detail)
- Mexican 70%
- Common ancestry
- Romanian 0%
- Foreign-born
- 29% · Canada, Vietnam, Jamaica
- Languages at home
- 32% English-only · Spanish 65% Vietnamese 1%
Political lean MEDSL · San Bernardino
- 2024 margin
- Toss-up / Even · D 47.5% · R 49.7% · Other 2.8%
- 2008→2024 swing
- -8.5pp toward R · 2008: 6.3pp · 2024: -2.1pp
- All cycles
- 2024: R+2.1 2020: D+10.7 2016: D+9.8 2012: D+5.4 2008: D+6.3
Not yet ingested
- Civics
- —
Market trends
- HPI YoY
- ▼ -54.39%
- Current HPI
- 504.0299
- Rent YoY
- ▲ 5.50%
- Metro
- Riverside-San Bernardino-Ontario, CA
- State GDP YoY
- ▲ 3.21%
- F500 in state
- 116
Industry mix (Fortune 500 HQ in CA)
| Industry | F500 HQs | Revenue |
|---|---|---|
| Technology | 27 | $1,492B |
|
||
| Financial Services | 3 | $174B |
|
||
| Retail | 3 | $44B |
|
||
| Insurance | 3 | $26B |
|
||
| Media / Entertainment | 2 | $115B |
|
||
| Pharmaceuticals / Biotech | 2 | $62B |
|
||
Price history
-8.1% since first listed2 events — show timeline
- 2026-05-15 Price Changed $79,000 CRMLS
- 2026-02-21 Listed $86,000 CRMLS
Cash-flow waterfall
monthlySold comps — $/sqft
last 12 mo · ≤1 miLoading sold comps…