5033 Ibis Ave · McAllen, TX
Flood risk 1/10 · Minimal
- FEMA flood zone
- X
- Chance of flooding over 30 yrs
- 0.0%
- Est. flood insurance / yr
- $507 – $1,088
Fire risk 5/10 · Moderate
- Est. fire insurance / yr
- $1,222 – $2,270
Heat risk 9/10 · Severe
- Hot days now (above 111°F)
- 7 days/yr
- Hot days in 30 yrs
- 22 days/yr
Wind risk 8/10 · Major
- Chance of severe wind over 30 yrs
- 99.0%
Air-quality risk 2/10 · Minimal
- Unhealthy air days now
- 0 days/yr
- Unhealthy air days in 30 yrs
- 1 days/yr
Risk factors via First Street. Map © Google.
Why this score? — see what drove the F grade
The composite is a weighted blend of 9 inputs, each scored 0–100. Each bar is that input's sub-score; the figure is the points it added to the 100-point composite (weight × sub-score).
- ARV discount +14.2/15.0
- Cash flow +5.2/30.0
- Livability +3.8/5.0
- Schools +3.4/10.0
- Rent growth +3.1/5.0
- Condition / age +2.5/5.0
- 1% rule +1.3/10.0
- DSCR +0.0/10.0
- Appreciation +0.0/10.0
$205,000
🖨 Deal sheet 📄 Offer letter ✓ Due diligence
Listing remarks
Available Now! Move into this 4 Bedrooms/2 Bathrooms/1 Car Garage home on a corner lot in Taylor Crossing—no HOA! Bright, open living area with vaulted ceilings flows into dining and kitchen. New wood-look tile throughout. Spacious primary suite features vaulted ceiling, walk-in closet, and updated en-suite with floor-to-ceiling tiled shower. Large secondary bedrooms fit queen-size beds. Kitchen features cast iron sink, stainless steel gas range, and refrigerator. Washer & dryer in garage convey. Recent water heater installed, well-maintained A/C, and energy-efficient double-pane windows. Private fenced in backyard. Located in Sharyland ISD in North McAllen near Taylor Rd/Mile 4
Key facts
- Walk-in closet
- New wood-look tile
- Vaulted ceilings
Tags
Property features AI
Finance
- Other: Lot size approximately 0.15 acre (6,568 sq ft)
- HOA & community: No homeowners association; Community sidewalks
Exterior
- Parking: Attached garage (1 car); Covered parking for 1 vehicle
- Utilities: City sewer; Paved road access; Electric service
- Home design: Single-family property; Entry on main level
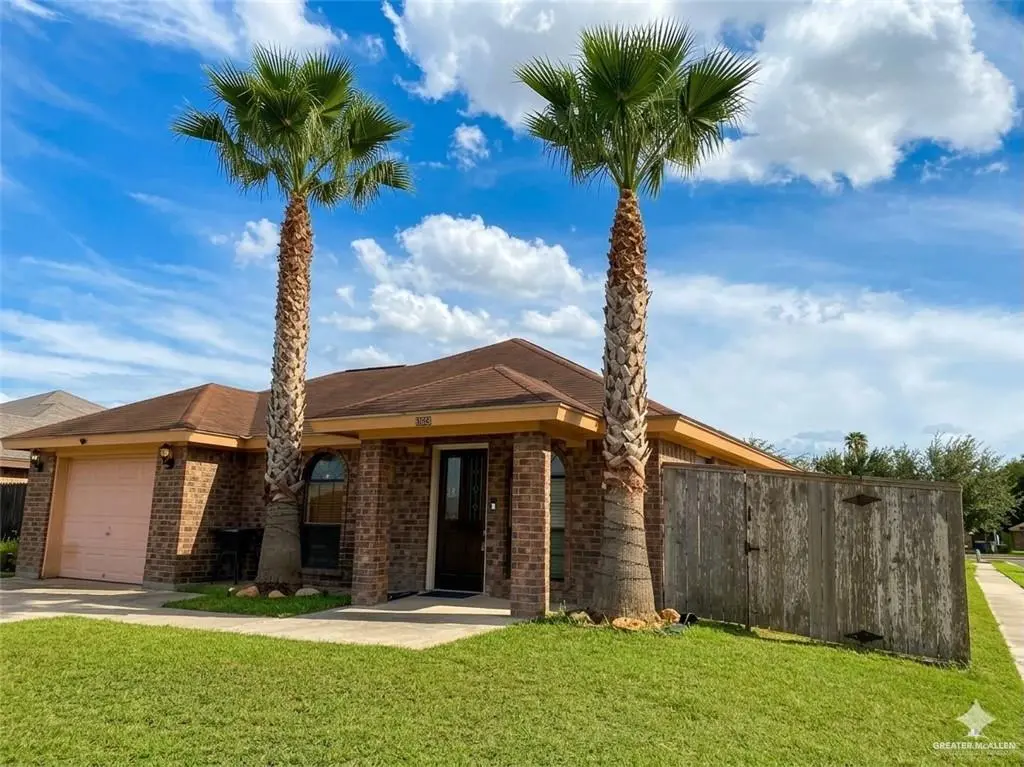
- Construction: Brick construction; Shingle roof; Slab foundation; Built area 1,362 square feet
- Exterior features: Mature trees; Corner lot; Sidewalks; Other exterior features
Interior
- Kitchen: Gas range / stove; Refrigerator; Dishwasher not listed
- Bedrooms: Master bedroom with walk-in closet
- Flooring: Tile
- Bathrooms: 2 full bathrooms
- Heating & cooling: Central heating (electric); Central air conditioning (electric)
- Interior features: Laminate countertops; Ceiling fans; Decorative / high ceilings; Walk-in closet(s); Double pane windows; Mini blinds; Wood or faux blinds
- Laundry & utility: Washer and dryer included; Washer/dryer connections in garage; Gas water heater; Water heater located in garage
Neighborhood map
What this means for you Summary
Snapshot
- This is a 2-bed/2.0-bath single-family listed at $205k.
Deal economics
- At list price, monthly cash flow is $-467 ($-6k/yr) — negative.
- To cash-flow at today's rent, offer at most $123k (40.2% below list).
- To meet the 1% rule (rent ≥ 1% of price), the offer needs to be $129k (36.9% below list).
- Recommended offer: $123k (40.2% below list) — sets the bar for cash-flow.
Location & tenants
- Location reads 76/100 on livability (#119 in TX, #3,771 nationally) — a middle-class / working-renter tenant base. Strengths: cost of living A+, housing A+, health & safety A+; Watch: employment D, amenities F, commute F.
- Sharyland ISD (urban): math 34% / reading 44% proficiency, ranked #406 of 826 in TX (top 49%) — families likely to look elsewhere, expect single-tenant / working-renter base with shorter leases.
- Zoned schools: Donna Wernecke El (math 23% / reading 35%, grade F, #2,668 of 4,322 statewide, top 63%, 697 students, 71% FRL); Sharyland North J H (math 46% / reading 42%, grade D, #512 of 1,662 statewide, top 32%, 806 students, 74% FRL); Sharyland Pioneer H S (math 31% / reading 51%, grade F, #774 of 1,632 statewide, top 49%, 1,471 students, 68% FRL) — zoned schools average 71% FRL vs 55% district-wide (16 pts higher); higher-poverty schools than district average — tighter screening recommended.
- Market conditions: Rents rising (+2.6%/yr); 888 active listings in the ZIP; 40 comparable units currently listed for rent nearby; rentals lingering (median 44d on market — plan ~5-8 weeks vacancy on turnover, expect pricing pressure); 55% of comp listings sitting > 30 days — soft ceiling on asking rent; solid renter incomes; 7,378 units permitted in Hidalgo County in 2024 (641 in 5+ unit buildings).
Forward outlook
- Local home prices are declining (-3.0%/yr); year-one equity from $1k of loan paydown is wiped out by about $6k of value loss. Plan a longer hold.
- Hidalgo County population projected at +28% by 2050 — long-run rental-demand tailwind backs the buy-and-hold thesis.
Negotiation context
- It's been on market 49 days — a 3% lower offer ($199k) is reasonable based on typical stale-listing flexibility.
- 4 sale attempts since 4y ago; this cycle's ask is 13126% above the opening price — seller raised mid-cycle; expect resistance to lowballs.
Risks & watch-outs
- Climate carrying-cost: severe wind risk, 99% chance of damaging wind over 30y; moderate wildfire risk; extreme-heat days projected 7→22/yr by 2055 (HVAC capex compounding) — expect insurance premiums to compound above CPI over the hold.
Questions for the listing agent
- What do current leases actually rent for vs. the listed asking? Can we see a recent rent roll and the last 12 months of T-12 income?
- It's been on market 49 days. Have you received any prior offers? Is the seller open to a 40% concession, seller financing, or rate buy-down credit?
- Is there a deadline driving the sale (1031 exchange, divorce, estate, relocation)? That informs how much negotiation room exists.
- Schools are B-rated — typically a magnet for longer-tenancy family renters. What's the average tenant stay here, and is there a school-zone premium baked into asking?
- The area grade is low — what's the realistic commute time and amenity access for the typical tenant pool here? Any planned neighborhood developments (good or bad) we should know about?
- What's the average days-on-market for RENTAL listings here right now (not sales)? A rising rental-DOM trend means longer vacancies and softer asking-rent achievability than the comps imply.
- What's the recent tenant-quality profile in this submarket — average credit score on applications, eviction rate, late-payment / NSF rate, and stable-employment percentage? A property-management company in the area should have these aggregated.
- How much new for-sale + rental construction is in the pipeline within 1–3 miles? Heavy new supply typically softens prices + rents 12–24 months out; constrained supply supports both.
Investment metrics
- 1% rule
- 0.63% ✗
- Cap rate
- 3.56%
- Cash-on-cash
- -9.76%
- DSCR
- 0.57
- GRM
- 13.2
CMA / ARV
- ARV (median comp)
- $240,622
- List price
- $205,000
- Delta
- -14.80%
- Verdict
- UNDERPRICED
- Comps
- 20 within 1.0 mi
Show comp detail 10 sales within ~0.75 mi
| Address | Dist | Beds/Ba | Sqft | Sold | Price | $/sf | Match |
|---|---|---|---|---|---|---|---|
| 4805 Jay Ave | 0.17mi | 3/2.0 (+1) | 1,163 (-15%) | 3mo | $180,000 | $155 | 60 |
| 4405 Quail Ave | 0.63mi | 3/2.0 (+1) | 1,425 (+5%) | 8mo | $200,000 | $140 | 51 |
| 4900 Jay Ave | 0.16mi | 3/2.0 (+1) | 1,205 (-12%) | 22mo | $199,990 | $166 | 50 |
| 4900 Heron Ave | 0.14mi | 3/2.0 (+1) | 1,158 (-15%) | 18mo | $199,500 | $172 | 49 |
| 4911 N 45th Ln | 0.72mi | 3/2.5 (+1) | 1,420 (+4%) | 12mo | $235,000 | $165 | 42 |
| 4601 Thunderbird Ave | 0.72mi | 3/2.0 (+1) | 1,222 (-10%) | 8mo | $215,000 | $176 | 37 |
| 4613 Sandpiper Ave | 0.67mi | 3/2.0 (+1) | 1,222 (-10%) | 13mo | $205,000 | $168 | 36 |
| 4216 Goldcrest Ave | 0.61mi | 3/2.0 (+1) | 1,185 (-13%) | 15mo | $170,000 | $143 | 33 |
| 5904 N 42nd St | 0.68mi | 3/2.0 (+1) | 1,220 (-10%) | 17mo | $165,000 | $135 | 32 |
| 4613 Wisteria Ave | 0.73mi | 3/2.5 (+1) | 1,528 (+12%) | 9mo | $255,000 | $167 | 31 |
Match score weights: distance 35% · size 25% · config 20% · recency 20%. Top-matched comps best support the ARV.
Projected returns pro-forma
-3.0% appreciation · 2.57% rent growth · sell at horizon
- IRR
- -34.2%
- Equity multiple
- -0.11×
- Total profit
- $-63,453
- Equity at exit
- $30,566
- IRR
- -46.2%
- Equity multiple
- -0.66×
- Total profit
- $-95,558
- Equity at exit
- $17,725
Cash invested: $57,400 (down + closing). Projections, not guarantees.
Landlord ↔ Tenant lean methodology
- Overall (STATE)
- 87 Strongly Landlord-Friendly
- State Texas
- 87 Strongly Landlord-Friendly · R+5
- County
- — inherits STATE
- City
- — inherits STATE
ZIP-level market 78504
- Home prices YoY
- -29.4%
- Rents YoY
- 2.6%
- Active inventory
- 888
- Price-to-rent
- 13.2×
Monthly cashflow live
- Estimated rent
- $1,294 high interval (Pro) →
- Mortgage (P&I)
- −$1,075
- Tax from tax record
- −$329 /mo · $3,946/yr
- Insurance
- −$85
- HOA
- −$0
- Vacancy / Maint / Mgmt
- −$272
- Net cashflow
- $-467
Break-even live
UW: 25.0% down · 7.5% · 30yr · 1.5% tax · 5.0% vac · 8.0% maint · 8.0% mgmt
Financing live
Cash to close
- Down payment
- $51,250
- Closing costs
- $6,150
- Reserves months
- —
- Total cash needed
- —
Loan-product check · same deal, 3 products live
Conventional
25% down · 7.5% · 30yr
- Down + closing
- —
- Monthly P&I
- —
- Monthly cashflow
- —
- DSCR
- —
- Eligible?
- —
Personal DTI + credit; lowest rate.
DSCR
20% down · 8.5% · 30yr
- Down + closing
- —
- Monthly P&I
- —
- Monthly cashflow
- —
- DSCR
- —
- Eligible?
- —
No personal income docs; deal must DSCR.
Hard money
10% down · 12.0% · 12mo
- Down + closing
- —
- Monthly P&I
- —
- Monthly cashflow
- —
- DSCR
- —
- Eligible?
- —
Short-term bridge; refi at stabilization.
Rent comps 40 comps
| Address | Beds | Baths | Sqft | Rent | $/sqft | DOM | Units | Dist |
|---|---|---|---|---|---|---|---|---|
| 4805 Jay Ave McAllen, TX | 3.0 | 2.0 | 1163 | $1,500 | $1.29 | 43d | 1 | 0.17mi |
| 4305 Heron Ave Unit 6 McAllen, TX | 3.0 | 2.0 | 980 | $1,300 | $1.33 | 43d | 1 | 0.17mi |
| 5609 Nightingale Ave Unit 2 Mission, TX | 2.0 | 2.0 | 900 | $1,200 | $1.33 | 43d | 1 | 0.41mi |
| 5701 Nightingale Mission, TX | 2.0 | 2.0 | 910 | $950 | $1.04 | 23d | 1 | 0.44mi |
| 5701 Nightingale Ave Unit 3 Mission, TX | 2.0 | 2.0 | 1056 | $950 | $0.90 | 43d | 1 | 0.44mi |
| 5701 Nightingale Mission, TX | 2.0 | 2.0 | 910 | $1,000 | $1.10 | 43d | 1 | 0.44mi |
| 4408 Heron Ct McAllen, TX | 3.0 | 2.5 | 1738 | $2,900 | $1.67 | 43d | 1 | 0.44mi |
| 5709 Nightingale Ave Unit 1 McAllen, TX | 3.0 | 2.0 | 1010 | $1,050 | $1.04 | 43d | 1 | 0.48mi |
| 5708 Nightingale Ave Unit 2 McAllen, TX | 2.0 | 2.0 | 1100 | $1,500 | $1.36 | 14d | 1 | 0.48mi |
| 5605 Quail Ave McAllen, TX | 2.0 | 2.0 | 980 | $990 | $1.01 | 14d | 1 | 0.50mi |
| 5800 Nightingale Ave #1 Mission, TX | 2.0 | 2.0 | 987 | $1,100 | $1.11 | 43d | 1 | 0.50mi |
| 5804 Nightingale Ave Unit 4 Mission, TX | 2.0 | 2.0 | 983 | $1,040 | $1.06 | 23d | 1 | 0.51mi |
| 5900 Nightingale Mission, TX | 3.0 | 2.0 | 1020 | $1,100 | $1.08 | 23d | 1 | 0.54mi |
| 5601 Puffin Ave Unit 1 Mission, TX | 2.0 | 2.0 | 930 | $1,075 | $1.16 | 23d | 1 | 0.54mi |
| 5701 Puffin Ave Unit 3 Palmhurst, TX | 2.0 | 2.0 | 990 | $990 | $1.00 | 23d | 1 | 0.56mi |
| 5912 Nightingale Ave Unit 1 Mission, TX | 1.0 | 1.0 | 1120 | $950 | $0.85 | 43d | 1 | 0.57mi |
| 6902 N 56th Ln Unit 1 Mission, TX | 2.0 | 2.0 | 990 | $990 | $1.00 | 23d | 1 | 0.58mi |
| 5601 Quail Ave Unit 4 Palmhurst, TX | 3.0 | 2.0 | 1126 | $1,150 | $1.02 | 23d | 1 | 0.59mi |
| 5700 Puffin Ave Unit 2 Palmhurst, TX | 2.0 | 2.0 | 1026 | $1,050 | $1.02 | 43d | 1 | 0.59mi |
| 5805 Puffin Ave Mission, TX | 2.0 | 2.0 | 999 | $1,000 | $1.00 | 43d | 1 | 0.60mi |
| 5805 Puffin Ave Unit 1 Palmhurst, TX | 2.0 | 2.0 | 1093 | $1,000 | $0.91 | 14d | 1 | 0.60mi |
| 5609 Quail Ave Unit 4 Palmhurst, TX | 3.0 | 2.0 | 1126 | $1,190 | $1.06 | 43d | 1 | 0.61mi |
| 5609 Quail Ave Unit 3 Palmhurst, TX | 2.0 | 2.0 | 970 | $950 | $0.98 | 19d | 1 | 0.61mi |
| 5708 Puffin Ave Unit 1 Palmhurst, TX | 2.0 | 2.0 | 1026 | $1,050 | $1.02 | 43d | 1 | 0.61mi |
| 5600 Quail Ave Unit 1 Mission, TX | 3.0 | 2.0 | 1126 | $1,300 | $1.15 | 43d | 1 | 0.61mi |
| 5905 Puffin Ave Unit 1 Mission, TX | 2.0 | 2.0 | 900 | $1,200 | $1.33 | 43d | 1 | 0.62mi |
| 5601 Swallow Ave Unit 1 Palmhurst, TX | 2.0 | 2.0 | 980 | $1,100 | $1.12 | 43d | 1 | 0.63mi |
| 5601 Swallow Ave Unit 2 Palmhurst, TX | 3.0 | 2.0 | 1126 | $1,190 | $1.06 | 43d | 1 | 0.63mi |
| 4616 Xanthisma Ave McAllen, TX | 3.0 | 2.0 | 1332 | $1,950 | $1.46 | 14d | 1 | 0.64mi |
| 5900 Puffin Ave Unit 1 Palmhurst, TX | 2.0 | 2.0 | 1000 | $1,000 | $1.00 | 14d | 1 | 0.64mi |
| 5900 Puffin Ave Unit 2 Palmhurst, TX | 2.0 | 2.0 | 1000 | $1,100 | $1.10 | 43d | 1 | 0.64mi |
| 5605 Swallow Ave Unit 3 Palmhurst, TX | 2.0 | 2.0 | 980 | $1,000 | $1.02 | 43d | 1 | 0.64mi |
| 4616 Swallow Ave McAllen, TX | 3.0 | 2.0 | 1381 | $1,600 | $1.16 | 14d | 1 | 0.65mi |
| 5909 Puffin Ave Unit 3 Palmhurst, TX | 2.0 | 2.0 | 932 | $900 | $0.97 | 19d | 1 | 0.65mi |
| 5609 Swallow Ave Unit 2 Palmhurst, TX | 3.0 | 2.0 | 980 | $1,190 | $1.21 | 43d | 1 | 0.65mi |
| 5805 Swallow Ave Unit 3 McAllen, TX | 3.0 | 2.0 | 1080 | $1,150 | $1.06 | 43d | 1 | 0.69mi |
| 5805 Swallow Ave Unit 1 McAllen, TX | 3.0 | 2.0 | 1080 | $1,150 | $1.06 | 14d | 1 | 0.69mi |
| 5700 Swallow Ave Unit 4 Mission, TX | 3.0 | 2.0 | 1093 | $1,250 | $1.14 | 14d | 1 | 0.70mi |
| 5901 Swallow Ave Unit 1 McAllen, TX | 3.0 | 2.0 | 1080 | $1,095 | $1.01 | 23d | 1 | 0.70mi |
| 5604 Sandpiper Ave Unit 2 Alton, TX | 3.0 | 2.0 | 1125 | $1,150 | $1.02 | 43d | 1 | 0.71mi |
Listing history 18 events
-
2026-06-14statusdays on market $205,000 Pending 49 DOM
-
2026-06-10days on market $205,000 Option 48 DOM
-
2026-06-09days on market $205,000 Option 47 DOM
-
2026-06-08days on market $205,000 Option 46 DOM
-
2026-06-07days on market $205,000 Option 45 DOM
-
2026-06-03days on market $205,000 Option 41 DOM
-
2026-06-03status $205,000 Option 40 DOM
-
2026-06-02days on market $205,000 Active 40 DOM
-
2026-06-01days on market $205,000 Active 39 DOM
-
2026-05-31days on market $205,000 Active 38 DOM
-
2026-05-31days on market $205,000 Active 37 DOM
-
2026-05-15$1,550
-
2026-05-13price $205,000 743-char remark
-
2026-04-23$209,000 Active 743-char remark
-
2026-03-09price $209,000
-
2026-02-19$215,000 Active
-
2022-09-02status Pending
-
2022-08-02$179,000 Active
ⓘ Source: listings_history table (triggers on properties + properties_extension) + one-shot
backfill from property_details.listing_events for pre-trigger history.
Tax reassessment forecast TX · Resets to sale price
- Current annual tax
- $3,946 · $329/mo
- Projected year-2 tax
- $3,946 · $329/mo
- Expected delta
- $0/yr ($0/mo · -0.0%)
ⓘ Screening estimate from a state-policy table — verify with the county assessor before closing.
Climate risk First Street
- Flood 1/10 Low FEMA zone X · 0% chance over 30 yrs
- Wildfire 5/10 Major
- Heat 9/10 Extreme 7 d/yr ≥111°F today · 22 d/yr by 30 yrs out
- Wind 8/10 Severe 99% chance of damaging wind over 30 yrs
- Air quality 2/10 Low 0 unhealthy d/yr today · 1 by 30 yrs out
Nearby sold comps map
Loading sold comps map…
Walkable amenities ~0.75 mi
Loading nearby amenities…
Taxation est. · year 1
- Rental income
- $15,529
- − Mortgage interest
- −$11,483
- − Property taxes
- −$3,946
- − Insurance
- −$1,025
- − Repairs & maintenance
- −$1,242
- − Management
- −$1,242
- − Depreciation
- −$5,964
- Taxable loss
- −$9,373
- Est. tax savings @ 24.0%
- +$2,250
- After-tax cash flow
- $-3,354/yr
For passive investors: Depreciation is non-cash, so a rental often shows a tax loss while cash-flowing — sheltering income. Rental losses are passive: they offset passive income freely, and up to $25,000/yr can offset ordinary (W-2) income if you actively participate and your MAGI is under $100k (phasing out to $0 by $150k); unused losses carry forward. On sale, claimed depreciation is recaptured at up to 25%, and gains may owe capital-gains tax (a 1031 exchange can defer both). Figures are a year-1 estimate at your 24.0% rate — not tax advice; consult a CPA.
Schools (NCES district)
- District
- Sharyland ISD
- NCES district ID
- 4839930
- Math proficiency
- 34% ▼ -35.00%
- Reading proficiency
- 44% ▼ -15.00%
- Median HH income
- $57,792
- Composite
- 34.38/100
- National rank
- #5214
- State rank
- #406 of 826 in TX
Livability — McAllen
- Score
- 76/100
- State rank
- #119
- US rank
- #3771
Category grades
Schools grade is shown separately in the Schools card above.
Census & demographics
- Census place
- McAllen, TX
- County
- Hidalgo County · 623,128 people
- City population
- 144,650
- Metro
- McAllen-Edinburg-Mission, TX
- Population (ZIP)
- 63,094
- Household income
- $81,905
- Rent vs Own
- Severe rent burden
- 1468.0
Population outlook (Hidalgo County) Hauer SSP2
- Today (2025)
- 955,232 people
- By 2030
- 1,009,774 · +5.7%
- By 2040
- 1,120,332 · +17.3%
- By 2050
- 1,225,036 · +28.2%
- By 2075
- 1,439,189 · +50.7%
- By 2100
- 1,533,429 · +60.5%
Race, ethnicity, and origin ACS 2023
- Neighborhood character
- Predominantly Hispanic (82%)
- Race & ethnicity
- Hispanic / Latino 82% Two or more races 39% White 11% Asian 5%
- Hispanic origin (detail)
- Mexican 75%
- Common ancestry
- Lithuanian 1% Italian 1%
- Foreign-born
- 24% · Canada, South Korea, Vietnam
- Languages at home
- 34% English-only · Spanish 62% Other Asian/Pacific 1% Tagalog/Filipino 1%
Political lean MEDSL · Hidalgo
- 2024 margin
- Toss-up / Even · D 48.1% · R 51.0%
- 2008→2024 swing
- -41.6pp toward R · 2008: 38.7pp · 2024: -2.9pp
- All cycles
- 2024: R+2.9 2020: D+17.1 2016: D+40.5 2012: D+41.8 2008: D+38.7
Not yet ingested
- Civics
- —
Market trends
- HPI YoY
- ▼ -80.87%
- Current HPI
- 194.1764
- Rent YoY
- ▲ 2.57%
- Metro
- McAllen-Edinburg-Mission, TX
- State GDP YoY
- ▲ 3.95%
- F500 in state
- 110
Industry mix (Fortune 500 HQ in TX)
| Industry | F500 HQs | Revenue |
|---|---|---|
| Energy | 16 | $1,198B |
|
||
| Technology | 5 | $198B |
|
||
| Engineering / Construction | 4 | $72B |
|
||
| Energy Services | 3 | $60B |
|
||
| Utilities | 3 | $41B |
|
||
| Healthcare | 2 | $330B |
|
||
Price history
-99.1% since first listed10 events — show timeline
- 2026-06-12 Pending — MCALLENMLS
- 2026-06-02 Rental Removed $1,550 MCALLENMLS
- 2026-06-02 Contingent — MCALLENMLS
- 2026-05-15 Listed for Rent $1,550 MCALLENMLS
- 2026-05-13 Price Changed $205,000 MCALLENMLS
- 2026-04-23 Listed $209,000 MCALLENMLS
- 2026-03-09 Price Changed $209,000 MCALLENMLS
- 2026-02-19 Listed $215,000 MCALLENMLS
- 2022-09-02 Pending — MCALLENMLS
- 2022-08-02 Listed $179,000 MCALLENMLS
Property tax history
+3.8%/yrLatest (2025): $3,946 · +10.0% YoY. Source: county tax records.
Cash-flow waterfall
monthlySold comps — $/sqft
last 12 mo · ≤1 miLoading sold comps…