 Triplex
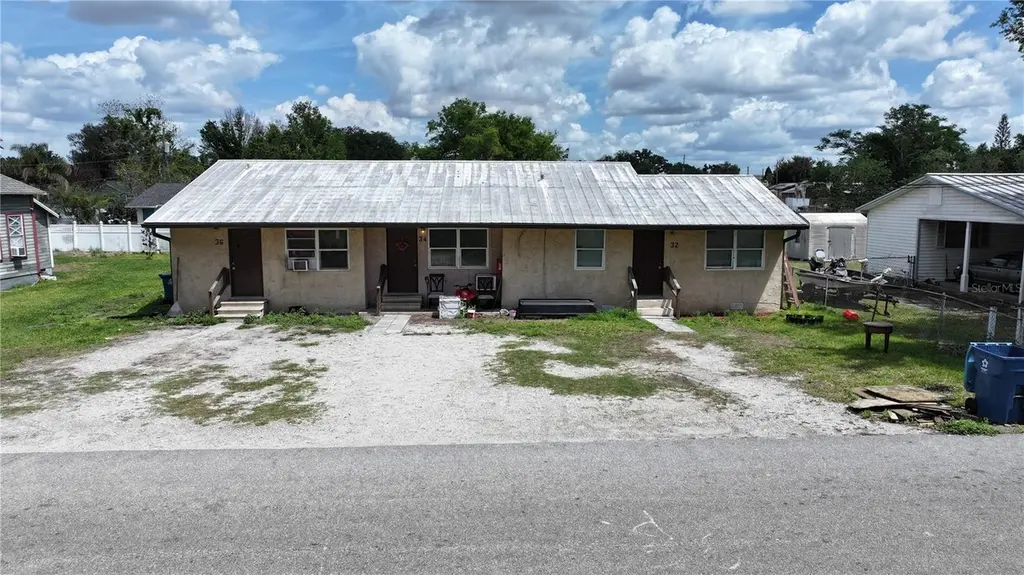
32 N Palmetto Ave · Fort Meade, FL
Flood risk 1/10 · Minimal
- FEMA flood zone
- X (unshaded)
- Chance of flooding over 30 yrs
- 0.0%
- Est. flood insurance / yr
- $507 – $1,088
Fire risk 5/10 · Moderate
- Est. fire insurance / yr
- $947 – $1,759
Heat risk 8/10 · Major
- Hot days now (above 108°F)
- 7 days/yr
- Hot days in 30 yrs
- 25 days/yr
Wind risk 9/10 · Severe
- Chance of severe wind over 30 yrs
- 99.0%
Air-quality risk 2/10 · Minimal
- Unhealthy air days now
- 2 days/yr
- Unhealthy air days in 30 yrs
- 2 days/yr
Risk factors via First Street. Map © Google.
Why this score? — see what drove the B grade
The composite is a weighted blend of 9 inputs, each scored 0–100. Each bar is that input's sub-score; the figure is the points it added to the 100-point composite (weight × sub-score).
- Cash flow +27.0/30.0
- Appreciation +10.0/10.0
- DSCR +9.3/10.0
- 1% rule +7.7/10.0
- ARV discount +7.5/15.0
- Schools +3.5/10.0
- Livability +3.1/5.0
- Rent growth +2.5/5.0
- Condition / age +2.5/5.0
$234,999
🖨 Deal sheet 📄 Offer letter ✓ Due diligence
Multi-family units
County records classify this as Multi-Family (2-4 Unit). Listing-text estimate: 3 units. confirmed
Listing remarks
Value-add triplex located in Ft. Meade offering strong upside potential for investors. The property features a unit mix of (1) 2-bedroom/1-bath unit and (2) 1-bedroom/1-bath units, providing a solid layout for consistent rental demand. Current rents are below market, presenting an opportunity to increase cash flow through interior improvements and operational efficiencies. Ideal for an investor seeking a property with clear rental upside in a growing Central Florida market.
Key facts
- 6,996 sq ft lot
- Built 1956
- Listed 78 days
Property features AI
Finance
- Other: Living area approximately 1,920 (as reported); Total building area reported as 1,920 (public records)
- Financial info: Annual net income reported: $21,000; Pro forma rents: one 2-bedroom unit at $1,050; two 1-bedroom units at $900 each
- HOA & community: No association
Exterior
- Utilities: Public water; Public sewer; Cable connected; Electricity connected; Broadband/High-speed internet available
- Home design: Residential income property (Triplex); One building on the lot; R-2 zoning
- Construction: Frame construction; Metal roof; Slab foundation; Lot approximately 0.16 acres (73 x 95)
- Exterior features: Other exterior features; Asphalt road access
Interior
- Bedrooms: Total of 4 bedrooms; Units include one 2-bedroom unit and two 1-bedroom units
- Bathrooms: Each unit has 1 bathroom
- Heating & cooling: Ductless heating; Wall/window air conditioning units
- Interior features: Other interior features
- Laundry & utility: No laundry room features listed
Neighborhood map
What this means for you Summary
Snapshot
- This is a 1×2bd/1.0ba + 2×1bd/1.0ba units multifamily listed at $235k.
Deal economics
- At list price, monthly cash flow is $656 ($8k/yr) — positive. Per door: $219/mo.
- The deal already cash-flows at list — no discount required.
- Meets the 1% rule at list price ($3k rent vs $235k).
- Recommended offer: $221k (6.0% below list) — sets the bar for market timing.
Location & tenants
- Location reads 61/100 on livability (#779 in FL) — a middle-class / working-renter tenant base. Strengths: cost of living A+, housing A+; Watch: schools D-, amenities F, commute F.
- Polk (suburban): math 39% / reading 43% proficiency, ranked #62 of 73 in FL (top 85%) — families likely to look elsewhere, expect single-tenant / working-renter base with shorter leases.
- Market conditions: 119 active listings in the ZIP; 10,384 units permitted in Polk County in 2024 (1,716 in 5+ unit buildings).
Forward outlook
- In year one you build about $25k of equity ($2k loan paydown + $24k appreciation (10.0% local appreciation)).
- Polk County population projected at +33% by 2050 — long-run rental-demand tailwind backs the buy-and-hold thesis.
- At projected returns (10.0% appreciation + 3.0% rent growth), your $66k cash investment doubles in ~2 years — after that, you're playing with house money.
- By year 2, paydown + projected appreciation supports a ~$40k cash-out refi (75% LTV) — recoverable capital for the next deal without selling this one.
Negotiation context
- It's been on market 78 days — a 6% lower offer ($221k) is reasonable based on typical stale-listing flexibility.
- 2 sale attempts since 7y ago with the ask held roughly flat each time — persistent listings suggest the price (not the market) is what's stuck; bring a comps-based counter.
- Current owner paid $118k; list at $235k implies a 99% gain — meaningful room to come down on a strong offer.
Risks & watch-outs
- Watch-outs: built in 1956 — expect roof / HVAC / electrical / plumbing capex.
- Climate carrying-cost: severe wind risk, 99% chance of damaging wind over 30y; moderate wildfire risk; extreme-heat days projected 7→25/yr by 2055 (HVAC capex compounding) — expect insurance premiums to compound above CPI over the hold.
Questions for the listing agent
- It's been on market 78 days. Have you received any prior offers? Is the seller open to a 6% concession, seller financing, or rate buy-down credit?
- Can we see the unit-by-unit rent roll, current vacancy, and any below-market leases? What's the average tenancy length?
- What capital expenditures (roof, boiler, parking lot, exteriors) have been made in the last 5 years, and what's planned in the next 2?
- Built in 1956 — when were the roof, HVAC, electrical panel, plumbing, and water heater last replaced?
- Why hasn't it sold? Are there any deal-killer items the seller is aware of (foundation, flood, title, zoning, code violations)?
- Is there a deadline driving the sale (1031 exchange, divorce, estate, relocation)? That informs how much negotiation room exists.
- Schools are D-rated, which usually means shorter tenancies and higher turnover. Who's the typical renter profile here, and what's been the actual vacancy rate?
- What's the average days-on-market for RENTAL listings here right now (not sales)? A rising rental-DOM trend means longer vacancies and softer asking-rent achievability than the comps imply.
- What's the recent tenant-quality profile in this submarket — average credit score on applications, eviction rate, late-payment / NSF rate, and stable-employment percentage? A property-management company in the area should have these aggregated.
- How much new apartment / multifamily construction is in the pipeline within 1–3 miles? Heavy new supply (>2% of stock underway) typically softens rents 12–24 months out; light construction supports rent growth.
Investment metrics
- 1% rule
- 1.27% ✓
- Cap rate
- 9.64%
- Cash-on-cash
- 11.96%
- DSCR
- 1.53
- GRM
- 6.6
CMA / ARV
No comps found within radius.
Projected returns pro-forma
10.0% appreciation · 3.0% rent growth · sell at horizon
- IRR
- 33.1%
- Equity multiple
- 3.58×
- Total profit
- $169,827
- Equity at exit
- $211,706
- IRR
- 28.5%
- Equity multiple
- 8.10×
- Total profit
- $467,455
- Equity at exit
- $456,551
Cash invested: $65,800 (down + closing). Projections, not guarantees.
Landlord ↔ Tenant lean methodology
- Overall (STATE)
- 87 Strongly Landlord-Friendly
- State Florida
- 87 Strongly Landlord-Friendly · R+3
- County
- — inherits STATE
- City
- — inherits STATE
ZIP-level market 33841
- Home prices YoY
- 7.7%
- Active inventory
- 119
- Price-to-rent
- 19.7×
Monthly cashflow live
- Estimated rent
- $2,975 high interval (Pro) →
- Mortgage (P&I)
- −$1,232
- Tax from tax record
- −$364 /mo · $4,373/yr
- Insurance
- −$98
- HOA
- −$0
- Vacancy / Maint / Mgmt
- −$625
- Net cashflow
- $656
Break-even live
3-unit breakdown (identical units grouped — click to expand)
| Units | Beds | Baths | Est. rent |
|---|---|---|---|
| 1× unit | 2 | 1 | $992 |
| 2× units | 1 | 1 | $1,984 |
| #2 | 1 | 1 | $992 |
| #3 | 1 | 1 | $992 |
| Total (3 units) | $2,975 | ||
UW: 25.0% down · 7.5% · 30yr · 1.5% tax · 5.0% vac · 8.0% maint · 8.0% mgmt
Financing live
Cash to close
- Down payment
- $58,750
- Closing costs
- $7,050
- Reserves months
- —
- Total cash needed
- —
Loan-product check · same deal, 3 products live
Conventional
25% down · 7.5% · 30yr
- Down + closing
- —
- Monthly P&I
- —
- Monthly cashflow
- —
- DSCR
- —
- Eligible?
- —
Personal DTI + credit; lowest rate.
DSCR
20% down · 8.5% · 30yr
- Down + closing
- —
- Monthly P&I
- —
- Monthly cashflow
- —
- DSCR
- —
- Eligible?
- —
No personal income docs; deal must DSCR.
Hard money
10% down · 12.0% · 12mo
- Down + closing
- —
- Monthly P&I
- —
- Monthly cashflow
- —
- DSCR
- —
- Eligible?
- —
Short-term bridge; refi at stabilization.
Listing history 21 events
-
2026-06-18days on market $234,999 Active 78 DOM
-
2026-06-17days on market $234,999 Active 77 DOM
-
2026-06-16days on market $234,999 Active 76 DOM
-
2026-06-15days on market $234,999 Active 75 DOM
-
2026-06-13days on market $234,999 Active 73 DOM
-
2026-06-10days on market $234,999 Active 70 DOM
-
2026-06-09days on market $234,999 Active 69 DOM
-
2026-06-08days on market $234,999 Active 68 DOM
-
2026-06-07days on market $234,999 Active 67 DOM
-
2026-06-05days on market $234,999 Active 64 DOM
-
2026-06-03days on market $234,999 Active 63 DOM
-
2026-06-03days on market $234,999 Active 62 DOM
-
2026-06-01days on market $234,999 Active 61 DOM
-
2026-05-31days on market $234,999 Active 60 DOM
-
2026-04-01$234,999 Active
-
2019-12-02soldstatus $118,000
-
2019-11-04status Pending
-
2019-10-21$120,000 Active
-
2019-07-30soldstatus $77,000
-
2003-10-17soldstatus $55,000
-
1994-03-01soldstatus $116,000
ⓘ Source: listings_history table (triggers on properties + properties_extension) + one-shot
backfill from property_details.listing_events for pre-trigger history.
Tax reassessment forecast FL · Resets to sale price
- Current annual tax
- $4,373 · $364/mo
- Projected year-2 tax
- $4,373 · $364/mo
- Expected delta
- $0/yr ($0/mo · 0.0%)
ⓘ Screening estimate from a state-policy table — verify with the county assessor before closing.
Climate risk First Street
- Flood 1/10 Low FEMA zone X (unshaded) · 0% chance over 30 yrs
- Wildfire 5/10 Major
- Heat 8/10 Severe 7 d/yr ≥108°F today · 25 d/yr by 30 yrs out
- Wind 9/10 Extreme 99% chance of damaging wind over 30 yrs
- Air quality 2/10 Low 2 unhealthy d/yr today · 2 by 30 yrs out
Nearby sold comps map
Loading sold comps map…
Walkable amenities ~0.75 mi
Loading nearby amenities…
Taxation est. · year 1
- Rental income
- $35,700
- − Mortgage interest
- −$13,164
- − Property taxes
- −$4,373
- − Insurance
- −$1,175
- − Repairs & maintenance
- −$2,856
- − Management
- −$2,856
- − Depreciation
- −$6,836
- Taxable income
- $4,440
- Est. tax owed @ 24.0%
- −$1,066
- After-tax cash flow
- $6,801/yr
For passive investors: Depreciation is non-cash, so a rental often shows a tax loss while cash-flowing — sheltering income. Rental losses are passive: they offset passive income freely, and up to $25,000/yr can offset ordinary (W-2) income if you actively participate and your MAGI is under $100k (phasing out to $0 by $150k); unused losses carry forward. On sale, claimed depreciation is recaptured at up to 25%, and gains may owe capital-gains tax (a 1031 exchange can defer both). Figures are a year-1 estimate at your 24.0% rate — not tax advice; consult a CPA.
Schools (NCES district)
- District
- Polk
- NCES district ID
- 1201590
- Math proficiency
- 39% ▼ -11.00%
- Reading proficiency
- 43% ▼ -4.00%
- Median HH income
- $43,979
- Composite
- 34.74/100
- National rank
- #5132
- State rank
- #62 of 73 in FL
Livability — Fort Meade
- Score
- 61/100
- State rank
- #779
- US rank
- #17625
Category grades
Schools grade is shown separately in the Schools card above.
Census & demographics
- Census place
- Fort Meade, FL
- Population (ZIP)
- 8,268
Population outlook (Polk County) Hauer SSP2
- Today (2025)
- 752,975 people
- By 2030
- 804,621 · +6.9%
- By 2040
- 906,117 · +20.3%
- By 2050
- 1,000,476 · +32.9%
- By 2075
- 1,197,520 · +59.0%
- By 2100
- 1,271,518 · +68.9%
Race, ethnicity, and origin ACS 2023
- Neighborhood character
- Diverse neighborhood (Simpson 0.59)
- Race & ethnicity
- White 50% Hispanic / Latino 38% Two or more races 13% Black 9%
- Hispanic origin (detail)
- Mexican 32% Puerto Rican 3%
- Common ancestry
- Slovak 1% Lithuanian 1%
- Foreign-born
- 11% · Canada, Jamaica
- Languages at home
- 70% English-only · Spanish 30%
Political lean MEDSL · Polk
- 2024 margin
- Strong R (+20.7) · D 39.2% · R 59.9%
- 2008→2024 swing
- -14.6pp toward R · 2008: -6.1pp · 2024: -20.7pp
- All cycles
- 2024: R+20.7 2020: R+14.4 2016: R+14.1 2012: R+6.8 2008: R+6.1
Not yet ingested
- Civics
- —
Market trends
- HPI YoY
- ▲ 26.92%
- Current HPI
- 376.8183
- Rent YoY
- —
- Metro
- —
- State GDP YoY
- ▲ 3.28%
- F500 in state
- 36
Industry mix (Fortune 500 HQ in FL)
| Industry | F500 HQs | Revenue |
|---|---|---|
| Industrial Technology | 2 | $29B |
|
||
| Insurance | 2 | $17B |
|
||
| Retail | 1 | $60B |
|
||
| Technology Distribution | 1 | $58B |
|
||
| Homebuilding | 1 | $35B |
|
||
| Technology Manufacturing | 1 | $35B |
|
||
Price history
+102.6% since first listed7 events — show timeline
- 2026-04-01 Listed $234,999 Stellar MLS as Distributed by MLS Grid
- 2019-12-02 Sold (Public Records) $118,000 Public Records
- 2019-11-04 Pending — Stellar MLS as Distributed by MLS Grid
- 2019-10-21 Listed $120,000 Stellar MLS as Distributed by MLS Grid
- 2019-07-30 Sold (Public Records) $77,000 Public Records
- 2003-10-17 Sold (Public Records) $55,000 Public Records
- 1994-03-01 Sold (Public Records) $116,000 Public Records
Property tax history
+16.0%/yrLatest (2025): $4,373 · +15.4% YoY. Source: county tax records.
Cash-flow waterfall
monthlySold comps — $/sqft
last 12 mo · ≤1 miLoading sold comps…