 Triplex
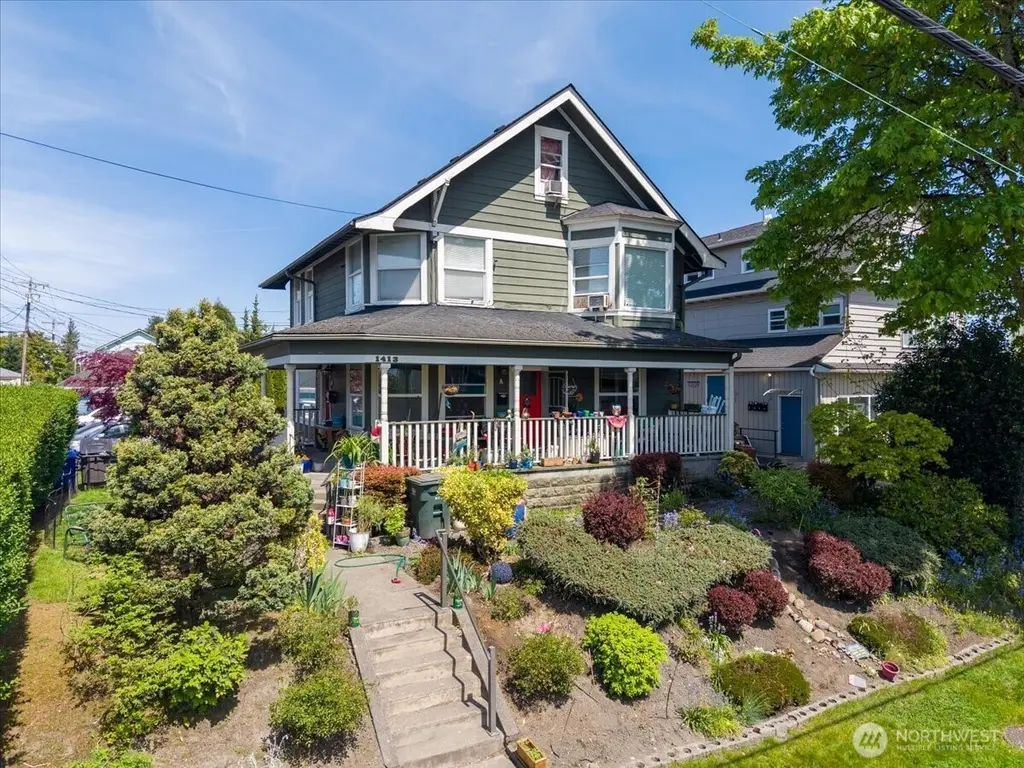
1413 23rd St · Everett, WA
Flood risk 1/10 · Minimal
- FEMA flood zone
- X (unshaded)
- Chance of flooding over 30 yrs
- 0.0%
- Est. flood insurance / yr
- $473 – $860
Fire risk 1/10 · Minimal
- Est. fire insurance / yr
- $604 – $1,122
Heat risk 3/10 · Minor
- Hot days now (above 85°F)
- 7 days/yr
- Hot days in 30 yrs
- 17 days/yr
Wind risk 1/10 · Minimal
- Chance of severe wind over 30 yrs
- —
Air-quality risk 6/10 · Moderate
- Unhealthy air days now
- 9 days/yr
- Unhealthy air days in 30 yrs
- 10 days/yr
Risk factors via First Street. Map © Google.
Why this score? — see what drove the C+ grade
The composite is a weighted blend of 9 inputs, each scored 0–100. Each bar is that input's sub-score; the figure is the points it added to the 100-point composite (weight × sub-score).
- Cash flow +22.1/30.0
- ARV discount +12.3/15.0
- DSCR +7.1/10.0
- Schools +5.9/10.0
- 1% rule +4.9/10.0
- Livability +3.7/5.0
- Rent growth +3.2/5.0
- Condition / age +2.5/5.0
- Appreciation +0.0/10.0
$750,000
🖨 Deal sheet 📄 Offer letter ✓ Due diligence
Multi-family units
County records classify this as Multi-Family (2-4 Unit). Listing-text estimate: 3 units. confirmed
Listing remarks
Well-maintained Triplex in the heart of Historic North Everett with Sound and Mountain views. Blending timeless charm with strong income potential. This 3-story property with basement storage offers 3,310 total sq ft, including 2,350 sq ft of finished living space across three units. The large basement is nearly 1,000' currently used for laundry and storage, lots of potential for your ideas, a possible 4th unit? Buyer to verify. Classic architectural details shine with a welcoming wrap-around porch, while the fully fenced backyard features a spacious deck and nice garden—perfect for tenants to enjoy outdoor living. The property includes a versatile studio with Murphy bed, a comfortabl
Key facts
- Versatile studio
- Spacious deck
- Wrap-around porch
Tags
Property features AI
Finance
- Other: Possible use: Multi-family
- Financial info: Gross scheduled income: $61,740; Gross adjusted income: $61,740; Total monthly income: $5,145; Net operating income: $48,394; Total expenses: $13,346; Electric expense: $1,416; Insurance expense: $2,928; Gross rent multiplier: 12.15; Listing terms: Cash or Conventional
Exterior
- Parking: 4 uncovered parking spaces
- Security: Fully fenced
- Utilities: Electric energy source; Public water (City of Everett); Sewer connected (City of Everett); Power provided by PUD
- Home design: Residential income property (triplex); Triplex structure; 4 total stories; Good condition; Facing direction not listed; Entry level not listed
- Construction: Wood construction; Composition roof; Poured concrete foundation; Effective year built 1970
- Exterior features: Wood exterior; Deck; Fully fenced yard; Cable TV and high-speed internet available; Corner lot with curbs, paved streets and sidewalk; Has view
Interior
- Kitchen: Each unit equipped with range/oven; Each unit has refrigerator; Each unit has dishwasher
- Bedrooms: Unit B: 3 bedrooms; Unit C: 1 bedroom
- Flooring: Hardwood; Laminate; Vinyl; Carpet
- Bathrooms: Unit A: 1 bathroom; Unit B: 2 bathrooms; Unit C: 1 bathroom
- Heating & cooling: Baseboard heating; No central cooling
- Interior features: Hardwood, laminate, vinyl and carpet flooring; Basement; Storage
- Laundry & utility: No in-unit washer/dryer (units share no listed washers/dryers)
Neighborhood map
What this means for you Summary
Snapshot
- This is a 3 × 4-bed/4.0-bath units multifamily listed at $750k.
Deal economics
- At list price, monthly cash flow is $1k ($15k/yr) — positive. Per door: $404/mo.
- The deal already cash-flows at list — no discount required.
- To meet the 1% rule (rent ≥ 1% of price), the offer needs to be $745k (0.7% below list).
- Recommended offer: $739k (1.5% below list) — sets the bar for market timing.
- Cap rate 8.2% vs local median 2.5% in Everett — top-decile yield for the area; either an underpriced asset or a hidden risk that comps aren't pricing in. Stress-test before assuming the spread holds.
Location & tenants
- Location reads 73/100 on livability (#199 in WA) — a middle-class / working-renter tenant base. Strengths: commute A+, housing A, health & safety A; Watch: crime D+, amenities F, cost of living F.
- Everett School District (urban): math 60% / reading 72% proficiency, ranked #26 of 291 in WA (top 9%) — acceptable for families but not a draw, mixed tenant base, ~2y average lease.
- Zoned schools: Whittier Elementary (405 students, 43% FRL); Everett High School (1,606 students, 57% FRL) — zoned schools average 50% FRL vs 31% district-wide (19 pts higher); higher-poverty schools than district average — tighter screening recommended.
- Market conditions: Rents rising (+3.0%/yr); 149 active listings in the ZIP; 10 comparable units currently listed for rent nearby; rentals at typical pace (median 17d on market — plan ~3-4 weeks tenant-placement turnaround); 3,982 units permitted in Snohomish County in 2024 (1,492 in 5+ unit buildings).
- At $7,451/mo this rent would consume 120% of the median local household income ($75k/yr) (locally 2144% of renters already pay >50% of income on rent) — very limited rent-growth headroom before tenants either downsize or default.
Forward outlook
- Local home prices are declining (-3.0%/yr); year-one equity from $5k of loan paydown is wiped out by about $22k of value loss. Plan a longer hold.
- Snohomish County population projected at +30% by 2050 — long-run rental-demand tailwind backs the buy-and-hold thesis.
Negotiation context
- It's been on market 21 days — a 2% lower offer ($739k) is reasonable based on typical stale-listing flexibility.
- 2 sale attempts since 9y ago with the ask held roughly flat each time — persistent listings suggest the price (not the market) is what's stuck; bring a comps-based counter.
- Current owner paid $435k; list at $750k implies a 72% gain — meaningful room to come down on a strong offer.
Risks & watch-outs
- Watch-outs: built in 1905 — expect roof / HVAC / electrical / plumbing capex.
Questions for the listing agent
- Can we see the unit-by-unit rent roll, current vacancy, and any below-market leases? What's the average tenancy length?
- What capital expenditures (roof, boiler, parking lot, exteriors) have been made in the last 5 years, and what's planned in the next 2?
- Built in 1905 — when were the roof, HVAC, electrical panel, plumbing, and water heater last replaced?
- Is there a deadline driving the sale (1031 exchange, divorce, estate, relocation)? That informs how much negotiation room exists.
- Crime grade is D in this area — have there been break-ins, vandalism, or insurance claims at this property in the last 3 years? What carrier currently insures it and at what premium?
- What's the average days-on-market for RENTAL listings here right now (not sales)? A rising rental-DOM trend means longer vacancies and softer asking-rent achievability than the comps imply.
- What's the recent tenant-quality profile in this submarket — average credit score on applications, eviction rate, late-payment / NSF rate, and stable-employment percentage? A property-management company in the area should have these aggregated.
- How much new apartment / multifamily construction is in the pipeline within 1–3 miles? Heavy new supply (>2% of stock underway) typically softens rents 12–24 months out; light construction supports rent growth.
Investment metrics
- 1% rule
- 0.99% ✗
- Cap rate
- 8.23%
- Cash-on-cash
- 6.92%
- DSCR
- 1.31
- GRM
- 8.4
CMA / ARV
- ARV (median comp)
- $839,706
- List price
- $750,000
- Delta
- -10.68%
- Verdict
- UNDERPRICED
- Comps
- 20 within 1.0 mi
Show comp detail 1 sale within ~0.75 mi
| Address | Dist | Beds/Ba | Sqft | Sold | Price | $/sf | Match |
|---|---|---|---|---|---|---|---|
| 2223 Rockefeller Ave | 0.23mi | 4/2.0 (+1) | 1,948 (-12%) | 16mo | $625,000 | $321 | 43 |
Match score weights: distance 35% · size 25% · config 20% · recency 20%. Top-matched comps best support the ARV.
Projected returns pro-forma
-3.0% appreciation · 2.95% rent growth · sell at horizon
- IRR
- -5.8%
- Equity multiple
- 0.79×
- Total profit
- $-45,005
- Equity at exit
- $111,827
- IRR
- 3.8%
- Equity multiple
- 1.27×
- Total profit
- $57,745
- Equity at exit
- $64,846
Cash invested: $210,000 (down + closing). Projections, not guarantees.
Landlord ↔ Tenant lean methodology
- Overall (STATE)
- 28 Tenant-Leaning
- State Washington
- 28 Tenant-Leaning · D+8
- County
- — inherits STATE
- City
- — inherits STATE
ZIP-level market 98201
- Rents YoY
- 3.0%
- Active inventory
- 149
- Price-to-rent
- 25.2×
Monthly cashflow live
- Estimated rent
- $7,451 medium interval (Pro) →
- Mortgage (P&I)
- −$3,933
- Tax from tax record
- −$430 /mo · $5,162/yr
- Insurance
- −$312
- HOA
- −$0
- Vacancy / Maint / Mgmt
- −$1,565
- Net cashflow
- $1,211
Break-even live
3-unit breakdown (identical units grouped — click to expand)
| Units | Beds | Baths | Est. rent |
|---|---|---|---|
| 3× units | 4 | 4 | $7,452 |
| #1 | 4 | 4 | $2,484 |
| #2 | 4 | 4 | $2,484 |
| #3 | 4 | 4 | $2,484 |
| Total (3 units) | $7,451 | ||
UW: 25.0% down · 7.5% · 30yr · 1.5% tax · 5.0% vac · 8.0% maint · 8.0% mgmt
Financing live
Cash to close
- Down payment
- $187,500
- Closing costs
- $22,500
- Reserves months
- —
- Total cash needed
- —
Loan-product check · same deal, 3 products live
Conventional
25% down · 7.5% · 30yr
- Down + closing
- —
- Monthly P&I
- —
- Monthly cashflow
- —
- DSCR
- —
- Eligible?
- —
Personal DTI + credit; lowest rate.
DSCR
20% down · 8.5% · 30yr
- Down + closing
- —
- Monthly P&I
- —
- Monthly cashflow
- —
- DSCR
- —
- Eligible?
- —
No personal income docs; deal must DSCR.
Hard money
10% down · 12.0% · 12mo
- Down + closing
- —
- Monthly P&I
- —
- Monthly cashflow
- —
- DSCR
- —
- Eligible?
- —
Short-term bridge; refi at stabilization.
Rent comps 10 comps
| Address | Beds | Baths | Sqft | Rent | $/sqft | DOM | Units | Dist |
|---|---|---|---|---|---|---|---|---|
| 2314 Hoyt Ave Everett, WA | 2.0 | 1.0 | 1400 | $1,985 | $1.42 | 24d | 1 | 0.02mi |
| 2102 Grand Ave Unit 2 Everett, WA | 2.0 | 3.0 | 1500 | $2,495 | $1.66 | 24d | 1 | 0.24mi |
| 3010 Norton Ave Unit A Everett, WA | 4.0 | 2.0 | 1640 | $3,145 | $1.92 | 2d | 1 | 0.71mi |
| 1410 Hoyt Ave Everett, WA | 4.0 | 1.0 | 1794 | $3,750 | $2.09 | 4d | 1 | 0.80mi |
| 1427 Virginia Ave Everett, WA | 3.0 | 2.5 | 1476 | $2,750 | $1.86 | 24d | 1 | 0.97mi |
| 1622 E Marine View Dr Everett, WA | 1.0–4.0 | 1.0–2.0 | 1158 | $2,657 | $2.29 | 1d | 1 | 1.28mi |
| 950 Maple St Everett, WA | 3.0 | 3.5 | 1699 | $3,300 | $1.94 | 10d | 1 | 1.49mi |
| 950 Maple St Unit F Everett, WA | 3.0 | 3.5 | 1811 | $3,400 | $1.88 | 17d | 1 | 1.49mi |
| 950 Maple St Unit B Everett, WA | 3.0 | 3.5 | 1700 | $3,300 | $1.94 | 16d | 1 | 1.49mi |
| 950 Maple St Unit C Everett, WA | 3.0 | 3.5 | 1700 | $3,200 | $1.88 | 16d | 1 | 1.49mi |
Listing history 9 events
-
2026-05-08$750,000 Active
-
2017-11-16soldstatus $435,000 Sold
-
2017-11-16soldstatus $435,000
-
2017-11-12status Pending
-
2017-11-03status Pending Inspection
-
2017-10-31$440,000 Active
-
1993-12-28soldstatus $155,000
-
1989-11-13soldstatus $99,950
-
1984-12-31soldstatus $94,500
ⓘ Source: listings_history table (triggers on properties + properties_extension) + one-shot
backfill from property_details.listing_events for pre-trigger history.
Tax reassessment forecast WA · Resets to sale price
- Current annual tax
- $5,162 · $430/mo
- Projected year-2 tax
- $7,350 · $612/mo
- Expected delta
- +$2,188/yr (+$182/mo · 42.4%)
ⓘ Screening estimate from a state-policy table — verify with the county assessor before closing.
Climate risk First Street
- Flood 1/10 Low FEMA zone X (unshaded) · 0% chance over 30 yrs
- Wildfire 1/10 Low
- Heat 3/10 Moderate 7 d/yr ≥85°F today · 17 d/yr by 30 yrs out
- Wind 1/10 Low
- Air quality 6/10 Major 9 unhealthy d/yr today · 10 by 30 yrs out
Nearby sold comps map
Loading sold comps map…
Walkable amenities ~0.75 mi
Loading nearby amenities…
Taxation est. · year 1
- Rental income
- $89,412
- − Mortgage interest
- −$42,012
- − Property taxes
- −$5,162
- − Insurance
- −$3,750
- − Repairs & maintenance
- −$7,153
- − Management
- −$7,153
- − Depreciation
- −$21,818
- Taxable income
- $2,364
- Est. tax owed @ 24.0%
- −$567
- After-tax cash flow
- $13,959/yr
For passive investors: Depreciation is non-cash, so a rental often shows a tax loss while cash-flowing — sheltering income. Rental losses are passive: they offset passive income freely, and up to $25,000/yr can offset ordinary (W-2) income if you actively participate and your MAGI is under $100k (phasing out to $0 by $150k); unused losses carry forward. On sale, claimed depreciation is recaptured at up to 25%, and gains may owe capital-gains tax (a 1031 exchange can defer both). Figures are a year-1 estimate at your 24.0% rate — not tax advice; consult a CPA.
Schools (NCES district)
- District
- Everett School District
- NCES district ID
- 5302670
- Math proficiency
- 60% ▲ 1.00%
- Reading proficiency
- 72% ▲ 1.00%
- Median HH income
- $66,815
- Composite
- 59.0/100
- National rank
- #1964
- State rank
- #26 of 291 in WA
Livability — Everett
- Score
- 73/100
- State rank
- #199
- US rank
- #5489
Category grades
Schools grade is shown separately in the Schools card above.
Census & demographics
- Census place
- Everett, WA
- County
- Snohomish County · 786,756 people
- City population
- 173,457
- Metro
- Seattle-Tacoma-Bellevue, WA
- Population (ZIP)
- 31,895
- Household income
- $74,554
- Rent vs Own
- Severe rent burden
- 2144.0
Population outlook (Snohomish County) Hauer SSP2
- Today (2025)
- 899,800 people
- By 2030
- 960,975 · +6.8%
- By 2040
- 1,074,447 · +19.4%
- By 2050
- 1,171,954 · +30.2%
- By 2075
- 1,384,849 · +53.9%
- By 2100
- 1,497,296 · +66.4%
Race, ethnicity, and origin ACS 2023
- Neighborhood character
- Predominantly White (71%)
- Race & ethnicity
- White 71% Hispanic / Latino 12% Two or more races 12% Asian 3% Pacific Islander 2% Black 2% Native American 1%
- Hispanic origin (detail)
- Mexican 7%
- Common ancestry
- Portuguese 6% Italian 4% Slovak 4%
- Foreign-born
- 10% · Canada, Jamaica, Vietnam
- Languages at home
- 87% English-only · Spanish 6% Russian/Polish/Slavic 2% Other Asian/Pacific 1%
Political lean MEDSL · Snohomish
- 2024 margin
- D (+19.0) · D 57.8% · R 38.9% · Other 3.3%
- 2008→2024 swing
- +0.1pp no change · 2008: 18.9pp · 2024: 19.0pp
- All cycles
- 2024: D+19.0 2020: D+20.6 2016: D+16.6 2012: D+16.2 2008: D+18.9
Not yet ingested
- Civics
- —
Market trends
- HPI YoY
- ▼ -793.56%
- Current HPI
- 339.2661
- Rent YoY
- ▲ 2.95%
- Metro
- Seattle-Tacoma-Bellevue, WA
- State GDP YoY
- ▲ 4.65%
- F500 in state
- 22
Industry mix (Fortune 500 HQ in WA)
| Industry | F500 HQs | Revenue |
|---|---|---|
| Retail | 2 | $269B |
|
||
| Technology / Retail | 1 | $638B |
|
||
| Technology | 1 | $245B |
|
||
| Telecommunications | 1 | $38B |
|
||
| Food / Beverage | 1 | $36B |
|
||
| Automotive / Trucks | 1 | $34B |
|
||
Price history
+693.7% since first listed10 events — show timeline
- 2026-05-30 Pending — NWMLS as Distributed by MLS Grid
- 2026-05-08 Listed $750,000 NWMLS as Distributed by MLS Grid
- 2017-11-16 Sold (Public Records) $435,000 Public Records
- 2017-11-16 Sold (MLS) $435,000 NWMLS as Distributed by MLS Grid
- 2017-11-12 Pending — NWMLS as Distributed by MLS Grid
- 2017-11-03 Pending — NWMLS as Distributed by MLS Grid
- 2017-10-31 Listed $440,000 NWMLS as Distributed by MLS Grid
- 1993-12-28 Sold (Public Records) $155,000 Public Records
- 1989-11-13 Sold (Public Records) $99,950 Public Records
- 1984-12-31 Sold (Public Records) $94,500 Public Records
Property tax history
+3.2%/yrLatest (2026): $5,162 · -0.5% YoY. Source: county tax records.
Cash-flow waterfall
monthlySold comps — $/sqft
last 12 mo · ≤1 miLoading sold comps…