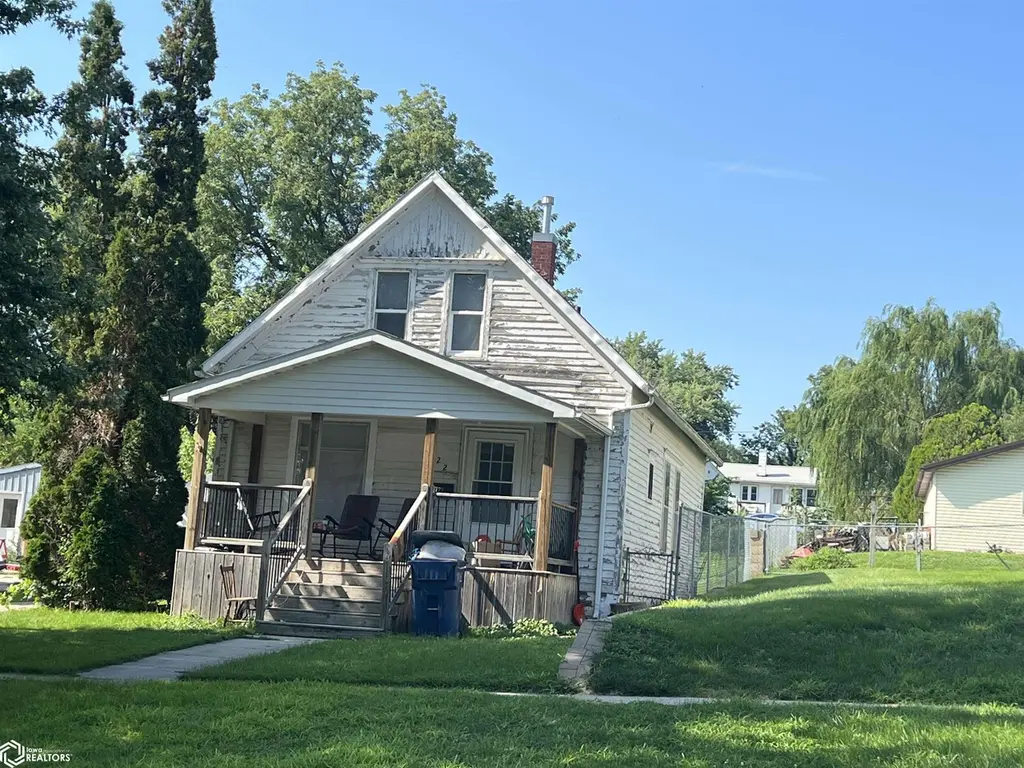
1722 1st Ave N · Denison, IA
Flood risk 1/10 · Minimal
- FEMA flood zone
- X (unshaded)
- Chance of flooding over 30 yrs
- 0.0%
- Est. flood insurance / yr
- $473 – $860
Fire risk 3/10 · Minor
- Est. fire insurance / yr
- $902 – $1,676
Heat risk 3/10 · Minor
- Hot days now (above 101°F)
- 7 days/yr
- Hot days in 30 yrs
- 15 days/yr
Wind risk 2/10 · Minimal
- Chance of severe wind over 30 yrs
- —
Air-quality risk 2/10 · Minimal
- Unhealthy air days now
- 0 days/yr
- Unhealthy air days in 30 yrs
- 1 days/yr
Risk factors via First Street. Map © Google.
Why this score? — see what drove the C grade
The composite is a weighted blend of 9 inputs, each scored 0–100. Each bar is that input's sub-score; the figure is the points it added to the 100-point composite (weight × sub-score).
- Cash flow +17.6/30.0
- ARV discount +15.0/15.0
- DSCR +5.5/10.0
- Schools +5.3/10.0
- 1% rule +4.8/10.0
- Livability +4.0/5.0
- Rent growth +2.5/5.0
- Condition / age +2.5/5.0
- Appreciation +0.0/10.0
$95,000
🖨 Deal sheet 📄 Offer letter ✓ Due diligence
Listing remarks MLS
Looking for a starter home or investment property? Check out this 3 bedroom, 1 bathroom home featuring an open living room, eat-in kitchen, and partial unfinished basement. Updates include a new roof in 2010, and furnace and central air in 2022. This home is priced to sell and won't last long!
Key facts
- Open living room
- Eat-in kitchen
- New roof
Tags
Neighborhood map
What this means for you Summary
Snapshot
- This is a 2-bed/1.0-bath single-family listed at $95k.
Deal economics
- At list price, monthly cash flow is $75 ($896/yr) — positive.
- The deal already cash-flows at list — no discount required.
- To meet the 1% rule (rent ≥ 1% of price), the offer needs to be $93k (1.8% below list).
- Recommended offer: $84k (12.0% below list) — sets the bar for market timing.
- Cap rate 7.2% vs local median 3.5% in Denison — top-decile yield for the area; either an underpriced asset or a hidden risk that comps aren't pricing in. Stress-test before assuming the spread holds.
Location & tenants
- Location reads 79/100 on livability (#103 in IA, #2,053 nationally) — a middle-class / working-renter tenant base. Strengths: crime A+, cost of living A+, housing A+; Watch: employment D, amenities F, commute F.
- Denison Community School District (town): math 61% / reading 64% proficiency, ranked #224 of 289 in IA (top 78%) — acceptable for families but not a draw, mixed tenant base, ~2y average lease; 62% free/reduced lunch — lower-income household profile, screen leases tightly.
- Market conditions: 50 active listings in the ZIP; 18 units permitted in Crawford County in 2024 (0 in 5+ unit buildings).
Forward outlook
- Local home prices are declining (-3.0%/yr); year-one equity from $657 of loan paydown is wiped out by about $3k of value loss. Plan a longer hold.
- Crawford County population projected at +10% by 2050 — modest demand growth; plan on rents tracking national, not racing it.
Negotiation context
- It's been on market 322 days — a 12% lower offer ($84k) is reasonable based on typical stale-listing flexibility.
Risks & watch-outs
- Watch-outs: built in 1904 — expect roof / HVAC / electrical / plumbing capex.
Questions for the listing agent
- It's been on market 322 days. Have you received any prior offers? Is the seller open to a 12% concession, seller financing, or rate buy-down credit?
- Built in 1904 — when were the roof, HVAC, electrical panel, plumbing, and water heater last replaced?
- Why hasn't it sold? Are there any deal-killer items the seller is aware of (foundation, flood, title, zoning, code violations)?
- Is there a deadline driving the sale (1031 exchange, divorce, estate, relocation)? That informs how much negotiation room exists.
- What's the average days-on-market for RENTAL listings here right now (not sales)? A rising rental-DOM trend means longer vacancies and softer asking-rent achievability than the comps imply.
- What's the recent tenant-quality profile in this submarket — average credit score on applications, eviction rate, late-payment / NSF rate, and stable-employment percentage? A property-management company in the area should have these aggregated.
- How much new for-sale + rental construction is in the pipeline within 1–3 miles? Heavy new supply typically softens prices + rents 12–24 months out; constrained supply supports both.
Investment metrics
- 1% rule
- 0.98% ✗
- Cap rate
- 7.24%
- Cash-on-cash
- 3.37%
- DSCR
- 1.15
- GRM
- 8.5
CMA / ARV
- ARV (median comp)
- $128,375
- List price
- $95,000
- Delta
- -26.00%
- Verdict
- UNDERPRICED
- Comps
- 20 within 1.0 mi
Show comp detail 12 sales within ~0.75 mi
| Address | Dist | Beds/Ba | Sqft | Sold | Price | $/sf | Match |
|---|---|---|---|---|---|---|---|
| 116 N 19th St | 0.11mi | 3/1.0 (+1) | 1,032 (+2%) | 2mo | $75,000 | $73 | 84 |
| 1420 3rd Ave S | 0.43mi | 2/1.0 | 1,040 (+3%) | 7mo | $115,000 | $111 | 69 |
| 21 S 17th St | 0.15mi | 3/1.0 (+1) | 1,075 (+6%) | 16mo | $76,000 | $71 | 64 |
| 616 N 18th St | 0.45mi | 2/1.0 | 960 (-5%) | 8mo | $155,000 | $161 | 64 |
| 1911 2nd Ave S | 0.29mi | 3/1.0 (+1) | 1,055 (+4%) | 14mo | $128,000 | $121 | 63 |
| 1428 2nd Ave S | 0.37mi | 3/2.0 (+1) | 1,056 (+5%) | 8mo | $65,000 | $62 | 60 |
| 222 S 15th St Unit C | 0.38mi | 2/2.0 | 1,087 (+8%) | 14mo | $149,900 | $138 | 54 |
| 220 16th St N | 0.16mi | 2/1.0 | 858 (-15%) | 17mo | $124,500 | $145 | 53 |
| 210 S 24th St | 0.53mi | 3/2.0 (+1) | 1,064 (+5%) | 10mo | $185,000 | $174 | 49 |
| 62 A Ave | 0.69mi | 2/1.0 | 920 (-9%) | 5mo | $85,000 | $92 | 49 |
| 1331 5th Ave N | 0.42mi | 3/2.0 (+1) | 1,160 (+15%) | 10mo | $132,000 | $114 | 38 |
| 2618 1st Ave S | 0.67mi | 3/2.0 (+1) | 1,114 (+10%) | 10mo | $115,000 | $103 | 35 |
Match score weights: distance 35% · size 25% · config 20% · recency 20%. Top-matched comps best support the ARV.
Projected returns pro-forma
-3.0% appreciation · 3.0% rent growth · sell at horizon
- IRR
- -11.0%
- Equity multiple
- 0.60×
- Total profit
- $-10,623
- Equity at exit
- $14,165
- IRR
- -1.7%
- Equity multiple
- 0.89×
- Total profit
- $-3,056
- Equity at exit
- $8,214
Cash invested: $26,600 (down + closing). Projections, not guarantees.
Landlord ↔ Tenant lean methodology
- Overall (STATE)
- 83 Strongly Landlord-Friendly
- State Iowa
- 83 Strongly Landlord-Friendly · R+6
- County
- — inherits STATE
- City
- — inherits STATE
ZIP-level market 51442
- Home prices YoY
- -21.4%
- Active inventory
- 50
- Price-to-rent
- 8.5×
Monthly cashflow live
- Estimated rent
- $933 medium interval (Pro) →
- Mortgage (P&I)
- −$498
- Tax from tax record
- −$125 /mo · $1,498/yr
- Insurance
- −$40
- HOA
- −$0
- Vacancy / Maint / Mgmt
- −$196
- Net cashflow
- $75
Break-even live
UW: 25.0% down · 7.5% · 30yr · 1.5% tax · 5.0% vac · 8.0% maint · 8.0% mgmt
Financing live
Cash to close
- Down payment
- $23,750
- Closing costs
- $2,850
- Reserves months
- —
- Total cash needed
- —
Loan-product check · same deal, 3 products live
Conventional
25% down · 7.5% · 30yr
- Down + closing
- —
- Monthly P&I
- —
- Monthly cashflow
- —
- DSCR
- —
- Eligible?
- —
Personal DTI + credit; lowest rate.
DSCR
20% down · 8.5% · 30yr
- Down + closing
- —
- Monthly P&I
- —
- Monthly cashflow
- —
- DSCR
- —
- Eligible?
- —
No personal income docs; deal must DSCR.
Hard money
10% down · 12.0% · 12mo
- Down + closing
- —
- Monthly P&I
- —
- Monthly cashflow
- —
- DSCR
- —
- Eligible?
- —
Short-term bridge; refi at stabilization.
Listing history 16 events
-
2026-06-16status $95,000 Pending 322 DOM
-
2026-06-15days on market $95,000 Active 322 DOM
-
2026-06-13days on market $95,000 Active 320 DOM
-
2026-06-12days on market $95,000 Active 319 DOM
-
2026-06-09days on market $95,000 Active 316 DOM
-
2026-06-08days on market $95,000 Active 315 DOM
-
2026-06-07days on market $95,000 Active 314 DOM
-
2026-06-07days on market $95,000 Active 313 DOM
-
2026-06-04days on market $95,000 Active 310 DOM
-
2026-06-02days on market $95,000 Active 309 DOM
-
2026-06-01days on market $95,000 Active 308 DOM
-
2026-05-31days on market $95,000 Active 307 DOM
-
2026-05-31days on market $95,000 Active 306 DOM
-
2025-10-09price $95,000 294-char remark
Show marketing remark (294 chars)
Looking for a starter home or investment property? Check out this 3 bedroom, 1 bathroom home featuring an open living room, eat-in kitchen, and partial unfinished basement. Updates include a new roof in 2010, and furnace and central air in 2022. This home is priced to sell and won't last long!
-
2025-07-29$100,000 Active 294-char remark
Show marketing remark (294 chars)
Looking for a starter home or investment property? Check out this 3 bedroom, 1 bathroom home featuring an open living room, eat-in kitchen, and partial unfinished basement. Updates include a new roof in 2010, and furnace and central air in 2022. This home is priced to sell and won't last long!
-
2008-04-17soldstatus $179,306
ⓘ Source: listings_history table (triggers on properties + properties_extension) + one-shot
backfill from property_details.listing_events for pre-trigger history.
Tax reassessment forecast IA · Partial reset (capped growth)
- Current annual tax
- $1,498 · $125/mo
- Projected year-2 tax
- $1,498 · $125/mo
- Expected delta
- $0/yr ($0/mo · 0.0%)
ⓘ Screening estimate from a state-policy table — verify with the county assessor before closing.
Climate risk First Street
- Flood 1/10 Low FEMA zone X (unshaded) · 0% chance over 30 yrs
- Wildfire 3/10 Moderate
- Heat 3/10 Moderate 7 d/yr ≥101°F today · 15 d/yr by 30 yrs out
- Wind 2/10 Low
- Air quality 2/10 Low 0 unhealthy d/yr today · 1 by 30 yrs out
Nearby sold comps map
Loading sold comps map…
Walkable amenities ~0.75 mi
Loading nearby amenities…
Taxation est. · year 1
- Rental income
- $11,199
- − Mortgage interest
- −$5,321
- − Property taxes
- −$1,498
- − Insurance
- −$475
- − Repairs & maintenance
- −$896
- − Management
- −$896
- − Depreciation
- −$2,764
- Taxable loss
- −$651
- Est. tax savings @ 24.0%
- +$156
- After-tax cash flow
- $1,052/yr
For passive investors: Depreciation is non-cash, so a rental often shows a tax loss while cash-flowing — sheltering income. Rental losses are passive: they offset passive income freely, and up to $25,000/yr can offset ordinary (W-2) income if you actively participate and your MAGI is under $100k (phasing out to $0 by $150k); unused losses carry forward. On sale, claimed depreciation is recaptured at up to 25%, and gains may owe capital-gains tax (a 1031 exchange can defer both). Figures are a year-1 estimate at your 24.0% rate — not tax advice; consult a CPA.
Schools (NCES district)
- District
- Denison Community School District
- NCES district ID
- 1908910
- Math proficiency
- 61% ▼ -7.00%
- Reading proficiency
- 64% ▲ 3.00%
- Median HH income
- $45,505
- Composite
- 52.71/100
- National rank
- #1550
- State rank
- #224 of 289 in IA
Livability — Denison
- Score
- 79/100
- State rank
- #103
- US rank
- #2053
Category grades
Schools grade is shown separately in the Schools card above.
Census & demographics
- Census place
- Denison, IA
- City population
- 9,586
- Population (ZIP)
- 9,586
Population outlook (Crawford County) Hauer SSP2
- Today (2025)
- 17,186 people
- By 2030
- 17,322 · +0.8%
- By 2040
- 17,948 · +4.4%
- By 2050
- 18,955 · +10.3%
- By 2075
- 22,130 · +28.8%
- By 2100
- 25,483 · +48.3%
Race, ethnicity, and origin ACS 2023
- Neighborhood character
- Diverse neighborhood (Simpson 0.58)
- Race & ethnicity
- White 48% Hispanic / Latino 43% Two or more races 21% Asian 3% Black 2%
- Hispanic origin (detail)
- Mexican 22%
- Common ancestry
- Italian 3% Ukrainian 2% Iranian 1%
- Foreign-born
- 24% · Canada, Philippines, South Korea
- Languages at home
- 59% English-only · Spanish 36% Other Asian/Pacific 3% Other Indo-European 1%
Political lean MEDSL · Crawford
- 2024 margin
- Solid R (+43.5) · D 27.8% · R 71.3%
- 2008→2024 swing
- -48.6pp toward R · 2008: 5.1pp · 2024: -43.5pp
- All cycles
- 2024: R+43.5 2020: R+36.8 2016: R+38.2 2012: R+8.2 2008: D+5.1
Not yet ingested
- Civics
- —
Market trends
- HPI YoY
- ▼ -50.48%
- Current HPI
- 185.0169
- Rent YoY
- —
- Metro
- —
- State GDP YoY
- ▲ 2.48%
- F500 in state
- 4
Industry mix (Fortune 500 HQ in IA)
| Industry | F500 HQs | Revenue |
|---|---|---|
| Financial Services | 1 | $16B |
|
||
| Retail / Convenience | 1 | $15B |
|
||
Price history
-47.0% since first listed3 events — show timeline
- 2025-10-09 Price Changed $95,000 IAR
- 2025-07-29 Listed $100,000 IAR
- 2008-04-17 Sold (Public Records) $179,306 Public Records
Property tax history
+4.2%/yrLatest (2025): $1,498 · +2.0% YoY. Source: county tax records.
Cash-flow waterfall
monthlySold comps — $/sqft
last 12 mo · ≤1 miLoading sold comps…