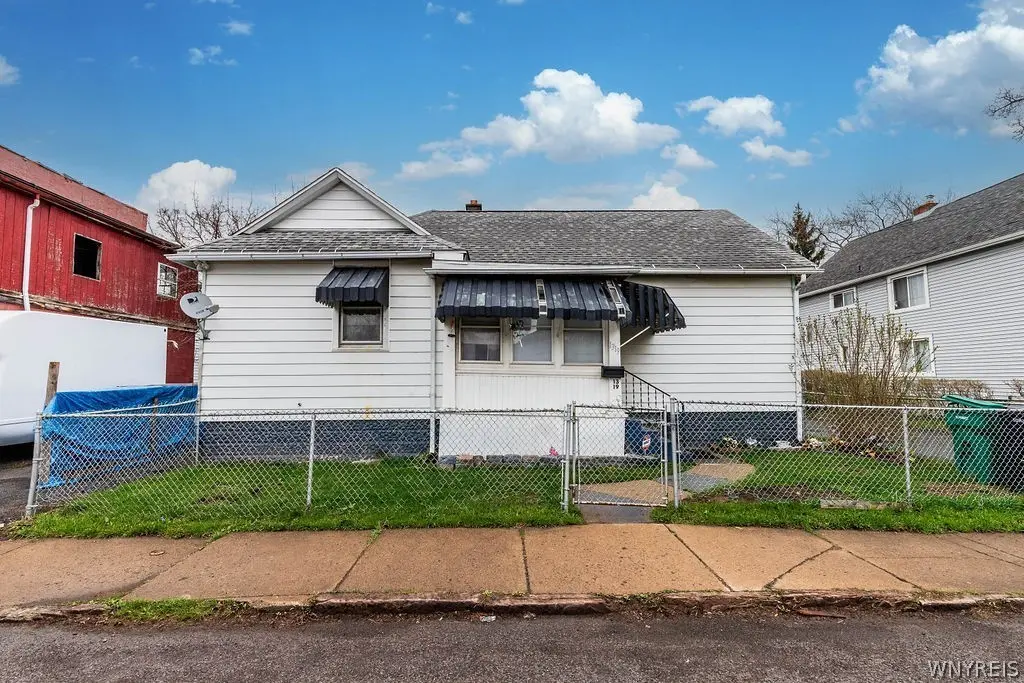
1319 15th St · Niagara Falls, NY
Flood risk 1/10 · Minimal
- FEMA flood zone
- X (unshaded)
- Chance of flooding over 30 yrs
- 0.0%
- Est. flood insurance / yr
- $473 – $860
Fire risk 1/10 · Minimal
- Est. fire insurance / yr
- $691 – $1,283
Heat risk 2/10 · Minimal
- Hot days now (above 94°F)
- 7 days/yr
- Hot days in 30 yrs
- 15 days/yr
Wind risk 1/10 · Minimal
- Chance of severe wind over 30 yrs
- —
Air-quality risk 3/10 · Minor
- Unhealthy air days now
- 2 days/yr
- Unhealthy air days in 30 yrs
- 3 days/yr
Risk factors via First Street. Map © Google.
Why this score? — see what drove the A- grade
The composite is a weighted blend of 9 inputs, each scored 0–100. Each bar is that input's sub-score; the figure is the points it added to the 100-point composite (weight × sub-score).
- Cash flow +30.0/30.0
- ARV discount +11.6/15.0
- 1% rule +10.0/10.0
- DSCR +10.0/10.0
- Appreciation +10.0/10.0
- Rent growth +4.7/5.0
- Livability +3.0/5.0
- Schools +2.5/10.0
- Condition / age +2.5/5.0
$73,000
🖨 Deal sheet 📄 Offer letter ✓ Due diligence
Listing remarks MLS
MOVE-IN READY INVESTMENT NOW ONLY $75,000!!—just add appliances!! Charming 3-bedroom ranch featuring a fully fenced yard, vinyl siding, and a 2-car blacktop driveway. Inside you'll find a spacious living room and a large eat-in kitchen with new countertops, new flooring, pantry storage, with gas or electric hookups for a stove. The home has been freshly painted throughout and includes a large walk-in closet, a walk-through bedroom, and a convenient mudroom entryway. The dry basement offers glass block windows, washer and dryer hookups, and an additional working toilet for added convenience. A large attic with pull-down stairs provides excellent storage space. Roof is approximately 15 years old and some newer windows. GREAT opportunity for first-time buyers, downsizers, or investors.
Key facts
- Blacktop driveway
- Large eat-in kitchen
- Vinyl siding
Tags
Neighborhood map
What this means for you Summary
Snapshot
- This is a 3-bed/1.0-bath single-family listed at $73k.
Deal economics
- At list price, monthly cash flow is $538 ($6k/yr) — positive.
- The deal already cash-flows at list — no discount required.
- Meets the 1% rule at list price ($1k rent vs $73k).
- Recommended offer: $69k (6.0% below list) — sets the bar for market timing.
- Cap rate 15.1% vs local median 7.7% in Niagara Falls — top-decile yield for the area; either an underpriced asset or a hidden risk that comps aren't pricing in. Stress-test before assuming the spread holds.
Location & tenants
- Location reads 60/100 on livability (#956 in NY) — a middle-class / working-renter tenant base. Strengths: cost of living A+, housing A+; Watch: schools F, crime F, amenities F.
- Niagara Falls City School District (urban): math 26% / reading 34% proficiency, ranked #578 of 590 in NY (top 98%) — families likely to look elsewhere, expect single-tenant / working-renter base with shorter leases; 66% free/reduced lunch — lower-income household profile, screen leases tightly.
- Market conditions: Rents rising fast (+8.8%/yr); 164 active listings in the ZIP; 17 comparable units currently listed for rent nearby; rentals at typical pace (median 17d on market — plan ~3-4 weeks tenant-placement turnaround); lower-income renter base — watch delinquency; 167 units permitted in Niagara County in 2024 (0 in 5+ unit buildings).
- At $1,300/mo this rent would consume 45% of the median local household income ($35k/yr) (locally 954% of renters already pay >50% of income on rent) — very limited rent-growth headroom before tenants either downsize or default.
Forward outlook
- In year one you build about $8k of equity ($505 loan paydown + $7k appreciation (10.0% local appreciation)).
- Niagara County population projected at -19% by 2050 — secular population decline; favor cash flow + early exit over multi-decade hold.
- At projected returns (10.0% appreciation + 8.0% rent growth), your $20k cash investment doubles in ~2 years — after that, you're playing with house money.
- By year 5, paydown + projected appreciation supports a ~$36k cash-out refi (75% LTV) — recoverable capital for the next deal without selling this one.
Negotiation context
- It's been on market 64 days — a 6% lower offer ($69k) is reasonable based on typical stale-listing flexibility.
- Current owner paid $11k; list at $73k implies a 564% gain — meaningful room to come down on a strong offer.
Risks & watch-outs
- Watch-outs: built in 1885 — expect roof / HVAC / electrical / plumbing capex.
Questions for the listing agent
- It's been on market 64 days. Have you received any prior offers? Is the seller open to a 6% concession, seller financing, or rate buy-down credit?
- Built in 1885 — when were the roof, HVAC, electrical panel, plumbing, and water heater last replaced?
- Why hasn't it sold? Are there any deal-killer items the seller is aware of (foundation, flood, title, zoning, code violations)?
- Is there a deadline driving the sale (1031 exchange, divorce, estate, relocation)? That informs how much negotiation room exists.
- Schools are F-rated, which usually means shorter tenancies and higher turnover. Who's the typical renter profile here, and what's been the actual vacancy rate?
- Crime grade is F in this area — have there been break-ins, vandalism, or insurance claims at this property in the last 3 years? What carrier currently insures it and at what premium?
- What's the average days-on-market for RENTAL listings here right now (not sales)? A rising rental-DOM trend means longer vacancies and softer asking-rent achievability than the comps imply.
- What's the recent tenant-quality profile in this submarket — average credit score on applications, eviction rate, late-payment / NSF rate, and stable-employment percentage? A property-management company in the area should have these aggregated.
- How much new for-sale + rental construction is in the pipeline within 1–3 miles? Heavy new supply typically softens prices + rents 12–24 months out; constrained supply supports both.
Investment metrics
- 1% rule
- 1.78% ✓
- Cap rate
- 15.13%
- Cash-on-cash
- 31.58%
- DSCR
- 2.40
- GRM
- 4.7
CMA / ARV
- ARV (median comp)
- $80,362
- List price
- $73,000
- Delta
- -9.16%
- Verdict
- FAIR
- Comps
- 20 within 1.0 mi
Show comp detail 12 sales within ~0.75 mi
| Address | Dist | Beds/Ba | Sqft | Sold | Price | $/sf | Match |
|---|---|---|---|---|---|---|---|
| 1145 Whitney Ave | 0.20mi | 3/1.5 | 992 (+2%) | 1mo | $105,100 | $106 | 84 |
| 1133 Whitney Ave | 0.22mi | 3/1.0 | 1,057 (+9%) | 3mo | $76,100 | $72 | 72 |
| 2217 Michigan Ave | 0.48mi | 2/1.0 (-1) | 960 (-1%) | 5mo | $40,000 | $42 | 67 |
| 1362 Michigan Ave | 0.24mi | 2/1.0 (-1) | 1,020 (+5%) | 12mo | $25,000 | $25 | 65 |
| 2402 Whitney Ave | 0.54mi | 2/1.0 (-1) | 948 (-2%) | 13mo | $68,000 | $72 | 55 |
| 1316 24th St | 0.52mi | 3/1.0 | 1,048 (+8%) | 10mo | $40,000 | $38 | 54 |
| 628 21st St | 0.61mi | 3/1.0 | 1,024 (+6%) | 11mo | $128,000 | $125 | 53 |
| 2479 Forest Ave | 0.73mi | 3/1.0 | 1,008 (+4%) | 10mo | $160,000 | $159 | 51 |
| 2475 La Salle Ave | 0.68mi | 3/2.0 | 1,024 (+6%) | 6mo | $129,320 | $126 | 49 |
| 2322 14th St | 0.62mi | 3/1.0 | 1,032 (+7%) | 14mo | $55,000 | $53 | 49 |
| 1705 Ferry Ave | 0.71mi | 3/1.0 | 1,080 (+12%) | 13mo | $65,000 | $60 | 36 |
| 2486 Willow Ave | 0.71mi | 3/1.5 | 1,108 (+14%) | 8mo | $136,500 | $123 | 34 |
Match score weights: distance 35% · size 25% · config 20% · recency 20%. Top-matched comps best support the ARV.
Projected returns pro-forma
10.0% appreciation · 8.0% rent growth · sell at horizon
- IRR
- 51.5%
- Equity multiple
- 4.96×
- Total profit
- $80,894
- Equity at exit
- $65,764
- IRR
- 47.2%
- Equity multiple
- 12.17×
- Total profit
- $228,321
- Equity at exit
- $141,823
Cash invested: $20,440 (down + closing). Projections, not guarantees.
Landlord ↔ Tenant lean methodology
- Overall (STATE)
- 15 Strongly Tenant-Friendly
- State New York
- 15 Strongly Tenant-Friendly · D+10
- County
- — inherits STATE
- City
- — inherits STATE
ZIP-level market 14301
- Home prices YoY
- 6.2%
- Rents YoY
- 8.8%
- Active inventory
- 164
- Price-to-rent
- 4.7×
Monthly cashflow live
- Estimated rent
- $1,300 high interval (Pro) →
- Mortgage (P&I)
- −$383
- Tax from tax record
- −$76 /mo · $912/yr
- Insurance
- −$30
- HOA
- −$0
- Vacancy / Maint / Mgmt
- −$273
- Net cashflow
- $538
Break-even live
UW: 25.0% down · 7.5% · 30yr · 1.5% tax · 5.0% vac · 8.0% maint · 8.0% mgmt
Financing live
Cash to close
- Down payment
- $18,250
- Closing costs
- $2,190
- Reserves months
- —
- Total cash needed
- —
Loan-product check · same deal, 3 products live
Conventional
25% down · 7.5% · 30yr
- Down + closing
- —
- Monthly P&I
- —
- Monthly cashflow
- —
- DSCR
- —
- Eligible?
- —
Personal DTI + credit; lowest rate.
DSCR
20% down · 8.5% · 30yr
- Down + closing
- —
- Monthly P&I
- —
- Monthly cashflow
- —
- DSCR
- —
- Eligible?
- —
No personal income docs; deal must DSCR.
Hard money
10% down · 12.0% · 12mo
- Down + closing
- —
- Monthly P&I
- —
- Monthly cashflow
- —
- DSCR
- —
- Eligible?
- —
Short-term bridge; refi at stabilization.
Rent comps 17 comps
| Address | Beds | Baths | Sqft | Rent | $/sqft | DOM | Units | Dist |
|---|---|---|---|---|---|---|---|---|
| 754 15th St Niagara Falls, NY | 3.0 | 1.0 | 990 | $1,100 | $1.11 | 23d | 1 | 0.30mi |
| 769 19th St Niagara Falls, NY | 2.0 | 1.5 | 960 | $1,400 | $1.46 | 21d | 1 | 0.38mi |
| 613 13th St Unit 1 Niagara Falls, NY | 2.0 | 1.0 | 750 | $1,100 | $1.47 | 17d | 1 | 0.52mi |
| 1817 Ontario Ave Unit 1 Niagara Falls, NY | 2.0 | 1.0 | 999 | $1,899 | $1.90 | 1d | 1 | 0.58mi |
| 1817 Ontario Ave Unit 2 Niagara Falls, NY | 2.0 | 1.0 | 985 | $1,899 | $1.93 | 1d | 1 | 0.58mi |
| 2473 Pierce Ave Unit 2 Niagara Falls, NY | 2.0 | 1.0 | 1000 | $1,200 | $1.20 | 3d | 1 | 0.67mi |
| 2463 South Ave Niagara Falls, NY | 2.0 | 1.0 | 1008 | $1,100 | $1.09 | 17d | 1 | 0.74mi |
| 616 7th St Niagara Falls, NY | 2.0 | 1.0 | 770 | $1,150 | $1.49 | 23d | 1 | 0.75mi |
| 1427 Fort Ave Unit 2 Niagara Falls, NY | 3.0 | 1.0 | 1058 | $950 | $0.90 | 43d | 1 | 0.78mi |
| 420 18th St Unit Upper Niagara Falls, NY | 2.0 | 1.0 | 816 | $1,150 | $1.41 | 43d | 1 | 0.83mi |
| 434 23rd St Unit Upper Niagara Falls, NY | 2.0 | 1.0 | 816 | $1,100 | $1.35 | 14d | 1 | 0.92mi |
| 2814 10th St Niagara Falls, NY | 2.0 | 1.0 | 900 | $900 | $1.00 | 1d | 1 | 0.97mi |
| 1780 Falls St Niagara Falls, NY | 2.0 | 1.0 | 1100 | $1,200 | $1.09 | 43d | 1 | 0.97mi |
| 420 25th St Niagara Falls, NY | 3.0 | 1.0 | 1101 | $1,500 | $1.36 | 43d | 1 | 1.03mi |
| 2727 Monroe Ave Niagara Falls, NY | 3.0 | 1.0 | 960 | $1,500 | $1.56 | 10d | 1 | 1.15mi |
| 3036 Welch Ave Niagara Falls, NY | 3.0 | 1.0 | 1000 | $1,500 | $1.50 | 1d | 1 | 1.37mi |
| 3626 Dudley Ave Niagara Falls, NY | 2.0 | 1.0 | 700 | $1,250 | $1.79 | 43d | 1 | 1.47mi |
Listing history 18 events
-
2026-06-19price $73,000 Active 64 DOM
-
2026-06-18days on market $75,000 Active 64 DOM
-
2026-06-17days on market $75,000 Active 63 DOM
-
2026-06-16days on market $75,000 Active 62 DOM
-
2026-06-15days on market $75,000 Active 61 DOM
-
2026-06-13days on market $75,000 Active 59 DOM
-
2026-06-13days on market $75,000 Active 58 DOM
-
2026-06-10days on market $75,000 Active 56 DOM
-
2026-06-09days on market $75,000 Active 55 DOM
-
2026-06-08days on market $75,000 Active 54 DOM
-
2026-06-07days on market $75,000 Active 53 DOM
-
2026-06-03days on market $75,000 Active 49 DOM
-
2026-06-02days on market $75,000 Active 48 DOM
-
2026-06-01days on market $75,000 Active 47 DOM
-
2026-05-31days on market $75,000 Active 46 DOM
-
2026-05-09price $75,000 799-char remark
Show marketing remark (799 chars)
MOVE-IN READY INVESTMENT NOW ONLY $75,000!!—just add appliances!! Charming 3-bedroom ranch featuring a fully fenced yard, vinyl siding, and a 2-car blacktop driveway. Inside you'll find a spacious living room and a large eat-in kitchen with new countertops, new flooring, pantry storage, with gas or electric hookups for a stove. The home has been freshly painted throughout and includes a large walk-in closet, a walk-through bedroom, and a convenient mudroom entryway. The dry basement offers glass block windows, washer and dryer hookups, and an additional working toilet for added convenience. A large attic with pull-down stairs provides excellent storage space. Roof is approximately 15 years old and some newer windows. GREAT opportunity for first-time buyers, downsizers, or investors.
-
2026-04-15$85,000 Active 799-char remark
Show marketing remark (799 chars)
MOVE-IN READY INVESTMENT NOW ONLY $75,000!!—just add appliances!! Charming 3-bedroom ranch featuring a fully fenced yard, vinyl siding, and a 2-car blacktop driveway. Inside you'll find a spacious living room and a large eat-in kitchen with new countertops, new flooring, pantry storage, with gas or electric hookups for a stove. The home has been freshly painted throughout and includes a large walk-in closet, a walk-through bedroom, and a convenient mudroom entryway. The dry basement offers glass block windows, washer and dryer hookups, and an additional working toilet for added convenience. A large attic with pull-down stairs provides excellent storage space. Roof is approximately 15 years old and some newer windows. GREAT opportunity for first-time buyers, downsizers, or investors.
-
2003-10-01soldstatus $11,000
ⓘ Source: listings_history table (triggers on properties + properties_extension) + one-shot
backfill from property_details.listing_events for pre-trigger history.
Tax reassessment forecast NY · Partial reset (capped growth)
- Current annual tax
- $912 · $76/mo
- Projected year-2 tax
- $1,073 · $89/mo
- Expected delta
- +$161/yr (+$13/mo · 17.7%)
ⓘ Screening estimate from a state-policy table — verify with the county assessor before closing.
Climate risk First Street
- Flood 1/10 Low FEMA zone X (unshaded) · 0% chance over 30 yrs
- Wildfire 1/10 Low
- Heat 2/10 Low 7 d/yr ≥94°F today · 15 d/yr by 30 yrs out
- Wind 1/10 Low
- Air quality 3/10 Moderate 2 unhealthy d/yr today · 3 by 30 yrs out
Nearby sold comps map
Loading sold comps map…
Walkable amenities ~0.75 mi
Loading nearby amenities…
Taxation est. · year 1
- Rental income
- $15,601
- − Mortgage interest
- −$4,089
- − Property taxes
- −$912
- − Insurance
- −$365
- − Repairs & maintenance
- −$1,248
- − Management
- −$1,248
- − Depreciation
- −$2,124
- Taxable income
- $5,615
- Est. tax owed @ 24.0%
- −$1,348
- After-tax cash flow
- $5,106/yr
For passive investors: Depreciation is non-cash, so a rental often shows a tax loss while cash-flowing — sheltering income. Rental losses are passive: they offset passive income freely, and up to $25,000/yr can offset ordinary (W-2) income if you actively participate and your MAGI is under $100k (phasing out to $0 by $150k); unused losses carry forward. On sale, claimed depreciation is recaptured at up to 25%, and gains may owe capital-gains tax (a 1031 exchange can defer both). Figures are a year-1 estimate at your 24.0% rate — not tax advice; consult a CPA.
Schools (NCES district)
- District
- Niagara Falls City School District
- NCES district ID
- 3620820
- Math proficiency
- 26% ▼ -10.00%
- Reading proficiency
- 34% ▲ 3.00%
- Median HH income
- $32,488
- Composite
- 24.5/100
- National rank
- #7655
- State rank
- #578 of 590 in NY
Livability — Niagara Falls
- Score
- 60/100
- State rank
- #956
- US rank
- #18749
Category grades
Schools grade is shown separately in the Schools card above.
Census & demographics
- Census place
- Niagara Falls, NY
- County
- Niagara County · 157,377 people
- City population
- 62,983
- Metro
- Buffalo-Cheektowaga, NY
- Population (ZIP)
- 10,923
- Household income
- $34,549
- Rent vs Own
- Severe rent burden
- 954.0
Population outlook (Niagara County) Hauer SSP2
- Today (2025)
- 204,149 people
- By 2030
- 197,900 · -3.1%
- By 2040
- 182,239 · -10.7%
- By 2050
- 165,198 · -19.1%
- By 2075
- 129,416 · -36.6%
- By 2100
- 96,222 · -52.9%
Race, ethnicity, and origin ACS 2023
- Neighborhood character
- Diverse neighborhood (Simpson 0.58)
- Race & ethnicity
- White 59% Black 25% Two or more races 8% Hispanic / Latino 8% Asian 2%
- Hispanic origin (detail)
- Puerto Rican 3% Cuban 2%
- Common ancestry
- Romanian 6% Slovak 2% Lithuanian 1%
- Foreign-born
- 5% · Canada, China, Dominican Republic
- Languages at home
- 90% English-only · Spanish 6% Other Indo-European 3% Chinese 1%
Political lean MEDSL · Niagara
- 2024 margin
- R (+14.9) · D 42.5% · R 57.5%
- 2008→2024 swing
- -15.9pp toward R · 2008: 1.0pp · 2024: -14.9pp
- All cycles
- 2024: R+14.9 2020: R+9.7 2016: R+19.0 2012: D+0.6 2008: D+1.0
Not yet ingested
- Civics
- —
Market trends
- HPI YoY
- ▲ 15.41%
- Current HPI
- 266.1457
- Rent YoY
- ▲ 8.79%
- Metro
- Buffalo-Cheektowaga, NY
- State GDP YoY
- ▲ 2.60%
- F500 in state
- 92
Industry mix (Fortune 500 HQ in NY)
| Industry | F500 HQs | Revenue |
|---|---|---|
| Financial Services | 10 | $950B |
|
||
| Consumer Goods | 9 | $162B |
|
||
| Insurance | 4 | $225B |
|
||
| Telecommunications | 2 | $144B |
|
||
| Pharmaceuticals | 2 | $112B |
|
||
| Media / Entertainment | 2 | $69B |
|
||
Price history
+581.8% since first listed3 events — show timeline
- 2026-05-09 Price Changed $75,000 WNYREIS
- 2026-04-15 Listed $85,000 WNYREIS
- 2003-10-01 Sold (Public Records) $11,000 Public Records
Property tax history
+3.7%/yrLatest (2025): $912 · +42.3% YoY. Source: county tax records.
Cash-flow waterfall
monthlySold comps — $/sqft
last 12 mo · ≤1 miLoading sold comps…