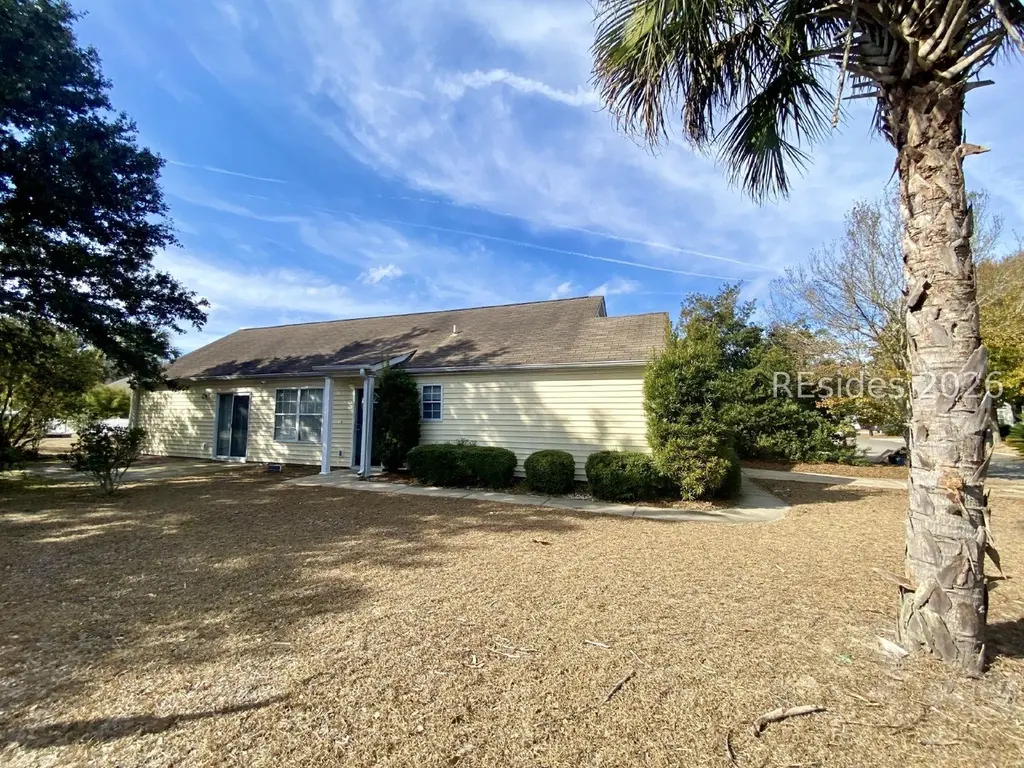
128 Stoney Xing · Bluffton, SC
Flood risk 1/10 · Minimal
- FEMA flood zone
- X (unshaded)
- Chance of flooding over 30 yrs
- 0.0%
- Est. flood insurance / yr
- $507 – $1,088
Fire risk 4/10 · Minor
- Est. fire insurance / yr
- $783 – $1,453
Heat risk 10/10 · Severe
- Hot days now (above 107°F)
- 7 days/yr
- Hot days in 30 yrs
- 19 days/yr
Wind risk 9/10 · Severe
- Chance of severe wind over 30 yrs
- 99.0%
Air-quality risk 3/10 · Minor
- Unhealthy air days now
- 4 days/yr
- Unhealthy air days in 30 yrs
- 4 days/yr
Risk factors via First Street. Map © Google.
Why this score? — see what drove the F grade
The composite is a weighted blend of 9 inputs, each scored 0–100. Each bar is that input's sub-score; the figure is the points it added to the 100-point composite (weight × sub-score).
- ARV discount +8.3/15.0
- Cash flow +6.4/30.0
- Schools +4.1/10.0
- Rent growth +3.5/5.0
- Livability +3.4/5.0
- Condition / age +2.5/5.0
- 1% rule +0.7/10.0
- DSCR +0.7/10.0
- Appreciation +0.0/10.0
$325,000
🖨 Deal sheet 📄 Offer letter ✓ Due diligence
Listing remarks
GREAT IΝVEЅTΜΕNT PRΟΡERTY, WITH RENTER ΙΝ PLACE WHO WILL STAY OR GO AT THE END OF THE RENTAL PERIOD AUGUST 31,2026, is the lowest priced home in the community. Located in the heart of Bluffton, this 3 bedroom, 2 bath home is perfect too if you're just getting started or thinking about retiring. The roof is being replaced and a new stove is already in place. .There is a fenced backyard and it is near the community pool and playground. . It's a great place to live!
Key facts
- New stove
- Community pool
- Fenced backyard
Tags
Property features AI
Finance
- Other: Pets allowed
- HOA & community: Community playground; Community pool
Exterior
- Parking: 1-car garage
- Security: Fire alarm; Smoke detector(s)
- Utilities: Public water
- Home design: Single-story; Faces northwest; Vinyl siding construction; Asphalt roof
- Construction: Vinyl siding; Asphalt roof; Built as a one-story structure
- Exterior features: Fence / yard fenced; Paved driveway; Patio; Front porch; Community pool
Interior
- Kitchen: Dishwasher; Disposal; Refrigerator; Self-cleaning oven
- Bedrooms: Main level primary(s)
- Flooring: Engineered hardwood
- Bathrooms: 2 full bathrooms
- Heating & cooling: Central heating; Heat pump heating; Central air conditioning; Heat pump cooling
- Interior features: Insulated windows; Attic; Ceiling fan(s); Main level primary; Multiple primary suites; Unfinished walls; Unfurnished
Neighborhood map
What this means for you Summary
Snapshot
- This is a 1-bed/2.0-bath single-family listed at $325k.
Deal economics
- At list price, monthly cash flow is $-568 ($-7k/yr) — negative.
- To cash-flow at today's rent, offer at most $225k (30.9% below list).
- To meet the 1% rule (rent ≥ 1% of price), the offer needs to be $186k (42.8% below list).
- Recommended offer: $186k (42.8% below list) — sets the bar for 1% rule.
- Cap rate 4.2% vs local median 3.2% in Bluffton — meaningfully above typical; check what's discounted (condition, days-on-market, listing class) to confirm the premium yield is real.
Location & tenants
- Location reads 68/100 on livability (#76 in SC) — a middle-class / working-renter tenant base. Strengths: crime A+, employment A+, housing A+; Watch: amenities F, commute F, cost of living D-.
- Beaufort 01 (town): math 42% / reading 51% proficiency, ranked #17 of 80 in SC (top 21%) — families likely to look elsewhere, expect single-tenant / working-renter base with shorter leases.
- Market conditions: Rents rising fast (+4.1%/yr); 760 active listings in the ZIP; 2 comparable units currently listed for rent nearby; solid renter incomes; 1,824 units permitted in Beaufort County in 2024 (618 in 5+ unit buildings).
Forward outlook
- Local home prices are declining (-3.0%/yr); year-one equity from $2k of loan paydown is wiped out by about $10k of value loss. Plan a longer hold.
- Beaufort County population projected at +30% by 2050 — long-run rental-demand tailwind backs the buy-and-hold thesis.
Negotiation context
- It's been on market 34 days — a 3% lower offer ($315k) is reasonable based on typical stale-listing flexibility.
- 5 sale attempts since 18y ago with the ask held roughly flat each time — persistent listings suggest the price (not the market) is what's stuck; bring a comps-based counter.
- Current owner paid $115k; list at $325k implies a 183% gain — meaningful room to come down on a strong offer.
Risks & watch-outs
- Climate carrying-cost: severe wind risk, 99% chance of damaging wind over 30y; extreme-heat days projected 7→19/yr by 2055 (HVAC capex compounding) — expect insurance premiums to compound above CPI over the hold.
Questions for the listing agent
- What do current leases actually rent for vs. the listed asking? Can we see a recent rent roll and the last 12 months of T-12 income?
- It's been on market 34 days. Have you received any prior offers? Is the seller open to a 43% concession, seller financing, or rate buy-down credit?
- Is there a deadline driving the sale (1031 exchange, divorce, estate, relocation)? That informs how much negotiation room exists.
- Schools are B-rated — typically a magnet for longer-tenancy family renters. What's the average tenant stay here, and is there a school-zone premium baked into asking?
- The area grade is low — what's the realistic commute time and amenity access for the typical tenant pool here? Any planned neighborhood developments (good or bad) we should know about?
- What's the average days-on-market for RENTAL listings here right now (not sales)? A rising rental-DOM trend means longer vacancies and softer asking-rent achievability than the comps imply.
- What's the recent tenant-quality profile in this submarket — average credit score on applications, eviction rate, late-payment / NSF rate, and stable-employment percentage? A property-management company in the area should have these aggregated.
- How much new for-sale + rental construction is in the pipeline within 1–3 miles? Heavy new supply typically softens prices + rents 12–24 months out; constrained supply supports both.
Investment metrics
- 1% rule
- 0.57% ✗
- Cap rate
- 4.19%
- Cash-on-cash
- -7.49%
- DSCR
- 0.67
- GRM
- 14.6
CMA / ARV
- ARV (median comp)
- $330,937
- List price
- $325,000
- Delta
- -1.79%
- Verdict
- FAIR
- Comps
- 20 within 1.0 mi
Projected returns pro-forma
-3.0% appreciation · 4.06% rent growth · sell at horizon
- IRR
- -28.4%
- Equity multiple
- 0.04×
- Total profit
- $-86,952
- Equity at exit
- $48,459
- IRR
- -24.6%
- Equity multiple
- -0.26×
- Total profit
- $-114,327
- Equity at exit
- $28,100
Cash invested: $91,000 (down + closing). Projections, not guarantees.
Landlord ↔ Tenant lean methodology
- Overall (STATE)
- 90 Strongly Landlord-Friendly
- State South Carolina
- 90 Strongly Landlord-Friendly · R+6
- County
- — inherits STATE
- City
- — inherits STATE
ZIP-level market 29910
- Home prices YoY
- -22.9%
- Rents YoY
- 4.1%
- Active inventory
- 760
- Price-to-rent
- 14.6×
Monthly cashflow live
- Estimated rent
- $1,859 medium interval (Pro) →
- Mortgage (P&I)
- −$1,704
- Tax from tax record
- −$197 /mo · $2,362/yr
- Insurance
- −$135
- HOA
- −$0
- Vacancy / Maint / Mgmt
- −$390
- Net cashflow
- $-568
Break-even live
UW: 25.0% down · 7.5% · 30yr · 1.5% tax · 5.0% vac · 8.0% maint · 8.0% mgmt
Financing live
Cash to close
- Down payment
- $81,250
- Closing costs
- $9,750
- Reserves months
- —
- Total cash needed
- —
Loan-product check · same deal, 3 products live
Conventional
25% down · 7.5% · 30yr
- Down + closing
- —
- Monthly P&I
- —
- Monthly cashflow
- —
- DSCR
- —
- Eligible?
- —
Personal DTI + credit; lowest rate.
DSCR
20% down · 8.5% · 30yr
- Down + closing
- —
- Monthly P&I
- —
- Monthly cashflow
- —
- DSCR
- —
- Eligible?
- —
No personal income docs; deal must DSCR.
Hard money
10% down · 12.0% · 12mo
- Down + closing
- —
- Monthly P&I
- —
- Monthly cashflow
- —
- DSCR
- —
- Eligible?
- —
Short-term bridge; refi at stabilization.
Rent comps 2 comps
| Address | Beds | Baths | Sqft | Rent | $/sqft | DOM | Units | Dist |
|---|---|---|---|---|---|---|---|---|
| 103 Inspiration Ave Bluffton, SC | 2.0 | 1.0–2.0 | 811 | $1,914 | $2.36 | 13d | 3 | 0.66mi |
| 11 Parklands Dr Bluffton, SC | 1.0–3.0 | 1.0–2.0 | 1088 | $1,891 | $1.74 | 13d | 33 | 1.23mi |
Listing history 25 events
-
2026-06-18days on market $325,000 Active 34 DOM
-
2026-06-17days on market $325,000 Active 33 DOM
-
2026-06-16days on market $325,000 Active 32 DOM
-
2026-06-15days on market $325,000 Active 31 DOM
-
2026-06-14days on market $325,000 Active 29 DOM
-
2026-06-13days on market $325,000 Active 28 DOM
-
2026-06-10days on market $325,000 Active 26 DOM
-
2026-06-09days on market $325,000 Active 25 DOM
-
2026-06-08days on market $325,000 Active 24 DOM
-
2026-06-07days on market $325,000 Active 23 DOM
-
2026-06-05days on market $325,000 Active 20 DOM
-
2026-06-03days on market $325,000 Active 19 DOM
-
2026-06-02days on market $325,000 Active 18 DOM
-
2026-06-01days on market $325,000 Active 17 DOM
-
2026-05-31days on market $325,000 Active 16 DOM
-
2026-05-30days on market $325,000 Active 15 DOM
-
2026-05-15$325,000 Active 282-char remark
-
2026-01-20$310,000 Active
-
2023-07-31historical
-
2023-07-23
-
2014-10-29soldstatus $115,000
-
2011-07-27$112,000
-
2008-10-22soldstatus $151,000
-
2008-10-17soldstatus $151,000
-
2008-03-01$154,900
ⓘ Source: listings_history table (triggers on properties + properties_extension) + one-shot
backfill from property_details.listing_events for pre-trigger history.
Tax reassessment forecast SC · Resets to sale price
- Current annual tax
- $2,362 · $197/mo
- Projected year-2 tax
- $2,362 · $197/mo
- Expected delta
- $0/yr ($0/mo · 0.0%)
ⓘ Screening estimate from a state-policy table — verify with the county assessor before closing.
Climate risk First Street
- Flood 1/10 Low FEMA zone X (unshaded) · 0% chance over 30 yrs
- Wildfire 4/10 Moderate
- Heat 10/10 Extreme 7 d/yr ≥107°F today · 19 d/yr by 30 yrs out
- Wind 9/10 Extreme 99% chance of damaging wind over 30 yrs
- Air quality 3/10 Moderate 4 unhealthy d/yr today · 4 by 30 yrs out
Nearby sold comps map
Loading sold comps map…
Walkable amenities ~0.75 mi
Loading nearby amenities…
Taxation est. · year 1
- Rental income
- $22,305
- − Mortgage interest
- −$18,205
- − Property taxes
- −$2,362
- − Insurance
- −$1,625
- − Repairs & maintenance
- −$1,784
- − Management
- −$1,784
- − Depreciation
- −$9,455
- Taxable loss
- −$12,911
- Est. tax savings @ 24.0%
- +$3,099
- After-tax cash flow
- $-3,720/yr
For passive investors: Depreciation is non-cash, so a rental often shows a tax loss while cash-flowing — sheltering income. Rental losses are passive: they offset passive income freely, and up to $25,000/yr can offset ordinary (W-2) income if you actively participate and your MAGI is under $100k (phasing out to $0 by $150k); unused losses carry forward. On sale, claimed depreciation is recaptured at up to 25%, and gains may owe capital-gains tax (a 1031 exchange can defer both). Figures are a year-1 estimate at your 24.0% rate — not tax advice; consult a CPA.
Schools (NCES district)
- District
- Beaufort 01
- NCES district ID
- 4501110
- Math proficiency
- 42% ▼ -8.00%
- Reading proficiency
- 51% ▲ 2.00%
- Median HH income
- $57,430
- Composite
- 40.56/100
- National rank
- #3699
- State rank
- #17 of 80 in SC
Livability — Bluffton
- Score
- 68/100
- State rank
- #76
- US rank
- #8936
Category grades
Schools grade is shown separately in the Schools card above.
Census & demographics
- County
- Beaufort County · 163,770 people
- City population
- 77,022
- Metro
- Hilton Head Island-Bluffton, SC
- Population (ZIP)
- 53,019
- Household income
- $98,912
- Rent vs Own
- Severe rent burden
- 1146.0
Population outlook (Beaufort County) Hauer SSP2
- Today (2025)
- 211,915 people
- By 2030
- 227,272 · +7.2%
- By 2040
- 253,861 · +19.8%
- By 2050
- 275,126 · +29.8%
- By 2075
- 311,022 · +46.8%
- By 2100
- 321,286 · +51.6%
Race, ethnicity, and origin ACS 2023
- Neighborhood character
- Predominantly White (70%)
- Race & ethnicity
- White 70% Hispanic / Latino 18% Two or more races 8% Black 7%
- Hispanic origin (detail)
- Mexican 7% Puerto Rican 3%
- Common ancestry
- Romanian 4% Slovak 3% Lithuanian 3%
- Foreign-born
- 9% · Canada, Jamaica, Dominican Republic
- Languages at home
- 84% English-only · Spanish 13% Other Indo-European 1% French/Haitian/Cajun 1%
Political lean MEDSL · Beaufort
- 2024 margin
- R (+14.5) · D 42.1% · R 56.6% · Other 1.2%
- 2008→2024 swing
- -3.7pp toward R · 2008: -10.8pp · 2024: -14.5pp
- All cycles
- 2024: R+14.5 2020: R+10.0 2016: R+14.3 2012: R+17.5 2008: R+10.8
Not yet ingested
- Civics
- —
Market trends
- HPI YoY
- ▼ -72.80%
- Current HPI
- 245.8086
- Rent YoY
- ▲ 4.06%
- Metro
- Hilton Head Island-Bluffton, SC
- State GDP YoY
- ▲ 4.51%
- F500 in state
- 2
Industry mix (Fortune 500 HQ in SC)
| Industry | F500 HQs | Revenue |
|---|---|---|
| Packaging | 1 | $7B |
|
||
Price history
+109.8% since first listed9 events — show timeline
- 2026-05-15 Listed $325,000 RSMLS
- 2026-01-20 Listed $310,000 RSMLS
- 2023-07-31 Rental Removed — APPFOLIO
- 2023-07-23 Listed for Rent — APPFOLIO
- 2014-10-29 Sold (Public Records) $115,000 Public Records
- 2011-07-27 Listed $112,000 RSMLS
- 2008-10-22 Sold (Public Records) $151,000 Public Records
- 2008-10-17 Sold (MLS) $151,000 RSMLS
- 2008-03-01 Listed $154,900 RSMLS
Property tax history
+7.0%/yrLatest (2025): $2,362 · +1.6% YoY. Source: county tax records.
Cash-flow waterfall
monthlySold comps — $/sqft
last 12 mo · ≤1 miLoading sold comps…