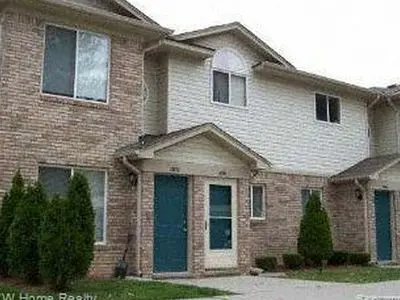
30176 Wedgewood Crk · Roseville, MI
Flood risk 4/10 · Minor
- FEMA flood zone
- X (unshaded)
- Chance of flooding over 30 yrs
- 0.2%
- Est. flood insurance / yr
- $507 – $1,088
Fire risk 1/10 · Minimal
- Est. fire insurance / yr
- $784 – $1,456
Heat risk 3/10 · Minor
- Hot days now (above 96°F)
- 7 days/yr
- Hot days in 30 yrs
- 15 days/yr
Wind risk 1/10 · Minimal
- Chance of severe wind over 30 yrs
- —
Air-quality risk 4/10 · Minor
- Unhealthy air days now
- 4 days/yr
- Unhealthy air days in 30 yrs
- 5 days/yr
Risk factors via First Street. Map © Google.
Why this score? — see what drove the D grade
The composite is a weighted blend of 9 inputs, each scored 0–100. Each bar is that input's sub-score; the figure is the points it added to the 100-point composite (weight × sub-score).
- Cash flow +14.9/30.0
- ARV discount +7.5/15.0
- 1% rule +5.4/10.0
- DSCR +4.6/10.0
- Livability +3.6/5.0
- Rent growth +2.6/5.0
- Condition / age +2.2/5.0
- Schools +1.5/10.0
- Appreciation +0.0/10.0
$125,000
🖨 Deal sheet 📄 Offer letter ✓ Due diligence
Listing remarks
30176 wedgewood circle is located in Macomb County with nearby schools including Fountain Elementary School, Lucile S. Patton Elementary School, and Eastland Middle School.
Key facts
- Built 2003
- Listed 37 days
Neighborhood map
What this means for you Summary
Snapshot
- This is a 2-bed/1.0-bath condo listed at $125k. Condition is rated fair.
Deal economics
- At list price, monthly cash flow is $38 ($453/yr) — positive.
- The deal already cash-flows at list — no discount required.
- Meets the 1% rule at list price ($1k rent vs $125k).
- Recommended offer: $121k (3.0% below list) — sets the bar for market timing.
Location & tenants
- Location reads 72/100 on livability (#258 in MI) — a middle-class / working-renter tenant base. Strengths: commute A+, cost of living A+, housing A+; Watch: health & safety D+, employment D, schools F.
- Roseville Community Schools (suburban): math 11% / reading 24% proficiency, ranked #483 of 540 in MI (top 89%) — low school quality limits family demand, transient renter base, plan for 1-2y turnover; 60% free/reduced lunch — lower-income household profile, screen leases tightly.
- Market conditions: Rents flat; 265 active listings in the ZIP; 38 comparable units currently listed for rent nearby; rentals at typical pace (median 17d on market — plan ~3-4 weeks tenant-placement turnaround); 1,321 units permitted in Macomb County in 2024 (86 in 5+ unit buildings).
Forward outlook
- Local home prices are declining (-3.0%/yr); year-one equity from $864 of loan paydown is wiped out by about $4k of value loss. Plan a longer hold.
- Macomb County population projected at +9% by 2050 — modest demand growth; plan on rents tracking national, not racing it.
Negotiation context
- It's been on market 37 days — a 3% lower offer ($121k) is reasonable based on typical stale-listing flexibility.
- 8 sale attempts since 22y ago with the ask held roughly flat each time — persistent listings suggest the price (not the market) is what's stuck; bring a comps-based counter.
- Current owner paid $96k; 30% above their basis — modest negotiation headroom, anchor on the comps not their cost.
Questions for the listing agent
- It's been on market 37 days. Have you received any prior offers? Is the seller open to a 3% concession, seller financing, or rate buy-down credit?
- Have any recent inspections been done? Can we get a copy of the seller's disclosures and any deferred-maintenance estimates?
- What does the HOA fee cover, when was the last increase, and are there any pending special assessments or reserve-fund shortfalls?
- Any open or pending special assessments — roof, HVAC, plumbing, elevator, façade? What's the per-unit balance and payoff schedule, and is the seller paying it off at close or rolling it to the buyer?
- Is there a deadline driving the sale (1031 exchange, divorce, estate, relocation)? That informs how much negotiation room exists.
- Schools are F-rated, which usually means shorter tenancies and higher turnover. Who's the typical renter profile here, and what's been the actual vacancy rate?
- Crime grade is F in this area — have there been break-ins, vandalism, or insurance claims at this property in the last 3 years? What carrier currently insures it and at what premium?
- The area grade is low — what's the realistic commute time and amenity access for the typical tenant pool here? Any planned neighborhood developments (good or bad) we should know about?
- What's the average days-on-market for RENTAL listings here right now (not sales)? A rising rental-DOM trend means longer vacancies and softer asking-rent achievability than the comps imply.
- What's the recent tenant-quality profile in this submarket — average credit score on applications, eviction rate, late-payment / NSF rate, and stable-employment percentage? A property-management company in the area should have these aggregated.
- How much new apartment / multifamily construction is in the pipeline within 1–3 miles? Heavy new supply (>2% of stock underway) typically softens rents 12–24 months out; light construction supports rent growth.
Investment metrics
- 1% rule
- 1.04% ✓
- Cap rate
- 6.66%
- Cash-on-cash
- 1.29%
- DSCR
- 1.06
- GRM
- 8.0
CMA / ARV
No comps found within radius.
Projected returns pro-forma
-3.0% appreciation · 0.39% rent growth · sell at horizon
- IRR
- -17.6%
- Equity multiple
- 0.40×
- Total profit
- $-21,091
- Equity at exit
- $18,638
- IRR
- -16.5%
- Equity multiple
- 0.20×
- Total profit
- $-27,870
- Equity at exit
- $10,808
Cash invested: $35,000 (down + closing). Projections, not guarantees.
Landlord ↔ Tenant lean methodology
- Overall (STATE)
- 62 Landlord-Friendly
- State Michigan
- 62 Landlord-Friendly · EVEN
- County
- — inherits STATE
- City
- — inherits STATE
ZIP-level market 48066
- Rents YoY
- 0.4%
- Active inventory
- 265
- Price-to-rent
- 8.0×
Monthly cashflow live
- Estimated rent
- $1,305 high interval (Pro) →
- Mortgage (P&I)
- −$656
- Tax est. 1.5%
- −$156 /mo · $1,875/yr
- Insurance
- −$52
- HOA est. from 1 same-building comp
- −$129
- Vacancy / Maint / Mgmt
- −$274
- Net cashflow
- $38
Break-even live
UW: 25.0% down · 7.5% · 30yr · 1.5% tax · 5.0% vac · 8.0% maint · 8.0% mgmt
Financing live
Cash to close
- Down payment
- $31,250
- Closing costs
- $3,750
- Reserves months
- —
- Total cash needed
- —
Loan-product check · same deal, 3 products live
Conventional
25% down · 7.5% · 30yr
- Down + closing
- —
- Monthly P&I
- —
- Monthly cashflow
- —
- DSCR
- —
- Eligible?
- —
Personal DTI + credit; lowest rate.
DSCR
20% down · 8.5% · 30yr
- Down + closing
- —
- Monthly P&I
- —
- Monthly cashflow
- —
- DSCR
- —
- Eligible?
- —
No personal income docs; deal must DSCR.
Hard money
10% down · 12.0% · 12mo
- Down + closing
- —
- Monthly P&I
- —
- Monthly cashflow
- —
- DSCR
- —
- Eligible?
- —
Short-term bridge; refi at stabilization.
Rent comps 38 comps
| Address | Beds | Baths | Sqft | Rent | $/sqft | DOM | Units | Dist |
|---|---|---|---|---|---|---|---|---|
| 30512 Oakridge Manor Dr Roseville, MI | 2.0 | 1.5 | 1002 | $1,350 | $1.35 | 24d | 1 | 0.19mi |
| 17134 E Thirteen Mile Rd Roseville, MI | 1.0–2.0 | 1.0 | 825 | $1,269 | $1.54 | 1d | 16 | 0.37mi |
| 30583 Hidden Pines Ln Roseville, MI | 2.0 | 2.0 | 1100 | $1,250 | $1.14 | 16d | 1 | 0.39mi |
| 19040 E 13 Mile Rd Roseville, MI | 3.0 | 1.0 | 1008 | $1,550 | $1.54 | 1d | 1 | 0.75mi |
| 28744 Maple St Roseville, MI | 3.0 | 1.0 | 1050 | $1,295 | $1.23 | 43d | 1 | 0.79mi |
| 16651 Twelve Mile Rd Roseville, MI | 2.0–3.0 | 1.5 | 957 | $1,325 | $1.38 | 1d | 1 | 0.87mi |
| 31577 Fraser Dr #3 Fraser, MI | 2.0 | 1.0 | 950 | $1,250 | $1.32 | 43d | 1 | 0.89mi |
| 18391 Masonic Apt 1 Fraser, MI | 2.0 | 1.0 | 720 | $995 | $1.38 | 16d | 1 | 0.93mi |
| 16577 12 Mile Rd Roseville, MI | 2.0 | 1.0 | 850 | $1,275 | $1.50 | 43d | 1 | 0.96mi |
| 16579 12 Mile Rd Unit 16579 Roseville, MI | 2.0 | 1.0 | 850 | $1,275 | $1.50 | 43d | 1 | 0.97mi |
| 28368 Rosemont St Roseville, MI | 2.0 | 1.0 | 696 | $1,500 | $2.16 | 21d | 1 | 0.97mi |
| 16435 Twelve Mile Rd Roseville, MI | 1.0 | 1.0 | 600 | $950 | $1.58 | 43d | 1 | 1.01mi |
| 16425 12 Mile Rd Roseville, MI | 1.0 | 1.0 | 600 | $950 | $1.58 | 43d | 1 | 1.01mi |
| 16425 12 Mile Rd Roseville, MI | 2.0 | 1.0 | 800 | $1,100 | $1.38 | 21d | 1 | 1.01mi |
| 16951 General Ave Fraser, MI | 2.0 | 1.0 | 900 | $1,250 | $1.39 | 5d | 1 | 1.15mi |
| 30541 Bluehill St Roseville, MI | 3.0 | 1.5 | 989 | $1,850 | $1.87 | 43d | 1 | 1.23mi |
| 27850 Gratiot Ave Unit 1032354P Roseville, MI | 1.0 | 1.0 | 742 | $3,590 | $4.84 | 1d | 1 | 1.25mi |
| 18377 Sharon Ln Unit 1032361P Roseville, MI | 1.0 | 1.0 | 742 | $4,242 | $5.72 | 43d | 1 | 1.26mi |
| 18377 Sharon Ln Unit 1032363P Roseville, MI | 1.0 | 1.0 | 742 | $4,015 | $5.41 | 14d | 1 | 1.26mi |
| 17405 Ivanhoe St Roseville, MI | 3.0 | 1.0 | 969 | $1,600 | $1.65 | 43d | 1 | 1.26mi |
| 18389 Sharon Ln Unit 1032350P Roseville, MI | 1.0 | 1.0 | 742 | $3,470 | $4.68 | 16d | 1 | 1.26mi |
| 18365 Sharon Ln Unit 1032367P Roseville, MI | 1.0 | 1.0 | 796 | $3,573 | $4.49 | 14d | 1 | 1.26mi |
| 18423 Sharon Ln Unit 1032353P Roseville, MI | 1.0 | 1.0 | 742 | $3,458 | $4.66 | 14d | 1 | 1.26mi |
| 18423 Sharon Ln Unit 1032349P Roseville, MI | 1.0 | 1.0 | 742 | $3,210 | $4.33 | 1d | 1 | 1.27mi |
| 18431 Sharon Ln Unit 1032346P Roseville, MI | 1.0 | 1.0 | 742 | $3,695 | $4.98 | 14d | 1 | 1.27mi |
| 18451 Sharon Ln Unit 1032334P Roseville, MI | 1.0 | 1.0 | 742 | $3,932 | $5.30 | 14d | 1 | 1.27mi |
| 18443 Sharon Ln Unit 1032345P Roseville, MI | 1.0 | 1.0 | 742 | $3,286 | $4.43 | 1d | 1 | 1.27mi |
| 18447 Sharon Ln Unit 1032337P Roseville, MI | 1.0 | 1.0 | 742 | $3,468 | $4.67 | 16d | 1 | 1.27mi |
| 18459 Sharon Ln Unit 1032344P Roseville, MI | 1.0 | 1.0 | 742 | $3,035 | $4.09 | 12d | 1 | 1.27mi |
| 18355 Mesle St Unit 1032347P Roseville, MI | 1.0 | 1.0 | 742 | $3,878 | $5.23 | 12d | 1 | 1.29mi |
| 18308 Mesle St Unit 1032362P Roseville, MI | 1.0 | 1.0 | 742 | $3,072 | $4.14 | 5d | 1 | 1.31mi |
| 18340 Mesle St Unit 1032351P Roseville, MI | 1.0 | 1.0 | 742 | $3,167 | $4.27 | 10d | 1 | 1.31mi |
| 17392 Tennyson St Roseville, MI | 3.0 | 1.0 | 900 | $1,649 | $1.83 | 2d | 1 | 1.34mi |
| 19700 Masonic Roseville, MI | 1.0–2.0 | 1.0 | 874 | $1,400 | $1.60 | 1d | 12 | 1.38mi |
| 18635 Meier St Unit : Back Roseville, MI | 2.0 | 1.0 | 900 | $1,100 | $1.22 | 24d | 1 | 1.40mi |
| 18600 14 Mile Rd Fraser, MI | 2.0 | 1.0 | 1070 | $1,195 | $1.12 | 24d | 1 | 1.42mi |
| 27415 Gratiot Ave Unit 1 Roseville, MI | 1.0 | 1.0 | 1050 | $1,250 | $1.19 | 18d | 1 | 1.43mi |
| 32870 Kelly Rd Roseville, MI | 1.0 | 1.0 | 800 | $965 | $1.21 | 16d | 1 | 1.46mi |
HOA detail condo
- Monthly dues
- $0 · $0/yr
- Assessments
- None detected in remarks — confirm with the listing agent.
Listing history 29 events
-
2026-06-18days on market $125,000 Active 37 DOM
-
2026-06-17pricedays on market $125,000 Active 36 DOM
-
2026-06-16days on market $130,000 Active 35 DOM
-
2026-06-15days on market $130,000 Active 34 DOM
-
2026-06-13days on market $130,000 Active 32 DOM
-
2026-06-09days on market $130,000 Active 28 DOM
-
2026-06-08days on market $130,000 Active 27 DOM
-
2026-06-07days on market $130,000 Active 26 DOM
-
2026-06-04days on market $130,000 Active 23 DOM
-
2026-06-03days on market $130,000 Active 22 DOM
-
2026-06-02days on market $130,000 Active 21 DOM
-
2026-06-01days on market $130,000 Active 20 DOM
-
2026-05-31days on market $130,000 Active 19 DOM
-
2026-05-12$130,000 Active 172-char remark
-
2008-07-31historical
-
2008-02-27$76,900
-
2008-02-27historical
-
2007-10-04$79,900
-
2007-09-22historical
-
2007-07-31$83,000
-
2007-07-31historical
-
2007-06-14$83,000
-
2007-06-14historical
-
2007-01-30$83,000
-
2007-01-30historical
-
2006-12-01$87,000
-
2004-08-13soldstatus $96,000
-
2004-06-11historical
-
2004-03-24$92,900
ⓘ Source: listings_history table (triggers on properties + properties_extension) + one-shot
backfill from property_details.listing_events for pre-trigger history.
Climate risk First Street
- Flood 4/10 Moderate FEMA zone X (unshaded) · 20% chance over 30 yrs
- Wildfire 1/10 Low
- Heat 3/10 Moderate 7 d/yr ≥96°F today · 15 d/yr by 30 yrs out
- Wind 1/10 Low
- Air quality 4/10 Moderate 4 unhealthy d/yr today · 5 by 30 yrs out
Nearby sold comps map
Loading sold comps map…
Walkable amenities ~0.75 mi
Loading nearby amenities…
Taxation est. · year 1
- Rental income
- $15,655
- − Mortgage interest
- −$7,002
- − Property taxes
- −$1,875
- − Insurance
- −$625
- − Repairs & maintenance
- −$1,252
- − Management
- −$1,252
- − HOA
- −$1,548
- − Depreciation
- −$3,636
- Taxable loss
- −$1,536
- Est. tax savings @ 24.0%
- +$369
- After-tax cash flow
- $822/yr
For passive investors: Depreciation is non-cash, so a rental often shows a tax loss while cash-flowing — sheltering income. Rental losses are passive: they offset passive income freely, and up to $25,000/yr can offset ordinary (W-2) income if you actively participate and your MAGI is under $100k (phasing out to $0 by $150k); unused losses carry forward. On sale, claimed depreciation is recaptured at up to 25%, and gains may owe capital-gains tax (a 1031 exchange can defer both). Figures are a year-1 estimate at your 24.0% rate — not tax advice; consult a CPA.
Condition & rehab AI · 1 photo
A fair condition condo with cosmetic updates needed, particularly exterior painting and landscaping, to boost its resale and rental value.
Repairs flagged
- Minor exterior paint — Slight discoloration
- Minor landscaping — Overgrown shrubs
Value-add opportunities
- Both paint exterior — Enhances curb appeal and resale value
- Both prune landscaping — Improves curb appeal and rental appeal
Renovation cost estimate screening
| Repair item | Severity | Est. cost |
|---|---|---|
| exterior paint · Slight discoloration | Minor | $500–3,000 |
| landscaping · Overgrown shrubs | Minor | $500–3,000 |
| Total estimated repair cost · 2 items | $1,000–6,000 |
Value-add ROI direction
- Both paint exterior — Enhances curb appeal and resale value ↑
- Both prune landscaping — Improves curb appeal and rental appeal ↑
ⓘ Cost ranges are severity-bucket heuristics (US national rule-of-thumb). Get contractor quotes + a written scope before underwriting a rehab budget.
Schools (NCES district)
- District
- Roseville Community Schools
- NCES district ID
- 2630210
- Math proficiency
- 11% ▼ -8.00%
- Reading proficiency
- 24% ▼ -7.00%
- Median HH income
- $41,590
- Composite
- 14.98/100
- National rank
- #9363
- State rank
- #483 of 540 in MI
Livability — Roseville
- Score
- 72/100
- State rank
- #258
- US rank
- #6400
Category grades
Schools grade is shown separately in the Schools card above.
Census & demographics
- Census place
- Roseville, MI
- County
- Macomb County · 638,552 people
- City population
- 47,123
- Metro
- Detroit-Warren-Dearborn, MI
- Population (ZIP)
- 47,123
- Household income
- $62,182
- Rent vs Own
- Severe rent burden
- 1712.0
Population outlook (Macomb County) Hauer SSP2
- Today (2025)
- 925,296 people
- By 2030
- 948,226 · +2.5%
- By 2040
- 983,961 · +6.3%
- By 2050
- 1,010,200 · +9.2%
- By 2075
- 1,076,222 · +16.3%
- By 2100
- 1,077,065 · +16.4%
Race, ethnicity, and origin ACS 2023
- Neighborhood character
- Predominantly White (65%)
- Race & ethnicity
- White 65% Black 23% Two or more races 7% Hispanic / Latino 4% Asian 2%
- Common ancestry
- Romanian 12% Lithuanian 4% Slovak 2%
- Foreign-born
- 5% · Canada
- Languages at home
- 93% English-only · Spanish 2% Russian/Polish/Slavic 1% Other Indo-European 1%
Political lean MEDSL · Macomb
- 2024 margin
- R (+13.7) · D 42.2% · R 55.9% · Other 1.9%
- 2008→2024 swing
- -22.3pp toward R · 2008: 8.6pp · 2024: -13.7pp
- All cycles
- 2024: R+13.7 2020: R+8.1 2016: R+11.6 2012: D+4.0 2008: D+8.6
Not yet ingested
- Civics
- —
Market trends
- HPI YoY
- ▼ -232.95%
- Current HPI
- 217.4171
- Rent YoY
- ▲ 0.39%
- Metro
- Detroit-Warren-Dearborn, MI
- State GDP YoY
- ▲ 1.37%
- F500 in state
- 28
Industry mix (Fortune 500 HQ in MI)
| Industry | F500 HQs | Revenue |
|---|---|---|
| Automotive Parts | 3 | $48B |
|
||
| Automotive | 2 | $372B |
|
||
| Chemicals | 1 | $45B |
|
||
| Automotive Retail | 1 | $29B |
|
||
| Healthcare / Medical Devices | 1 | $23B |
|
||
| Automotive Technology | 1 | $20B |
|
||
Price history
+34.6% since first listed17 events — show timeline
- 2026-06-16 Price Changed $125,000 FSBO.com
- 2026-05-12 Listed $130,000 FSBO.com
- 2008-07-31 Listing Removed — MiRealSource-MiMLS
- 2008-02-27 Listing Removed — MiRealSource-MiMLS
- 2008-02-27 Listed $76,900 MiRealSource-MiMLS
- 2007-10-04 Listed $79,900 MiRealSource-MiMLS
- 2007-09-22 Listing Removed — MiRealSource-MiMLS
- 2007-07-31 Listing Removed — MiRealSource-MiMLS
- 2007-07-31 Listed $83,000 MiRealSource-MiMLS
- 2007-06-14 Listing Removed — MiRealSource-MiMLS
- 2007-06-14 Listed $83,000 MiRealSource-MiMLS
- 2007-01-30 Listing Removed — MiRealSource-MiMLS
- 2007-01-30 Listed $83,000 MiRealSource-MiMLS
- 2006-12-01 Listed $87,000 MiRealSource-MiMLS
- 2004-08-13 Sold (MLS) $96,000 MiRealSource-MiMLS
- 2004-06-11 Listing Removed — MiRealSource-MiMLS
- 2004-03-24 Listed $92,900 MiRealSource-MiMLS
Cash-flow waterfall
monthlySold comps — $/sqft
last 12 mo · ≤1 miLoading sold comps…