2202 Chester St · Sweetwater, TX
Flood risk 1/10 · Minimal
- FEMA flood zone
- X
- Chance of flooding over 30 yrs
- 0.0%
- Est. flood insurance / yr
- $507 – $1,088
Fire risk 9/10 · Severe
- Est. fire insurance / yr
- $1,222 – $2,270
Heat risk 6/10 · Moderate
- Hot days now (above 104°F)
- 7 days/yr
- Hot days in 30 yrs
- 22 days/yr
Wind risk 4/10 · Minor
- Chance of severe wind over 30 yrs
- 9.0%
Air-quality risk 1/10 · Minimal
- Unhealthy air days now
- 0 days/yr
- Unhealthy air days in 30 yrs
- 0 days/yr
Risk factors via First Street. Map © Google.
Why this score? — see what drove the B- grade
The composite is a weighted blend of 9 inputs, each scored 0–100. Each bar is that input's sub-score; the figure is the points it added to the 100-point composite (weight × sub-score).
- Cash flow +30.0/30.0
- 1% rule +10.0/10.0
- DSCR +10.0/10.0
- ARV discount +7.5/15.0
- Livability +3.3/5.0
- Rent growth +2.5/5.0
- Condition / age +2.5/5.0
- Schools +2.3/10.0
- Appreciation +0.0/10.0
$75,000
🖨 Deal sheet 📄 Offer letter ✓ Due diligence
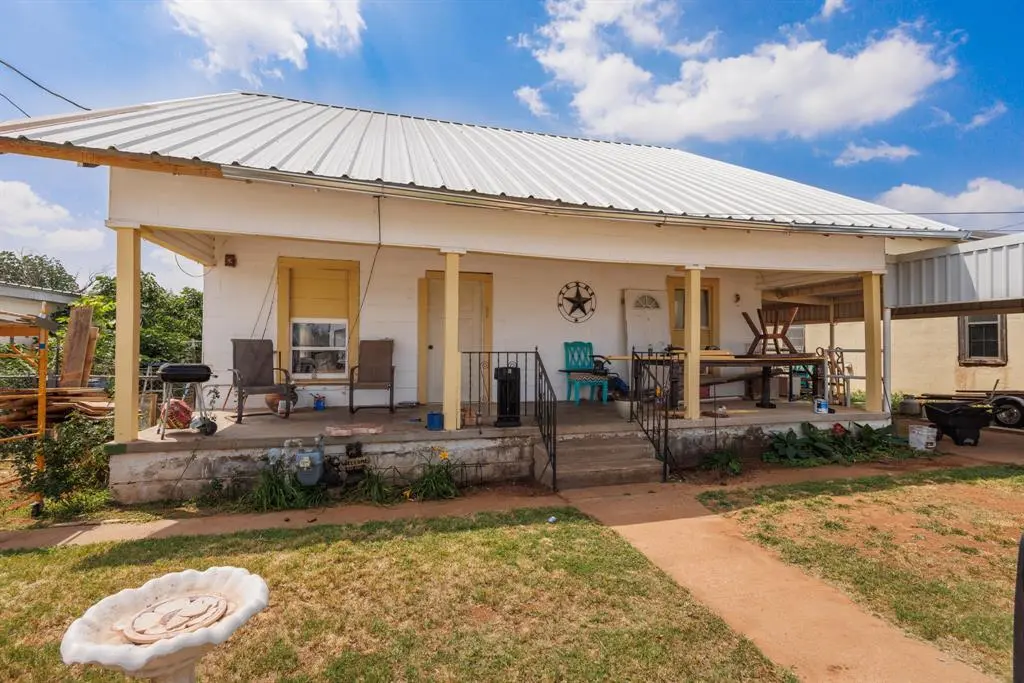
Listing remarks
Great investment opportunity with plenty of potential! This 2 bedroom, 1 bath home offers original hardwood floors, an open kitchen and dining layout, and spacious rooms throughout. Bay windows in both the dining area and primary bedroom bring in abundant natural light and add to the home’s appeal. The large utility room provides extra storage and functional space, while the bathroom features a walk-in tub. Recent updates include new carpet in the living area and fresh exterior paint. A spacious front porch adds curb appeal and outdoor living potential. Whether you’re looking to expand your rental portfolio, renovate, or find your next project, this property offers a solid oppor
Key facts
- New carpet
- Walk-in tub
- Bay windows
Tags
Property features AI
Finance
- Other: Lot less than 0.5 acre; Subdivision: W A Hale
- Financial info: Treat as clear loan type; No second mortgage
- HOA & community: No HOA/association
Exterior
- Parking: Open parking (no garage or covered/carport spaces)
- Utilities: City water; City sewer; Not in a municipal utility district
- Home design: Single-family residence; One story; Residential property; Interior lot
- Construction: Built in 1935; Metal roof; Pillar/post/pier foundation; Chain link fence
- Exterior features: Covered porch(es); Covered patio/porch
Interior
- Kitchen: Electric range
- Bedrooms: 2 bedrooms (both on main level); Primary bedroom on main level
- Flooring: Carpet; Hardwood; Luxury vinyl plank
- Bathrooms: 1 full bathroom (on main level)
- Heating & cooling: Wall furnace; Window unit(s) for cooling
- Interior features: Eat-in kitchen; One living area; One dining area; 7 total rooms
- Laundry & utility: Utility room with full-size washer/dryer area
Neighborhood map
What this means for you Summary
Snapshot
- This is a 2-bed/1.0-bath single-family listed at $75k.
Deal economics
- At list price, monthly cash flow is $646 ($8k/yr) — positive.
- The deal already cash-flows at list — no discount required.
- Meets the 1% rule at list price ($1k rent vs $75k).
- Recommended offer: $74k (1.5% below list) — sets the bar for market timing.
- Cap rate 16.6% vs local median 6.1% in Sweetwater — top-decile yield for the area; either an underpriced asset or a hidden risk that comps aren't pricing in. Stress-test before assuming the spread holds.
Location & tenants
- Location reads 66/100 on livability (#640 in TX) — a middle-class / working-renter tenant base. Strengths: cost of living A+, housing A+, health & safety A+; Watch: crime D+, schools F, amenities F.
- Sweetwater ISD (town): math 27% / reading 29% proficiency, ranked #681 of 826 in TX (top 82%) — low school quality limits family demand, transient renter base, plan for 1-2y turnover.
- Market conditions: 108 active listings in the ZIP; 15 units permitted in Nolan County in 2024 (0 in 5+ unit buildings).
Forward outlook
- Local home prices are declining (-3.0%/yr); year-one equity from $519 of loan paydown is wiped out by about $2k of value loss. Plan a longer hold.
- Nolan County population projected at +4% by 2050 — modest demand growth; plan on rents tracking national, not racing it.
- At projected returns (-3.0% appreciation + 3.0% rent growth), your $21k cash investment doubles in ~4 years — after that, you're playing with house money.
Negotiation context
- It's been on market 21 days — a 2% lower offer ($74k) is reasonable based on typical stale-listing flexibility.
Risks & watch-outs
- Watch-outs: built in 1935 — expect roof / HVAC / electrical / plumbing capex.
- Climate carrying-cost: severe wildfire risk; extreme-heat days projected 7→22/yr by 2055 (HVAC capex compounding) — expect insurance premiums to compound above CPI over the hold.
Questions for the listing agent
- Built in 1935 — when were the roof, HVAC, electrical panel, plumbing, and water heater last replaced?
- Is there a deadline driving the sale (1031 exchange, divorce, estate, relocation)? That informs how much negotiation room exists.
- Schools are F-rated, which usually means shorter tenancies and higher turnover. Who's the typical renter profile here, and what's been the actual vacancy rate?
- Crime grade is D in this area — have there been break-ins, vandalism, or insurance claims at this property in the last 3 years? What carrier currently insures it and at what premium?
- What's the average days-on-market for RENTAL listings here right now (not sales)? A rising rental-DOM trend means longer vacancies and softer asking-rent achievability than the comps imply.
- What's the recent tenant-quality profile in this submarket — average credit score on applications, eviction rate, late-payment / NSF rate, and stable-employment percentage? A property-management company in the area should have these aggregated.
- How much new for-sale + rental construction is in the pipeline within 1–3 miles? Heavy new supply typically softens prices + rents 12–24 months out; constrained supply supports both.
Investment metrics
- 1% rule
- 1.91% ✓
- Cap rate
- 16.63%
- Cash-on-cash
- 36.90%
- DSCR
- 2.64
- GRM
- 4.4
CMA / ARV
No comps found within radius.
Projected returns pro-forma
-3.0% appreciation · 3.0% rent growth · sell at horizon
- IRR
- 32.8%
- Equity multiple
- 2.38×
- Total profit
- $28,980
- Equity at exit
- $11,183
- IRR
- 39.8%
- Equity multiple
- 4.72×
- Total profit
- $78,210
- Equity at exit
- $6,485
Cash invested: $21,000 (down + closing). Projections, not guarantees.
Landlord ↔ Tenant lean methodology
- Overall (STATE)
- 87 Strongly Landlord-Friendly
- State Texas
- 87 Strongly Landlord-Friendly · R+5
- County
- — inherits STATE
- City
- — inherits STATE
ZIP-level market 79556
- Active inventory
- 108
- Price-to-rent
- 4.4×
Monthly cashflow live
- Estimated rent
- $1,436 medium interval (Pro) →
- Mortgage (P&I)
- −$393
- Tax from tax record
- −$64 /mo · $769/yr
- Insurance
- −$31
- HOA
- −$0
- Vacancy / Maint / Mgmt
- −$302
- Net cashflow
- $646
Break-even live
UW: 25.0% down · 7.5% · 30yr · 1.5% tax · 5.0% vac · 8.0% maint · 8.0% mgmt
Financing live
Cash to close
- Down payment
- $18,750
- Closing costs
- $2,250
- Reserves months
- —
- Total cash needed
- —
Loan-product check · same deal, 3 products live
Conventional
25% down · 7.5% · 30yr
- Down + closing
- —
- Monthly P&I
- —
- Monthly cashflow
- —
- DSCR
- —
- Eligible?
- —
Personal DTI + credit; lowest rate.
DSCR
20% down · 8.5% · 30yr
- Down + closing
- —
- Monthly P&I
- —
- Monthly cashflow
- —
- DSCR
- —
- Eligible?
- —
No personal income docs; deal must DSCR.
Hard money
10% down · 12.0% · 12mo
- Down + closing
- —
- Monthly P&I
- —
- Monthly cashflow
- —
- DSCR
- —
- Eligible?
- —
Short-term bridge; refi at stabilization.
Listing history 18 events
-
2026-06-18days on market $75,000 Active 21 DOM
-
2026-06-17days on market $75,000 Active 20 DOM
-
2026-06-16days on market $75,000 Active 19 DOM
-
2026-06-15days on market $75,000 Active 18 DOM
-
2026-06-15days on market $75,000 Active 17 DOM
-
2026-06-13days on market $75,000 Active 16 DOM
-
2026-06-12days on market $75,000 Active 15 DOM
-
2026-06-09days on market $75,000 Active 12 DOM
-
2026-06-08days on market $75,000 Active 11 DOM
-
2026-06-08days on market $75,000 Active 10 DOM
-
2026-06-07days on market $75,000 Active 9 DOM
-
2026-06-03days on market $75,000 Active 6 DOM
-
2026-06-02days on market $75,000 Active 5 DOM
-
2026-06-01days on market $75,000 Active 4 DOM
-
2026-05-31days on market $75,000 Active 3 DOM
-
2026-05-28$75,000 Active
-
2025-02-03soldstatus
-
2000-02-29soldstatus
ⓘ Source: listings_history table (triggers on properties + properties_extension) + one-shot
backfill from property_details.listing_events for pre-trigger history.
Tax reassessment forecast TX · Resets to sale price
- Current annual tax
- $769 · $64/mo
- Projected year-2 tax
- $1,372 · $114/mo
- Expected delta
- +$603/yr (+$50/mo · 78.4%)
ⓘ Screening estimate from a state-policy table — verify with the county assessor before closing.
Climate risk First Street
- Flood 1/10 Low FEMA zone X · 0% chance over 30 yrs
- Wildfire 9/10 Extreme
- Heat 6/10 Major 7 d/yr ≥104°F today · 22 d/yr by 30 yrs out
- Wind 4/10 Moderate 9% chance of damaging wind over 30 yrs
- Air quality 1/10 Low 0 unhealthy d/yr today · 0 by 30 yrs out
Nearby sold comps map
Loading sold comps map…
Walkable amenities ~0.75 mi
Loading nearby amenities…
Taxation est. · year 1
- Rental income
- $17,232
- − Mortgage interest
- −$4,201
- − Property taxes
- −$769
- − Insurance
- −$375
- − Repairs & maintenance
- −$1,379
- − Management
- −$1,379
- − Depreciation
- −$2,182
- Taxable income
- $6,948
- Est. tax owed @ 24.0%
- −$1,667
- After-tax cash flow
- $6,082/yr
For passive investors: Depreciation is non-cash, so a rental often shows a tax loss while cash-flowing — sheltering income. Rental losses are passive: they offset passive income freely, and up to $25,000/yr can offset ordinary (W-2) income if you actively participate and your MAGI is under $100k (phasing out to $0 by $150k); unused losses carry forward. On sale, claimed depreciation is recaptured at up to 25%, and gains may owe capital-gains tax (a 1031 exchange can defer both). Figures are a year-1 estimate at your 24.0% rate — not tax advice; consult a CPA.
Schools (NCES district)
- District
- Sweetwater ISD
- NCES district ID
- 4842030
- Math proficiency
- 27% ▼ -11.00%
- Reading proficiency
- 29% ▼ -4.00%
- Median HH income
- $37,599
- Composite
- 23.36/100
- National rank
- #7912
- State rank
- #681 of 826 in TX
Livability — Sweetwater
- Score
- 66/100
- State rank
- #640
- US rank
- #12189
Category grades
Schools grade is shown separately in the Schools card above.
Census & demographics
- Census place
- Sweetwater, TX
- City population
- 12,593
- Population (ZIP)
- 12,593
Population outlook (Nolan County) Hauer SSP2
- Today (2025)
- 15,048 people
- By 2030
- 15,043 · +-0.0%
- By 2040
- 15,235 · +1.2%
- By 2050
- 15,603 · +3.7%
- By 2075
- 16,528 · +9.8%
- By 2100
- 16,427 · +9.2%
Race, ethnicity, and origin ACS 2023
- Neighborhood character
- Diverse neighborhood (Simpson 0.58)
- Race & ethnicity
- White 53% Hispanic / Latino 38% Two or more races 19% Black 4%
- Hispanic origin (detail)
- Mexican 35%
- Common ancestry
- Slovak 1% Italian 1% Lithuanian 1%
- Foreign-born
- 4% · Canada, Dominican Republic
- Languages at home
- 77% English-only · Spanish 22%
Political lean MEDSL · Nolan
- 2024 margin
- Solid R (+59.2) · D 19.9% · R 79.2%
- 2008→2024 swing
- -20.4pp toward R · 2008: -38.8pp · 2024: -59.2pp
- All cycles
- 2024: R+59.2 2020: R+55.4 2016: R+53.2 2012: R+45.1 2008: R+38.8
Not yet ingested
- Civics
- —
Market trends
- HPI YoY
- ▼ -129.76%
- Current HPI
- 123.8718
- Rent YoY
- —
- Metro
- —
- State GDP YoY
- ▲ 3.95%
- F500 in state
- 110
Industry mix (Fortune 500 HQ in TX)
| Industry | F500 HQs | Revenue |
|---|---|---|
| Energy | 16 | $1,198B |
|
||
| Technology | 5 | $198B |
|
||
| Engineering / Construction | 4 | $72B |
|
||
| Energy Services | 3 | $60B |
|
||
| Utilities | 3 | $41B |
|
||
| Healthcare | 2 | $330B |
|
||
Price history
3 events — show timeline
- 2026-05-28 Listed $75,000 NTREIS
- 2025-02-03 Sold (Public Records) — Public Records
- 2000-02-29 Sold (Public Records) — Public Records
Property tax history
+6.5%/yrLatest (2025): $769 · +45.0% YoY. Source: county tax records.
Cash-flow waterfall
monthlySold comps — $/sqft
last 12 mo · ≤1 miLoading sold comps…