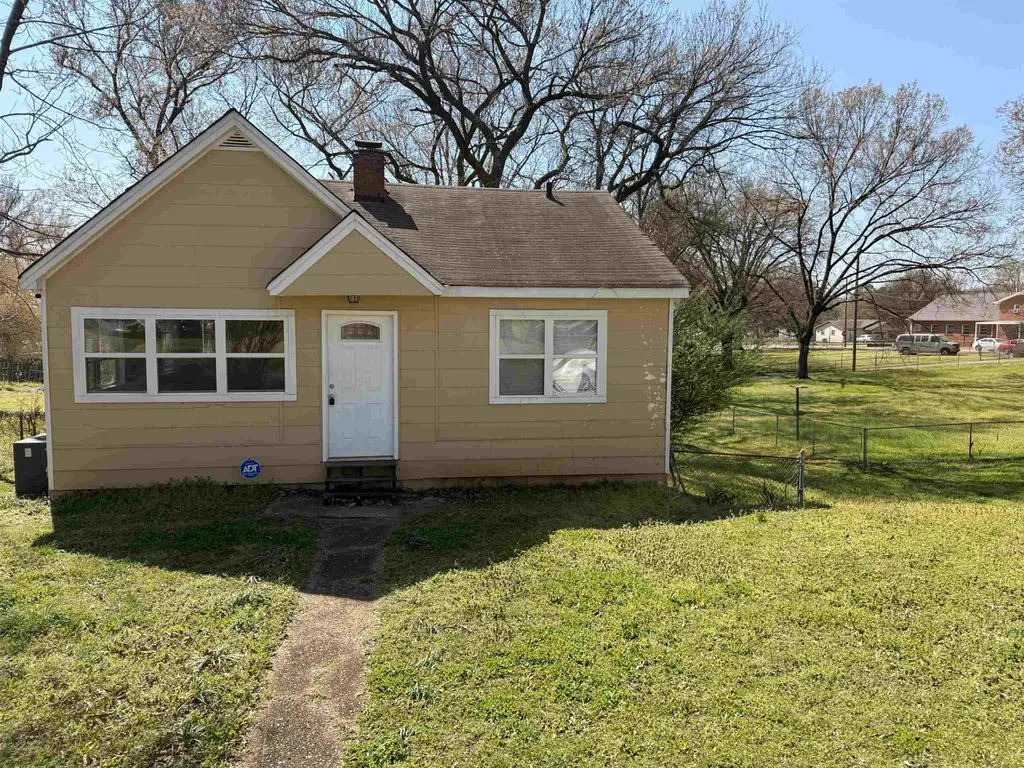
320 S Richards St · Florence, AL
Flood risk 1/10 · Minimal
- FEMA flood zone
- X (unshaded)
- Chance of flooding over 30 yrs
- 0.0%
- Est. flood insurance / yr
- $507 – $1,088
Fire risk 1/10 · Minimal
- Est. fire insurance / yr
- $916 – $1,700
Heat risk 6/10 · Moderate
- Hot days now (above 107°F)
- 7 days/yr
- Hot days in 30 yrs
- 20 days/yr
Wind risk 4/10 · Minor
- Chance of severe wind over 30 yrs
- 21.0%
Air-quality risk 2/10 · Minimal
- Unhealthy air days now
- 0 days/yr
- Unhealthy air days in 30 yrs
- 2 days/yr
Risk factors via First Street. Map © Google.
Why this score? — see what drove the C grade
The composite is a weighted blend of 9 inputs, each scored 0–100. Each bar is that input's sub-score; the figure is the points it added to the 100-point composite (weight × sub-score).
- Cash flow +27.1/30.0
- DSCR +9.4/10.0
- 1% rule +6.3/10.0
- Livability +4.1/5.0
- Rent growth +4.0/5.0
- Schools +3.0/10.0
- Condition / age +2.5/5.0
- ARV discount +0.0/15.0
- Appreciation +0.0/10.0
$90,000
🖨 Deal sheet 📄 Offer letter ✓ Due diligence
Listing remarks
Great opportunity for first-time buyers, investors, or downsizers! This 2-bedroom, 1-bath home features an unfinished basement, cozy living space, and nice natural light throughout. Conveniently located
Key facts
- 7,405 sq ft lot
- Built 1948
- Listed 47 days
Property features AI
Finance
- Other: Lot dimensions approximately 50 x 150 (0.17 acre)
Exterior
- Parking: Driveway; On-street parking
- Utilities: Public water; Sewer: unknown
- Home design: Single family residence (residential property); Above-grade finished living area: 798; Zoned R2; Subdivision: City of Florence
- Construction: Basement: block construction, unfinished, exterior entry
- Exterior features: Composition roof
Interior
- Kitchen: Dishwasher; Electric range
- Bedrooms: 2 main-level bedrooms
- Flooring: Laminate flooring
- Bathrooms: 1 full bathroom
- Interior features: Laminate counters; Total of 5 rooms; Unfinished block basement with exterior entry
- Laundry & utility: Laundry located in kitchen
Neighborhood map
What this means for you Summary
Snapshot
- This is a 2-bed/1.0-bath single-family listed at $90k.
Deal economics
- At list price, monthly cash flow is $254 ($3k/yr) — positive.
- The deal already cash-flows at list — no discount required.
- Meets the 1% rule at list price ($1k rent vs $90k).
- Recommended offer: $87k (3.0% below list) — sets the bar for market timing.
- Cap rate 9.7% vs local median 3.6% in Florence — top-decile yield for the area; either an underpriced asset or a hidden risk that comps aren't pricing in. Stress-test before assuming the spread holds.
Location & tenants
- Location reads 82/100 on livability (#4 in AL, #1,140 nationally) — a professional / high-income tenant draw. Strengths: amenities A+, commute A+, cost of living A+; Watch: crime F, employment F.
- Florence City (urban): math 28% / reading 44% proficiency, ranked #44 of 129 in AL (top 34%) — families likely to look elsewhere, expect single-tenant / working-renter base with shorter leases.
- Market conditions: Rents rising fast (+6.2%/yr); 268 active listings in the ZIP; 2 comparable units currently listed for rent nearby; 164 units permitted in Lauderdale County in 2024 (72 in 5+ unit buildings).
Forward outlook
- Local home prices are declining (-3.0%/yr); year-one equity from $622 of loan paydown is wiped out by about $3k of value loss. Plan a longer hold.
- At projected returns (-3.0% appreciation + 6.2% rent growth), your $25k cash investment doubles in ~8 years — after that, you're playing with house money.
Negotiation context
- It's been on market 48 days — a 3% lower offer ($87k) is reasonable based on typical stale-listing flexibility.
- 5 sale attempts since 12y ago with the ask held roughly flat each time — persistent listings suggest the price (not the market) is what's stuck; bring a comps-based counter.
Risks & watch-outs
- Watch-outs: built in 1948 — expect roof / HVAC / electrical / plumbing capex.
- Climate carrying-cost: extreme-heat days projected 7→20/yr by 2055 (HVAC capex compounding) — expect insurance premiums to compound above CPI over the hold.
Questions for the listing agent
- It's been on market 48 days. Have you received any prior offers? Is the seller open to a 3% concession, seller financing, or rate buy-down credit?
- Built in 1948 — when were the roof, HVAC, electrical panel, plumbing, and water heater last replaced?
- Is there a deadline driving the sale (1031 exchange, divorce, estate, relocation)? That informs how much negotiation room exists.
- Crime grade is F in this area — have there been break-ins, vandalism, or insurance claims at this property in the last 3 years? What carrier currently insures it and at what premium?
- What's the average days-on-market for RENTAL listings here right now (not sales)? A rising rental-DOM trend means longer vacancies and softer asking-rent achievability than the comps imply.
- What's the recent tenant-quality profile in this submarket — average credit score on applications, eviction rate, late-payment / NSF rate, and stable-employment percentage? A property-management company in the area should have these aggregated.
- How much new for-sale + rental construction is in the pipeline within 1–3 miles? Heavy new supply typically softens prices + rents 12–24 months out; constrained supply supports both.
Investment metrics
- 1% rule
- 1.13% ✓
- Cap rate
- 9.68%
- Cash-on-cash
- 12.10%
- DSCR
- 1.54
- GRM
- 7.4
CMA / ARV
- ARV (median comp)
- $76,020
- List price
- $90,000
- Delta
- 18.39%
- Verdict
- OVERPRICED
- Comps
- 20 within 1.0 mi
Show comp detail 1 sale within ~0.75 mi
| Address | Dist | Beds/Ba | Sqft | Sold | Price | $/sf | Match |
|---|---|---|---|---|---|---|---|
| 306 S Kirkman St | 0.27mi | 1/1.0 (-1) | 694 (+3%) | 18mo | $36,500 | $53 | 62 |
Match score weights: distance 35% · size 25% · config 20% · recency 20%. Top-matched comps best support the ARV.
Projected returns pro-forma
-3.0% appreciation · 6.18% rent growth · sell at horizon
- IRR
- 4.9%
- Equity multiple
- 1.20×
- Total profit
- $4,943
- Equity at exit
- $13,419
- IRR
- 16.9%
- Equity multiple
- 2.58×
- Total profit
- $39,780
- Equity at exit
- $7,782
Cash invested: $25,200 (down + closing). Projections, not guarantees.
Landlord ↔ Tenant lean methodology
- Overall (STATE)
- 90 Strongly Landlord-Friendly
- State Alabama
- 90 Strongly Landlord-Friendly · R+15
- County
- — inherits STATE
- City
- — inherits STATE
ZIP-level market 35630
- Home prices YoY
- -33.7%
- Rents YoY
- 6.2%
- Active inventory
- 268
- Price-to-rent
- 7.4×
Monthly cashflow live
- Estimated rent
- $1,019 medium interval (Pro) →
- Mortgage (P&I)
- −$472
- Tax from tax record
- −$42 /mo · $501/yr
- Insurance
- −$38
- HOA
- −$0
- Vacancy / Maint / Mgmt
- −$214
- Net cashflow
- $254
Break-even live
UW: 25.0% down · 7.5% · 30yr · 1.5% tax · 5.0% vac · 8.0% maint · 8.0% mgmt
Financing live
Cash to close
- Down payment
- $22,500
- Closing costs
- $2,700
- Reserves months
- —
- Total cash needed
- —
Loan-product check · same deal, 3 products live
Conventional
25% down · 7.5% · 30yr
- Down + closing
- —
- Monthly P&I
- —
- Monthly cashflow
- —
- DSCR
- —
- Eligible?
- —
Personal DTI + credit; lowest rate.
DSCR
20% down · 8.5% · 30yr
- Down + closing
- —
- Monthly P&I
- —
- Monthly cashflow
- —
- DSCR
- —
- Eligible?
- —
No personal income docs; deal must DSCR.
Hard money
10% down · 12.0% · 12mo
- Down + closing
- —
- Monthly P&I
- —
- Monthly cashflow
- —
- DSCR
- —
- Eligible?
- —
Short-term bridge; refi at stabilization.
Rent comps 2 comps
| Address | Beds | Baths | Sqft | Rent | $/sqft | DOM | Units | Dist |
|---|---|---|---|---|---|---|---|---|
| 801 E Mobile St Unit 2 Florence, AL | 1.0 | 1.0 | 550 | $775 | $1.41 | 43d | 1 | 1.24mi |
| 511 E Tombigbee St Unit 3 Florence, AL | 1.0 | 1.0 | 500 | $650 | $1.30 | 43d | 1 | 1.46mi |
Listing history 25 events
-
2026-06-19days on market $90,000 Active 48 DOM
-
2026-06-18days on market $90,000 Active 47 DOM
-
2026-06-17days on market $90,000 Active 46 DOM
-
2026-06-16days on market $90,000 Active 45 DOM
-
2026-06-15days on market $90,000 Active 44 DOM
-
2026-06-14days on market $90,000 Active 42 DOM
-
2026-06-13days on market $90,000 Active 41 DOM
-
2026-06-10days on market $90,000 Active 39 DOM
-
2026-06-09days on market $90,000 Active 38 DOM
-
2026-06-08days on market $90,000 Active 37 DOM
-
2026-06-05days on market $90,000 Active 33 DOM
-
2026-06-02days on market $90,000 Active 31 DOM
-
2026-06-01days on market $90,000 Active 30 DOM
-
2026-05-31days on market $90,000 Active 29 DOM
-
2026-05-30days on market $90,000 Active 28 DOM
-
2026-05-01$90,000 Active 202-char remark
-
2025-11-14$103,000 Active
-
2023-06-16soldstatus $94,000 Closed
-
2023-06-16soldstatus $94,000
-
2023-03-22status Pending
-
2023-02-07price $90,000
-
2023-01-16status Active
-
2023-01-14status Pending
-
2023-01-02$92,500 Active
-
2014-10-10$17,400
ⓘ Source: listings_history table (triggers on properties + properties_extension) + one-shot
backfill from property_details.listing_events for pre-trigger history.
Tax reassessment forecast AL · Resets to sale price
- Current annual tax
- $501 · $42/mo
- Projected year-2 tax
- $501 · $42/mo
- Expected delta
- $0/yr ($0/mo · 0.0%)
ⓘ Screening estimate from a state-policy table — verify with the county assessor before closing.
Climate risk First Street
- Flood 1/10 Low FEMA zone X (unshaded) · 0% chance over 30 yrs
- Wildfire 1/10 Low
- Heat 6/10 Major 7 d/yr ≥107°F today · 20 d/yr by 30 yrs out
- Wind 4/10 Moderate 21% chance of damaging wind over 30 yrs
- Air quality 2/10 Low 0 unhealthy d/yr today · 2 by 30 yrs out
Nearby sold comps map
Loading sold comps map…
Walkable amenities ~0.75 mi
Loading nearby amenities…
Taxation est. · year 1
- Rental income
- $12,234
- − Mortgage interest
- −$5,041
- − Property taxes
- −$501
- − Insurance
- −$450
- − Repairs & maintenance
- −$979
- − Management
- −$979
- − Depreciation
- −$2,618
- Taxable income
- $1,666
- Est. tax owed @ 24.0%
- −$400
- After-tax cash flow
- $2,650/yr
For passive investors: Depreciation is non-cash, so a rental often shows a tax loss while cash-flowing — sheltering income. Rental losses are passive: they offset passive income freely, and up to $25,000/yr can offset ordinary (W-2) income if you actively participate and your MAGI is under $100k (phasing out to $0 by $150k); unused losses carry forward. On sale, claimed depreciation is recaptured at up to 25%, and gains may owe capital-gains tax (a 1031 exchange can defer both). Figures are a year-1 estimate at your 24.0% rate — not tax advice; consult a CPA.
Schools (NCES district)
- District
- Florence City
- NCES district ID
- 0101530
- Math proficiency
- 28% ▼ -28.00%
- Reading proficiency
- 44% ▼ -4.00%
- Median HH income
- $34,997
- Composite
- 29.69/100
- National rank
- #6456
- State rank
- #44 of 129 in AL
Livability — Florence
- Score
- 82/100
- State rank
- #4
- US rank
- #1140
Category grades
Schools grade is shown separately in the Schools card above.
Census & demographics
- Census place
- Florence, AL
- County
- Lauderdale County · 47,988 people
- City population
- 34,028
- Metro
- Florence-Muscle Shoals, AL
- Population (ZIP)
- 34,028
- Household income
- $46,304
- Rent vs Own
- Severe rent burden
- 1516.0
Population outlook (Lauderdale County) Hauer SSP2
- Today (2025)
- 93,386 people
- By 2030
- 93,634 · +0.3%
- By 2040
- 93,114 · -0.3%
- By 2050
- 91,586 · -1.9%
- By 2075
- 88,667 · -5.1%
- By 2100
- 81,098 · -13.2%
Race, ethnicity, and origin ACS 2023
- Neighborhood character
- Predominantly White (70%)
- Race & ethnicity
- White 70% Black 18% Two or more races 6% Hispanic / Latino 6%
- Hispanic origin (detail)
- Mexican 5%
- Common ancestry
- Slovak 3% Serbian 2% Romanian 1%
- Foreign-born
- 4% · Canada, Vietnam, Guatemala
- Languages at home
- 92% English-only · Spanish 6% Vietnamese 1%
Political lean MEDSL · Lauderdale
- 2024 margin
- Solid R (+51.5) · D 23.8% · R 75.3%
- 2008→2024 swing
- -23.3pp toward R · 2008: -28.2pp · 2024: -51.5pp
- All cycles
- 2024: R+51.5 2020: R+44.7 2016: R+46.0 2012: R+30.9 2008: R+28.2
Not yet ingested
- Civics
- —
Market trends
- HPI YoY
- ▼ -104.78%
- Current HPI
- 206.1364
- Rent YoY
- ▲ 6.18%
- Metro
- Florence-Muscle Shoals, AL
- State GDP YoY
- ▲ 2.94%
- F500 in state
- 4
Industry mix (Fortune 500 HQ in AL)
| Industry | F500 HQs | Revenue |
|---|---|---|
| Financial Services | 1 | $8B |
|
||
| Healthcare | 1 | $5B |
|
||
Price history
+417.2% since first listed10 events — show timeline
- 2026-05-01 Listed $90,000 SAARMLS
- 2025-11-14 Listed $103,000 SAARMLS
- 2023-06-16 Sold (Public Records) $94,000 Public Records
- 2023-06-16 Sold (MLS) $94,000 SAARMLS
- 2023-03-22 Pending — SAARMLS
- 2023-02-07 Price Changed $90,000 SAARMLS
- 2023-01-16 Relisted — SAARMLS
- 2023-01-14 Pending — SAARMLS
- 2023-01-02 Listed $92,500 SAARMLS
- 2014-10-10 Listed $17,400 SAARMLS
Property tax history
+20.2%/yrLatest (2025): $501 · +6.9% YoY. Source: county tax records.
Cash-flow waterfall
monthlySold comps — $/sqft
last 12 mo · ≤1 miLoading sold comps…