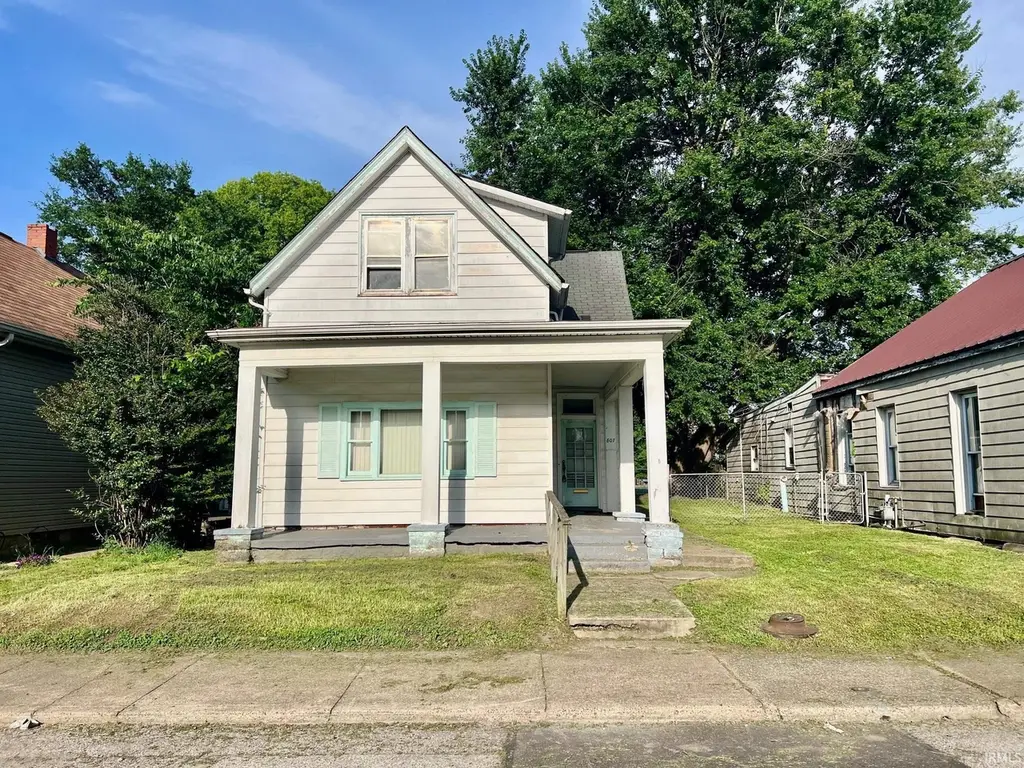
807 N Fourth Ave · Evansville, IN
Flood risk 1/10 · Minimal
- FEMA flood zone
- X (unshaded)
- Chance of flooding over 30 yrs
- 0.0%
- Est. flood insurance / yr
- $473 – $860
Fire risk 1/10 · Minimal
- Est. fire insurance / yr
- $717 – $1,331
Heat risk 5/10 · Moderate
- Hot days now (above 106°F)
- 7 days/yr
- Hot days in 30 yrs
- 19 days/yr
Wind risk 3/10 · Minor
- Chance of severe wind over 30 yrs
- 4.0%
Air-quality risk 4/10 · Minor
- Unhealthy air days now
- 3 days/yr
- Unhealthy air days in 30 yrs
- 5 days/yr
Risk factors via First Street. Map © Google.
Why this score? — see what drove the B+ grade
The composite is a weighted blend of 9 inputs, each scored 0–100. Each bar is that input's sub-score; the figure is the points it added to the 100-point composite (weight × sub-score).
- Cash flow +30.0/30.0
- ARV discount +14.9/15.0
- 1% rule +10.0/10.0
- DSCR +10.0/10.0
- Schools +3.3/10.0
- Livability +3.2/5.0
- Rent growth +2.5/5.0
- Condition / age +2.2/5.0
- Appreciation +0.0/10.0
$69,900
🖨 Deal sheet (PDF) 📄 Offer letter ✓ Due diligence
Listing remarks
Your next summer investment project awaits! An open front porch welcomes you to this large two story home that is currently set up as a duplex but has potential to be a triplex or even could be a large single family home again as it was originally intended. The home features 4 bedrooms and 3 bathrooms along with more than 2300 square feet of space. Multiple entrances to each apartment already exist. A rear kitchen and foyer in the home feature new flooring and trim. The upstairs features a large kitchen, full bath and large rooms. Two separate gas furnaces. Outside, enjoy a large, newer 24x30 garage that has a concrete floor and rear garage door. With some cosmetic TLC this home could reall
Key facts
- Newer garage
- Rear kitchen
- New flooring
Tags
Property features AI
Exterior
- Parking: Detached 2-car garage
- Utilities: Public water; Public sewer
- Home design: Single-family site-built home; Two stories
- Construction: Aluminum siding; Brick/mortar foundation
- Exterior features: Level lot; Lot dimensions approximately 42 x 130
Interior
- Bathrooms: Two full bathrooms; One half bathroom; Two main-level bathrooms
- Heating & cooling: Natural gas forced air heating; No cooling
- Interior features: Partial basement; Main-level laundry; 10 total rooms
- Laundry & utility: Laundry on the main level
Neighborhood map
What this means for you Summary
Snapshot
- This is a 4-bed/2.5-bath single-family listed at $70k. Condition is rated fair.
Deal economics
- At list price, monthly cash flow is $485 ($6k/yr) — positive.
- The deal already cash-flows at list — no discount required.
- Meets the 1% rule at list price ($1k rent vs $70k).
- Recommended offer: $69k (1.5% below list) — sets the bar for market timing.
- Cap rate 14.6% vs local median 4.6% in Evansville — top-decile yield for the area; either an underpriced asset or a hidden risk that comps aren't pricing in. Stress-test before assuming the spread holds.
Location & tenants
- Location reads 63/100 on livability (#416 in IN) — a middle-class / working-renter tenant base. Strengths: cost of living A+, housing A+, health & safety A+; Watch: crime F, commute F, employment D-.
- Evansville Vanderburgh School Corporation (urban): math 36% / reading 43% proficiency, ranked #153 of 301 in IN (top 51%) — families likely to look elsewhere, expect single-tenant / working-renter base with shorter leases.
- Zoned schools: Cedar Hall Community School (math 13% / reading 19%, grade F, #854 of 994 statewide, top 86%, 509 students, 93% FRL); Central High School (math 38% / reading 74%, grade C, #73 of 369 statewide, top 20%, 1,090 students, 52% FRL) — zoned schools average 72% FRL vs 50% district-wide (23 pts higher); higher-poverty schools than district average — tighter screening recommended.
- Market conditions: 88 active listings in the ZIP; 4 comparable units currently listed for rent nearby; rentals at typical pace (median 22d on market — plan ~3-4 weeks tenant-placement turnaround); 508 units permitted in Vanderburgh County in 2024 (32 in 5+ unit buildings).
- This rent runs 31% of the median local income ($47k/yr) — at the standard rent-burdened threshold; future hikes will face affordability resistance.
Forward outlook
- Local home prices are declining (-3.0%/yr); year-one equity from $483 of loan paydown is wiped out by about $2k of value loss. Plan a longer hold.
- At projected returns (-3.0% appreciation + 3.0% rent growth), your $20k cash investment doubles in ~5 years — after that, you're playing with house money.
Negotiation context
- It's been on market 18 days — a 2% lower offer ($69k) is reasonable based on typical stale-listing flexibility.
Risks & watch-outs
- Watch-outs: built in 1904 — expect roof / HVAC / electrical / plumbing capex.
- Climate carrying-cost: extreme-heat days projected 7→19/yr by 2055 (HVAC capex compounding) — expect insurance premiums to compound above CPI over the hold.
Questions for the listing agent
- Have any recent inspections been done? Can we get a copy of the seller's disclosures and any deferred-maintenance estimates?
- Built in 1904 — when were the roof, HVAC, electrical panel, plumbing, and water heater last replaced?
- Is there a deadline driving the sale (1031 exchange, divorce, estate, relocation)? That informs how much negotiation room exists.
- Schools are D-rated, which usually means shorter tenancies and higher turnover. Who's the typical renter profile here, and what's been the actual vacancy rate?
- Crime grade is F in this area — have there been break-ins, vandalism, or insurance claims at this property in the last 3 years? What carrier currently insures it and at what premium?
- What's the average days-on-market for RENTAL listings here right now (not sales)? A rising rental-DOM trend means longer vacancies and softer asking-rent achievability than the comps imply.
- What's the recent tenant-quality profile in this submarket — average credit score on applications, eviction rate, late-payment / NSF rate, and stable-employment percentage? A property-management company in the area should have these aggregated.
- How much new for-sale + rental construction is in the pipeline within 1–3 miles? Heavy new supply typically softens prices + rents 12–24 months out; constrained supply supports both.
Investment metrics
- 1% rule
- 1.75% ✓
- Cap rate
- 14.62%
- Cash-on-cash
- 29.75%
- DSCR
- 2.32
- GRM
- 4.8
CMA / ARV
- ARV (on-the-fly)
- $83,736
- Comps found
- 12
Show comp detail 12 sales within ~0.75 mi
| Address | Dist | Beds/Ba | Sqft | Sold | Price | $/sf | Match |
|---|---|---|---|---|---|---|---|
| 620 N Fourth Ave | 0.11mi | 4/2.0 | 2,142 (-8%) | 2mo | $105,000 | $49 | 78 |
| 1028 N 3rd Ave | 0.16mi | 5/1.0 (+1) | 2,386 (+3%) | 5mo | $85,000 | $36 | 73 |
| 908 W Maryland St | 0.13mi | 3/1.5 (-1) | 2,236 (-4%) | 12mo | $28,000 | $13 | 69 |
| 1021 N Second Ave | 0.24mi | 5/1.5 (+1) | 2,434 (+5%) | 4mo | $87,500 | $36 | 69 |
| 1002 Edgar St | 0.36mi | 3/2.0 (-1) | 2,285 (-2%) | 6mo | $5,000 | $2 | 68 |
| 802 W Franklin St | 0.40mi | 4/3.0 | 2,442 (+5%) | 13mo | $120,000 | $49 | 60 |
| 1409 W Maryland St | 0.31mi | 4/1.0 | 1,998 (-14%) | 1mo | $90,000 | $45 | 55 |
| 909 W Maryland St | 0.14mi | 4/1.0 | 2,658 (+14%) | 12mo | $30,000 | $11 | 54 |
| 1025 N Third Ave | 0.16mi | 3/2.0 (-1) | 1,979 (-15%) | 14mo | $18,500 | $9 | 49 |
| 1113 Georgia St | 0.35mi | 4/1.0 | 1,988 (-14%) | 13mo | $100,000 | $50 | 42 |
| 313 W Florida St | 0.63mi | 3/1.0 (-1) | 2,064 (-11%) | 8mo | $40,000 | $19 | 34 |
| 209 W Columbia St | 0.63mi | 4/2.0 | 2,034 (-13%) | 18mo | $45,000 | $22 | 33 |
Match score weights: distance 35% · size 25% · config 20% · recency 20%. Top-matched comps best support the ARV.
Projected returns pro-forma
-3.0% appreciation · 3.0% rent growth · sell at horizon
- IRR
- 24.3%
- Equity multiple
- 2.00×
- Total profit
- $19,597
- Equity at exit
- $10,422
- IRR
- 32.1%
- Equity multiple
- 3.91×
- Total profit
- $56,935
- Equity at exit
- $6,044
Cash invested: $19,572 (down + closing). Projections, not guarantees.
Landlord ↔ Tenant lean methodology
- Overall (STATE)
- 90 Strongly Landlord-Friendly
- State Indiana
- 90 Strongly Landlord-Friendly · R+11
- County
- — inherits STATE
- City
- — inherits STATE
ZIP-level market 47710
- Home prices YoY
- -29.7%
- Active inventory
- 88
- Price-to-rent
- 4.8×
Monthly cashflow live
- Estimated rent
- $1,226 medium interval (Pro) →
- Mortgage (P&I)
- −$367
- Tax est. 1.5%
- −$87 /mo · $1,048/yr
- Insurance
- −$29
- HOA
- −$0
- Vacancy / Maint / Mgmt
- −$257
- Net cashflow
- $485
Break-even live
Sensitivity live
| Price | -10% $534 | -5% $509 | +0% $485 | +5% $461 | +10% $437 |
|---|---|---|---|---|---|
| Rent | -10% $388 | -5% $437 | +0% $485 | +5% $534 | +10% $582 |
| Rate | -1.0pp $520 | -0.5pp $503 | base $485 | +0.5pp $467 | +1.0pp $449 |
UW: 25.0% down · 7.5% · 30yr · 1.5% tax · 5.0% vac · 8.0% maint · 8.0% mgmt
Financing live
Cash to close
- Down payment
- $17,475
- Closing costs
- $2,097
- Reserves months
- —
- Total cash needed
- —
Loan-product check · same deal, 3 products live
Conventional
25% down · 7.5% · 30yr
- Down + closing
- —
- Monthly P&I
- —
- Monthly cashflow
- —
- DSCR
- —
- Eligible?
- —
Personal DTI + credit; lowest rate.
DSCR
20% down · 8.5% · 30yr
- Down + closing
- —
- Monthly P&I
- —
- Monthly cashflow
- —
- DSCR
- —
- Eligible?
- —
No personal income docs; deal must DSCR.
Hard money
10% down · 12.0% · 12mo
- Down + closing
- —
- Monthly P&I
- —
- Monthly cashflow
- —
- DSCR
- —
- Eligible?
- —
Short-term bridge; refi at stabilization.
Rent comps 4 comps
| Address | Beds | Baths | Sqft | Rent | $/sqft | DOM | Units | Dist |
|---|---|---|---|---|---|---|---|---|
| 1106 W Illinois St Evansville, IN | 5.0 | 2.0 | 1892 | $3,500 | $1.85 | 22d | 1 | 0.41mi |
| 1317 Harriet St Evansville, IN | 3.0 | 2.0 | 2000 | $995 | $0.50 | 14d | 1 | 0.63mi |
| 27 W Franklin St Evansville, IN | 4.0 | 2.5 | 2500 | $1,100 | $0.44 | 22d | 1 | 0.83mi |
| 121 E Florida St Evansville, IN | 4.0 | 2.0 | 1702 | $100 | $0.06 | 22d | 1 | 1.01mi |
Listing history 13 events
-
2026-06-18days on market $69,900 Active 18 DOM
-
2026-06-17days on market $69,900 Active 17 DOM
-
2026-06-16days on market $69,900 Active 16 DOM
-
2026-06-15days on market $69,900 Active 15 DOM
-
2026-06-14days on market $69,900 Active 13 DOM
-
2026-06-13days on market $69,900 Active 12 DOM
-
2026-06-10days on market $69,900 Active 10 DOM
-
2026-06-09days on market $69,900 Active 9 DOM
-
2026-06-08days on market $69,900 Active 8 DOM
-
2026-06-07days on market $69,900 Active 7 DOM
-
2026-06-02days on market $69,900 Active 2 DOM
-
2026-06-01remarks 699-char remark
-
2026-06-01$69,900 Active 1 DOM
ⓘ Source: listings_history table (triggers on properties + properties_extension) + one-shot
backfill from property_details.listing_events for pre-trigger history.
Climate risk First Street
- Flood 1/10 Low FEMA zone X (unshaded) · 0% chance over 30 yrs
- Wildfire 1/10 Low
- Heat 5/10 Major 7 d/yr ≥106°F today · 19 d/yr by 30 yrs out
- Wind 3/10 Moderate 4% chance of damaging wind over 30 yrs
- Air quality 4/10 Moderate 3 unhealthy d/yr today · 5 by 30 yrs out
Nearby sold comps map
Loading sold comps map…
Walkable amenities ~0.75 mi
Loading nearby amenities…
Taxation est. · year 1
- Rental income
- $14,708
- − Mortgage interest
- −$3,915
- − Property taxes
- −$1,048
- − Insurance
- −$350
- − Repairs & maintenance
- −$1,177
- − Management
- −$1,177
- − Depreciation
- −$2,033
- Taxable income
- $5,008
- Est. tax owed @ 24.0%
- −$1,202
- After-tax cash flow
- $4,621/yr
For passive investors: Depreciation is non-cash, so a rental often shows a tax loss while cash-flowing — sheltering income. Rental losses are passive: they offset passive income freely, and up to $25,000/yr can offset ordinary (W-2) income if you actively participate and your MAGI is under $100k (phasing out to $0 by $150k); unused losses carry forward. On sale, claimed depreciation is recaptured at up to 25%, and gains may owe capital-gains tax (a 1031 exchange can defer both). Figures are a year-1 estimate at your 24.0% rate — not tax advice; consult a CPA.
Condition & rehab AI · 12 photos
This two-story home requires moderate renovations to update the kitchen and bathrooms, paint the interior and exterior, and improve curb appeal. With these updates, it could become a move-in-ready property with increased resale and rental value.
Repairs flagged
- Major kitchen cabinets — Old and outdated
- Major bathroom fixtures — Old and outdated
- Moderate exterior siding — Worn and needs repainting
Value-add opportunities
- Both update kitchen cabinets and flooring — Modernizing the kitchen will appeal to both buyers and renters
- Both update bathroom fixtures and flooring — Modernizing the bathrooms will appeal to both buyers and renters
- Both paint interior walls and exterior siding — Fresh paint and siding will improve curb appeal and home value
Renovation cost estimate screening
| Repair item | Severity | Est. cost |
|---|---|---|
| kitchen cabinets · Old and outdated | Major | $15,000–50,000 |
| bathroom fixtures · Old and outdated | Major | $15,000–50,000 |
| exterior siding · Worn and needs repainting | Moderate | $3,000–15,000 |
| Total estimated repair cost · 3 items | $33,000–115,000 |
Value-add ROI direction
- Both update kitchen cabinets and flooring — Modernizing the kitchen will appeal to both buyers and renters ↑
- Both update bathroom fixtures and flooring — Modernizing the bathrooms will appeal to both buyers and renters ↑
- Both paint interior walls and exterior siding — Fresh paint and siding will improve curb appeal and home value ↑
ⓘ Cost ranges are severity-bucket heuristics (US national rule-of-thumb). Get contractor quotes + a written scope before underwriting a rehab budget.
Schools (NCES district)
- District
- Evansville Vanderburgh School Corporation
- NCES district ID
- 1803450
- Math proficiency
- 36% ▼ -7.00%
- Reading proficiency
- 43% ▼ -3.00%
- Median HH income
- $43,270
- Composite
- 33.41/100
- National rank
- #5471
- State rank
- #153 of 301 in IN
Livability — Evansville
- Score
- 63/100
- State rank
- #416
- US rank
- #15047
Category grades
Schools grade is shown separately in the Schools card above.
Census & demographics
- Census place
- Evansville, IN
- County
- Vanderburgh County · 146,793 people
- City population
- 146,793
- Metro
- Evansville, IN-KY
- Population (ZIP)
- 18,309
- Household income
- $47,292
- Rent vs Own
- Severe rent burden
- 722.0
Population outlook (Vanderburgh County) Hauer SSP2
- Today (2025)
- 187,038 people
- By 2030
- 188,907 · +1.0%
- By 2040
- 190,272 · +1.7%
- By 2050
- 188,871 · +1.0%
- By 2075
- 180,751 · -3.4%
- By 2100
- 163,015 · -12.8%
Race, ethnicity, and origin ACS 2023
- Neighborhood character
- Predominantly White (83%)
- Race & ethnicity
- White 83% Two or more races 7% Black 6% Hispanic / Latino 4%
- Common ancestry
- Scotch-Irish 2% Lithuanian 1% Slovak 1%
- Foreign-born
- 2% · Canada, China
- Languages at home
- 97% English-only · Spanish 3%
Political lean MEDSL · Vanderburgh
- 2024 margin
- R (+12.7) · D 43.0% · R 55.6% · Other 1.4%
- 2008→2024 swing
- -15.1pp toward R · 2008: 2.5pp · 2024: -12.7pp
- All cycles
- 2024: R+12.7 2020: R+9.6 2016: R+16.9 2012: R+10.8 2008: D+2.5
Not yet ingested
- Civics
- —
Market trends
- HPI YoY
- ▼ -91.84%
- Current HPI
- 217.586
- Rent YoY
- —
- Metro
- Evansville, IN-KY
- State GDP YoY
- ▲ 2.90%
- F500 in state
- 18
Industry mix (Fortune 500 HQ in IN)
| Industry | F500 HQs | Revenue |
|---|---|---|
| Industrial Machinery | 2 | $37B |
|
||
| Healthcare | 1 | $177B |
|
||
| Pharmaceuticals | 1 | $45B |
|
||
| Metals / Steel | 1 | $18B |
|
||
| Agriculture | 1 | $17B |
|
||
| Packaging | 1 | $12B |
|
||
Price history
1 event — show timeline
- 2026-06-01 Listed $69,900 IRMLS
Cash-flow waterfall
monthlySold comps — $/sqft
last 12 mo · ≤1 miLoading sold comps…