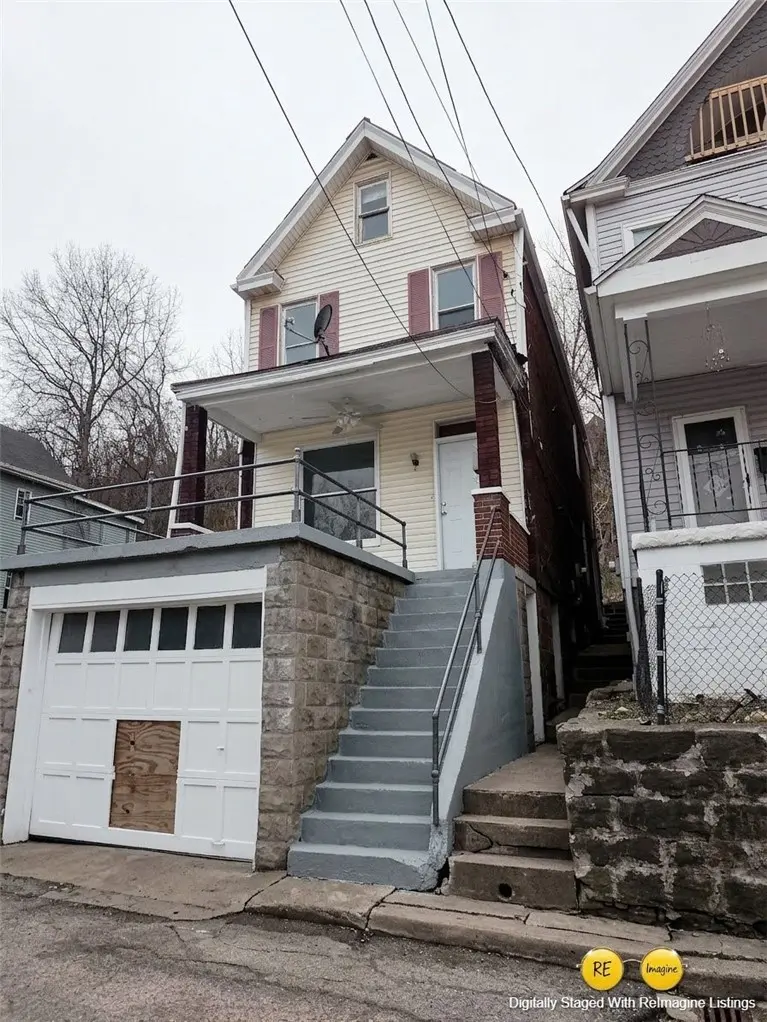
380 Stewart St · Turtle Creek, PA
Flood risk 9/10 · Severe
- FEMA flood zone
- X (unshaded)
- Chance of flooding over 30 yrs
- 0.99%
- Est. flood insurance / yr
- $473 – $860
Fire risk 1/10 · Minimal
- Est. fire insurance / yr
- $511 – $949
Heat risk 4/10 · Minor
- Hot days now (above 97°F)
- 7 days/yr
- Hot days in 30 yrs
- 20 days/yr
Wind risk 2/10 · Minimal
- Chance of severe wind over 30 yrs
- —
Air-quality risk 4/10 · Minor
- Unhealthy air days now
- 5 days/yr
- Unhealthy air days in 30 yrs
- 7 days/yr
Risk factors via First Street. Map © Google.
Why this score? — see what drove the B- grade
The composite is a weighted blend of 9 inputs, each scored 0–100. Each bar is that input's sub-score; the figure is the points it added to the 100-point composite (weight × sub-score).
- Cash flow +30.0/30.0
- 1% rule +10.0/10.0
- DSCR +10.0/10.0
- ARV discount +6.9/15.0
- Livability +3.5/5.0
- Rent growth +2.5/5.0
- Condition / age +2.5/5.0
- Schools +1.8/10.0
- Appreciation +0.0/10.0
$55,000
🖨 Deal sheet 📄 Offer letter ✓ Due diligence
Listing remarks MLS
Investor opportunity at 380 Stewart St in Turtle Creek! This 2-bedroom home offers a strong rental setup with utilities already active and several solid features in place to get started on your next project. The main level offers a flowing layout connecting the living room, dining room, and kitchen, creating a functional space that tenants appreciate. Upstairs you’ll find two bedrooms, while the finished attic area offers excellent potential to create a spacious primary bedroom, office, or nursery. With the right improvements and by updating the heating system to a furnace, the attic space could easily function as a third bedroom, adding additional value and rental appeal. The basement remains dry even during heavy rains and already has rough-ins for a future full bath with space for a shower and toilet. The home features modern Romex wiring with plenty of outlets, helping support today’s electrical needs. Utilities including electric, gas, and water are already active, making it easier to begin renovations. The boiler will need replaced or upgraded, presenting an opportunity to modernize the heating system while expanding functionality throughout the home. The immediate street and block are seeing ongoing improvements, with nearby homes receiving new roofs and renovations. The adjacent property has been removed leaving an open lot next door, and a nearby four-unit building is currently being restored. Located in Turtle Creek with convenient access to Route 30, the Parkway East (I-376), and Downtown Pittsburgh, plus nearby shopping, restaurants, and public transportation. A great opportunity for an investor looking to add a long-term rental to their portfolio with strong upside potential.
Key facts
- Finished attic area
- Modern romex wiring
- Dry basement
Tags
Neighborhood map
What this means for you Summary
Snapshot
- This is a 4-bed/1.5-bath single-family listed at $55k.
Deal economics
- At list price, monthly cash flow is $781 ($9k/yr) — positive.
- The deal already cash-flows at list — no discount required.
- Meets the 1% rule at list price ($2k rent vs $55k).
Location & tenants
- Location reads 69/100 on livability (#807 in PA) — a middle-class / working-renter tenant base. Strengths: crime A+, cost of living A+, housing B; Watch: health & safety D+, amenities F, commute F.
- Woodland Hills SD (suburban): math 13% / reading 30% proficiency, ranked #486 of 539 in PA (top 90%) — low school quality limits family demand, transient renter base, plan for 1-2y turnover; 69% free/reduced lunch — lower-income household profile, screen leases tightly.
- Market conditions: 28 active listings in the ZIP; 10 comparable units currently listed for rent nearby; rentals at typical pace (median 24d on market — plan ~3-4 weeks tenant-placement turnaround); 40% of comp listings sitting > 30 days — soft ceiling on asking rent; 2,996 units permitted in Allegheny County in 2024 (1,588 in 5+ unit buildings).
- This rent runs 37% of the median local income ($50k/yr) — at the standard rent-burdened threshold; future hikes will face affordability resistance.
Forward outlook
- Local home prices are declining (-3.0%/yr); year-one equity from $380 of loan paydown is wiped out by about $2k of value loss. Plan a longer hold.
- At projected returns (-3.0% appreciation + 3.0% rent growth), your $15k cash investment doubles in ~2 years — after that, you're playing with house money.
Negotiation context
- Only 1 days on market — expect competitive offers; lowballing is unlikely to land.
- Current owner paid $15k; list at $55k implies a 267% gain — meaningful room to come down on a strong offer.
Risks & watch-outs
- Watch-outs: flood insurance adds $56/mo; built in 1915 — expect roof / HVAC / electrical / plumbing capex.
- Climate carrying-cost: severe flood risk — expect insurance premiums to compound above CPI over the hold.
Questions for the listing agent
- Built in 1915 — when were the roof, HVAC, electrical panel, plumbing, and water heater last replaced?
- What's the actual annual flood-insurance premium (NFIP or private), and is the property in a SFHA with mandatory coverage?
- Is there a deadline driving the sale (1031 exchange, divorce, estate, relocation)? That informs how much negotiation room exists.
- What's the average days-on-market for RENTAL listings here right now (not sales)? A rising rental-DOM trend means longer vacancies and softer asking-rent achievability than the comps imply.
- What's the recent tenant-quality profile in this submarket — average credit score on applications, eviction rate, late-payment / NSF rate, and stable-employment percentage? A property-management company in the area should have these aggregated.
- How much new for-sale + rental construction is in the pipeline within 1–3 miles? Heavy new supply typically softens prices + rents 12–24 months out; constrained supply supports both.
Investment metrics
- 1% rule
- 2.81% ✓
- Cap rate
- 24.53%
- Cash-on-cash
- 65.15%
- DSCR
- 3.90
- GRM
- 3.0
CMA / ARV
- ARV (median comp)
- $54,322
- List price
- $55,000
- Delta
- 1.25%
- Verdict
- FAIR
- Comps
- 20 within 1.0 mi
Show comp detail 12 sales within ~0.75 mi
| Address | Dist | Beds/Ba | Sqft | Sold | Price | $/sf | Match |
|---|---|---|---|---|---|---|---|
| 373 Stewart St | 0.02mi | 3/2.5 (-1) | 1,516 (+0%) | 9mo | $10,612 | $7 | 83 |
| 421 Fairview Ave | 0.14mi | 4/2.0 | 1,702 (+12%) | 2mo | $11,500 | $7 | 69 |
| 525 James St | 0.42mi | 3/2.0 (-1) | 1,456 (-4%) | 3mo | $67,500 | $46 | 65 |
| 115 Ivy St | 0.36mi | 3/1.0 (-1) | 1,440 (-5%) | 8mo | $27,000 | $19 | 62 |
| 1401 Maple Ave | 0.48mi | 3/2.0 (-1) | 1,560 (+3%) | 6mo | $130,000 | $83 | 61 |
| 601-603 Negley Ave | 0.37mi | 5/2.0 (+1) | 1,344 (-11%) | 4mo | $40,000 | $30 | 53 |
| 313 Locust St | 0.57mi | 3/1.5 (-1) | 1,356 (-10%) | 0mo | $130,000 | $96 | 51 |
| 631 George St | 0.51mi | 4/2.5 | 1,700 (+12%) | 3mo | $152,000 | $89 | 49 |
| 634 Mortimer Ave | 0.54mi | 3/1.5 (-1) | 1,630 (+8%) | 12mo | $130,000 | $80 | 47 |
| 424 Cline St | 0.51mi | 3/1.5 (-1) | 1,326 (-12%) | 6mo | $35,500 | $27 | 45 |
| 633 Locust St | 0.58mi | 3/1.0 (-1) | 1,392 (-8%) | 11mo | $134,500 | $97 | 44 |
| 262 Greensburg Pike | 0.71mi | 3/2.0 (-1) | 1,742 (+15%) | 12mo | $38,600 | $22 | 25 |
Match score weights: distance 35% · size 25% · config 20% · recency 20%. Top-matched comps best support the ARV.
Projected returns pro-forma
-3.0% appreciation · 3.0% rent growth · sell at horizon
- IRR
- 59.7%
- Equity multiple
- 3.65×
- Total profit
- $40,860
- Equity at exit
- $8,201
- IRR
- 64.4%
- Equity multiple
- 7.48×
- Total profit
- $99,837
- Equity at exit
- $4,755
Cash invested: $15,400 (down + closing). Projections, not guarantees.
Landlord ↔ Tenant lean methodology
- Overall (STATE)
- 62 Landlord-Friendly
- State Pennsylvania
- 62 Landlord-Friendly · EVEN
- County
- — inherits STATE
- City
- — inherits STATE
ZIP-level market 15145
- Home prices YoY
- -31.2%
- Active inventory
- 28
- Price-to-rent
- 3.0×
Monthly cashflow live
- Estimated rent
- $1,545 high interval (Pro) →
- Mortgage (P&I)
- −$288
- Tax from tax record
- −$73 /mo · $881/yr
- Insurance
- −$23
- Flood insurance flood zone
- −$56 /mo · $666/yr
- HOA
- −$0
- Vacancy / Maint / Mgmt
- −$325
- Net cashflow
- $781
Break-even live
UW: 25.0% down · 7.5% · 30yr · 1.5% tax · 5.0% vac · 8.0% maint · 8.0% mgmt
Financing live
Cash to close
- Down payment
- $13,750
- Closing costs
- $1,650
- Reserves months
- —
- Total cash needed
- —
Loan-product check · same deal, 3 products live
Conventional
25% down · 7.5% · 30yr
- Down + closing
- —
- Monthly P&I
- —
- Monthly cashflow
- —
- DSCR
- —
- Eligible?
- —
Personal DTI + credit; lowest rate.
DSCR
20% down · 8.5% · 30yr
- Down + closing
- —
- Monthly P&I
- —
- Monthly cashflow
- —
- DSCR
- —
- Eligible?
- —
No personal income docs; deal must DSCR.
Hard money
10% down · 12.0% · 12mo
- Down + closing
- —
- Monthly P&I
- —
- Monthly cashflow
- —
- DSCR
- —
- Eligible?
- —
Short-term bridge; refi at stabilization.
Rent comps 10 comps
| Address | Beds | Baths | Sqft | Rent | $/sqft | DOM | Units | Dist |
|---|---|---|---|---|---|---|---|---|
| 906 Penn Ave Unit D Turtle Creek, PA | 3.0 | 2.0 | 1277 | $1,400 | $1.10 | 44d | 1 | 0.31mi |
| 400 Greensburg Pike North Versailles, PA | 3.0 | 1.0 | 1324 | $1,250 | $0.94 | 44d | 1 | 0.78mi |
| 610 Brown Ave Turtle Creek, PA | 3.0 | 1.0 | 1268 | $1,499 | $1.18 | 4d | 1 | 1.03mi |
| 227 Parklane Dr Unit Parklane Dr unit North Braddock, PA | 3.0 | 1.0 | 1107 | $1,500 | $1.36 | 12d | 1 | 1.04mi |
| 504 Center St Unit 1546027P East Pittsburgh, PA | 5.0 | 2.0 | 1991 | $3,742 | $1.88 | 15d | 1 | 1.18mi |
| 530 Main St Unit 530 East Pittsburgh, PA | 4.0 | 2.0 | 1578 | $1,133 | $0.72 | 44d | 1 | 1.18mi |
| 521 Bessemer Ave East Pittsburgh, PA | 5.0 | 1.0 | 1704 | $1,349 | $0.79 | 24d | 1 | 1.19mi |
| 539 Atlantic Ave Unit 2 Pittsburgh, PA | 3.0 | 1.0 | 1200 | $995 | $0.83 | 44d | 1 | 1.28mi |
| 101 Center St East Pittsburgh, PA | 3.0 | 1.0 | 1500 | $1,505 | $1.00 | 10d | 1 | 1.29mi |
| 165 State St Wilmerding, PA | 3.0 | 1.0 | 1100 | $995 | $0.90 | 17d | 1 | 1.50mi |
Listing history 12 events
-
2026-06-18days on market $55,000 Active 1 DOM
-
2026-06-09days on market $55,000 Active 85 DOM
-
2026-06-08days on market $55,000 Active 84 DOM
-
2026-06-07days on market $55,000 Active 83 DOM
-
2026-06-05days on market $55,000 Active 80 DOM
-
2026-06-03days on market $55,000 Active 79 DOM
-
2026-06-02days on market $55,000 Active 78 DOM
-
2026-06-01days on market $55,000 Active 77 DOM
-
2026-05-31days on market $55,000 Active 76 DOM
-
2026-03-14$55,000 Active 1729-char remark
Show marketing remark (1729 chars)
Investor opportunity at 380 Stewart St in Turtle Creek! This 2-bedroom home offers a strong rental setup with utilities already active and several solid features in place to get started on your next project. The main level offers a flowing layout connecting the living room, dining room, and kitchen, creating a functional space that tenants appreciate. Upstairs you’ll find two bedrooms, while the finished attic area offers excellent potential to create a spacious primary bedroom, office, or nursery. With the right improvements and by updating the heating system to a furnace, the attic space could easily function as a third bedroom, adding additional value and rental appeal. The basement remains dry even during heavy rains and already has rough-ins for a future full bath with space for a shower and toilet. The home features modern Romex wiring with plenty of outlets, helping support today’s electrical needs. Utilities including electric, gas, and water are already active, making it easier to begin renovations. The boiler will need replaced or upgraded, presenting an opportunity to modernize the heating system while expanding functionality throughout the home. The immediate street and block are seeing ongoing improvements, with nearby homes receiving new roofs and renovations. The adjacent property has been removed leaving an open lot next door, and a nearby four-unit building is currently being restored. Located in Turtle Creek with convenient access to Route 30, the Parkway East (I-376), and Downtown Pittsburgh, plus nearby shopping, restaurants, and public transportation. A great opportunity for an investor looking to add a long-term rental to their portfolio with strong upside potential.
-
2025-12-09soldstatus $15,000
-
2014-02-10soldstatus $17,500
ⓘ Source: listings_history table (triggers on properties + properties_extension) + one-shot
backfill from property_details.listing_events for pre-trigger history.
Tax reassessment forecast PA · Partial reset (capped growth)
- Current annual tax
- $881 · $73/mo
- Projected year-2 tax
- $881 · $73/mo
- Expected delta
- $0/yr ($0/mo · 0.0%)
ⓘ Screening estimate from a state-policy table — verify with the county assessor before closing.
Climate risk First Street
- Flood 9/10 Extreme FEMA zone X (unshaded) · 99% chance over 30 yrs
- Wildfire 1/10 Low
- Heat 4/10 Moderate 7 d/yr ≥97°F today · 20 d/yr by 30 yrs out
- Wind 2/10 Low
- Air quality 4/10 Moderate 5 unhealthy d/yr today · 7 by 30 yrs out
Nearby sold comps map
Loading sold comps map…
Walkable amenities ~0.75 mi
Loading nearby amenities…
Taxation est. · year 1
- Rental income
- $18,544
- − Mortgage interest
- −$3,081
- − Property taxes
- −$881
- − Insurance
- −$942
- − Repairs & maintenance
- −$1,484
- − Management
- −$1,484
- − Depreciation
- −$1,600
- Taxable income
- $9,074
- Est. tax owed @ 24.0%
- −$2,178
- After-tax cash flow
- $7,189/yr
For passive investors: Depreciation is non-cash, so a rental often shows a tax loss while cash-flowing — sheltering income. Rental losses are passive: they offset passive income freely, and up to $25,000/yr can offset ordinary (W-2) income if you actively participate and your MAGI is under $100k (phasing out to $0 by $150k); unused losses carry forward. On sale, claimed depreciation is recaptured at up to 25%, and gains may owe capital-gains tax (a 1031 exchange can defer both). Figures are a year-1 estimate at your 24.0% rate — not tax advice; consult a CPA.
Schools (NCES district)
- District
- Woodland Hills SD
- NCES district ID
- 4216500
- Math proficiency
- 13% ▼ -13.00%
- Reading proficiency
- 30% ▼ -10.00%
- Median HH income
- $41,803
- Composite
- 18.31/100
- National rank
- #8954
- State rank
- #486 of 539 in PA
Livability — Turtle Creek
- Score
- 69/100
- State rank
- #807
- US rank
- #8228
Category grades
Schools grade is shown separately in the Schools card above.
Census & demographics
- Census place
- Turtle Creek, PA
- County
- Allegheny County · 1,022,028 people
- City population
- 6,695
- Metro
- Pittsburgh, PA
- Population (ZIP)
- 6,695
- Household income
- $49,628
- Rent vs Own
- Severe rent burden
- 344.0
Population outlook (Allegheny County) Hauer SSP2
- Today (2025)
- 1,250,282 people
- By 2030
- 1,256,482 · +0.5%
- By 2040
- 1,256,318 · +0.5%
- By 2050
- 1,244,169 · -0.5%
- By 2075
- 1,197,693 · -4.2%
- By 2100
- 1,093,187 · -12.6%
Race, ethnicity, and origin ACS 2023
- Neighborhood character
- Majority White (64%)
- Race & ethnicity
- White 64% Black 22% Two or more races 11% Asian 2%
- Common ancestry
- Romanian 6% Slovene 1% Scotch-Irish 1%
- Foreign-born
- 2% · Canada
- Languages at home
- 96% English-only · Spanish 2% German/W. Germanic 1%
Political lean MEDSL · Allegheny
- 2024 margin
- Strong D (+20.3) · D 59.7% · R 39.4%
- 2008→2024 swing
- +4.8pp toward D · 2008: 15.5pp · 2024: 20.3pp
- All cycles
- 2024: D+20.3 2020: D+20.4 2016: D+16.4 2012: D+14.4 2008: D+15.5
Not yet ingested
- Civics
- —
Market trends
- HPI YoY
- ▼ -73.67%
- Current HPI
- 162.0452
- Rent YoY
- —
- Metro
- Pittsburgh, PA
- State GDP YoY
- ▲ 1.68%
- F500 in state
- 34
Industry mix (Fortune 500 HQ in PA)
| Industry | F500 HQs | Revenue |
|---|---|---|
| Healthcare | 2 | $309B |
|
||
| Insurance | 2 | $27B |
|
||
| Telecommunications / Media | 1 | $124B |
|
||
| Industrial Distribution | 1 | $22B |
|
||
| Financial Services | 1 | $20B |
|
||
| Chemicals / Materials | 1 | $18B |
|
||
Price history
+214.3% since first listed3 events — show timeline
- 2026-03-14 Listed $55,000 West Penn MLS
- 2025-12-09 Sold (Public Records) $15,000 Public Records
- 2014-02-10 Sold (Public Records) $17,500 Public Records
Property tax history
+2.1%/yrLatest (2026): $881 · +3.1% YoY. Source: county tax records.
Cash-flow waterfall
monthlySold comps — $/sqft
last 12 mo · ≤1 miLoading sold comps…