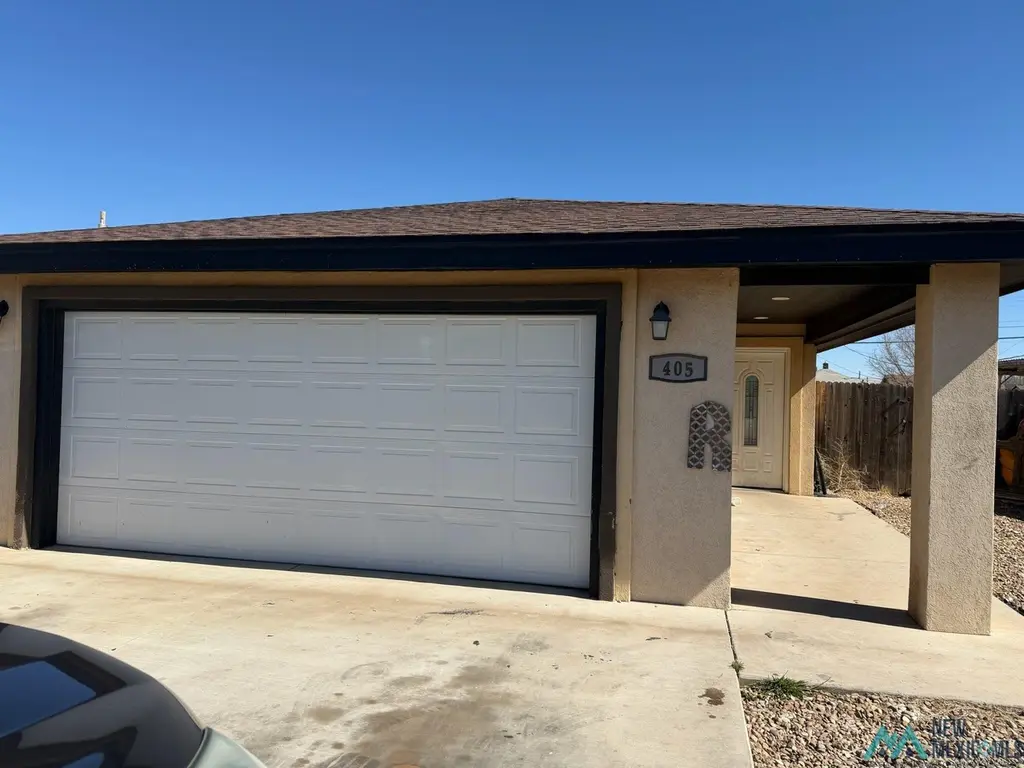
405 N Thornton St · Clovis, NM
Flood risk 1/10 · Minimal
- FEMA flood zone
- X (unshaded)
- Chance of flooding over 30 yrs
- 0.0%
- Est. flood insurance / yr
- $507 – $1,088
Fire risk 5/10 · Moderate
- Est. fire insurance / yr
- $706 – $1,312
Heat risk 5/10 · Moderate
- Hot days now (above 97°F)
- 7 days/yr
- Hot days in 30 yrs
- 20 days/yr
Wind risk 2/10 · Minimal
- Chance of severe wind over 30 yrs
- —
Air-quality risk 1/10 · Minimal
- Unhealthy air days now
- 0 days/yr
- Unhealthy air days in 30 yrs
- 0 days/yr
Risk factors via First Street. Map © Google.
Why this score? — see what drove the D- grade
The composite is a weighted blend of 9 inputs, each scored 0–100. Each bar is that input's sub-score; the figure is the points it added to the 100-point composite (weight × sub-score).
- Cash flow +12.7/30.0
- ARV discount +7.5/15.0
- Rent growth +3.9/5.0
- DSCR +3.8/10.0
- Schools +3.4/10.0
- 1% rule +2.9/10.0
- Livability +2.8/5.0
- Condition / age +2.5/5.0
- Appreciation +0.0/10.0
$150,000
🖨 Deal sheet 📄 Offer letter ✓ Due diligence
Listing remarks
Welcome to this beautifully maintained 3-bedroom, 2-bath home built in 2019, offering approximately 1,242 sq ft of comfortable living space in the heart of Clovis. This single-story property features an open and functional layout, an attached 2-car garage, and a bright living area designed for everyday comfort. Enjoy low-maintenance landscaping, a fenced backyard, and a move-in ready interior perfect for homeowners or investors alike. Conveniently located near local schools, shopping, dining, and everyday amenities, this home offers both practicality and value. Schedule your private showing today!
Key facts
- Fenced backyard
- 6,969 sq ft lot
- 2 garage spots
Tags
Property features AI
Exterior
- Parking: Attached 2-car garage; 2 covered parking spaces (2 total parking spaces)
- Utilities: Public water; Electricity connected; Sewer connected
- Home design: Single-family residence; One story / single level
- Construction: Concrete and stucco construction; Built on one level
- Exterior features: Fenced yard (block and wood fencing); Shingle roof
Interior
- Kitchen: Dishwasher; Microwave; Free-standing range; Refrigerator
- Flooring: Carpet; Tile
- Bathrooms: 2 full bathrooms
- Heating & cooling: Forced air heating (electric); Electric cooling; Ceiling fan cooling
- Interior features: Ceiling fans; Walk-in closets
Neighborhood map
What this means for you Summary
Snapshot
- This is a 3-bed/2.0-bath other listed at $150k.
Deal economics
- At list price, monthly cash flow is $-18 ($-214/yr) — negative.
- To cash-flow at today's rent, offer at most $147k (2.1% below list).
- To meet the 1% rule (rent ≥ 1% of price), the offer needs to be $119k (20.6% below list).
- Recommended offer: $119k (20.6% below list) — sets the bar for 1% rule.
Location & tenants
- Location reads 56/100 on livability (#171 in NM) — a working-class tenant base; expect higher turnover. Strengths: cost of living A+, housing A+; Watch: health & safety C-, schools F, crime F.
- Clovis Municipal Schools (town): math 31% / reading 49% proficiency, ranked #13 of 29 in NM (top 45%) — families likely to look elsewhere, expect single-tenant / working-renter base with shorter leases; 66% free/reduced lunch — lower-income household profile, screen leases tightly.
- Market conditions: Rents rising fast (+5.5%/yr); 464 active listings in the ZIP; 5 comparable units currently listed for rent nearby; rentals lingering (median 44d on market — plan ~5-8 weeks vacancy on turnover, expect pricing pressure); 100% of comp listings sitting > 30 days — soft ceiling on asking rent; 169 units permitted in Curry County in 2024 (0 in 5+ unit buildings).
Forward outlook
- Local home prices are declining (-3.0%/yr); year-one equity from $1k of loan paydown is wiped out by about $4k of value loss. Plan a longer hold.
- Curry County population projected at -13% by 2050 — secular population decline; favor cash flow + early exit over multi-decade hold.
Negotiation context
- Only 2 days on market — expect competitive offers; lowballing is unlikely to land.
Risks & watch-outs
- Climate carrying-cost: moderate wildfire risk; extreme-heat days projected 7→20/yr by 2055 (HVAC capex compounding) — expect insurance premiums to compound above CPI over the hold.
Questions for the listing agent
- What do current leases actually rent for vs. the listed asking? Can we see a recent rent roll and the last 12 months of T-12 income?
- Is there a deadline driving the sale (1031 exchange, divorce, estate, relocation)? That informs how much negotiation room exists.
- Schools are F-rated, which usually means shorter tenancies and higher turnover. Who's the typical renter profile here, and what's been the actual vacancy rate?
- Crime grade is F in this area — have there been break-ins, vandalism, or insurance claims at this property in the last 3 years? What carrier currently insures it and at what premium?
- The area grade is low — what's the realistic commute time and amenity access for the typical tenant pool here? Any planned neighborhood developments (good or bad) we should know about?
- What's the average days-on-market for RENTAL listings here right now (not sales)? A rising rental-DOM trend means longer vacancies and softer asking-rent achievability than the comps imply.
- What's the recent tenant-quality profile in this submarket — average credit score on applications, eviction rate, late-payment / NSF rate, and stable-employment percentage? A property-management company in the area should have these aggregated.
- How much new for-sale + rental construction is in the pipeline within 1–3 miles? Heavy new supply typically softens prices + rents 12–24 months out; constrained supply supports both.
Investment metrics
- 1% rule
- 0.79% ✗
- Cap rate
- 6.15%
- Cash-on-cash
- -0.51%
- DSCR
- 0.98
- GRM
- 10.5
CMA / ARV
No comps found within radius.
Projected returns pro-forma
-3.0% appreciation · 5.54% rent growth · sell at horizon
- IRR
- -14.6%
- Equity multiple
- 0.47×
- Total profit
- $-22,349
- Equity at exit
- $22,365
- IRR
- -2.4%
- Equity multiple
- 0.82×
- Total profit
- $-7,552
- Equity at exit
- $12,969
Cash invested: $42,000 (down + closing). Projections, not guarantees.
Landlord ↔ Tenant lean methodology
- Overall (STATE)
- 55 Moderately Landlord-Leaning
- State New Mexico
- 55 Moderately Landlord-Leaning · D+3
- County
- — inherits STATE
- City
- — inherits STATE
ZIP-level market 88101
- Rents YoY
- 5.5%
- Active inventory
- 464
- Price-to-rent
- 10.5×
Monthly cashflow live
- Estimated rent
- $1,191 medium interval (Pro) →
- Mortgage (P&I)
- −$787
- Tax from tax record
- −$110 /mo · $1,315/yr
- Insurance
- −$62
- HOA
- −$0
- Vacancy / Maint / Mgmt
- −$250
- Net cashflow
- $-18
Break-even live
UW: 25.0% down · 7.5% · 30yr · 1.5% tax · 5.0% vac · 8.0% maint · 8.0% mgmt
Financing live
Cash to close
- Down payment
- $37,500
- Closing costs
- $4,500
- Reserves months
- —
- Total cash needed
- —
Loan-product check · same deal, 3 products live
Conventional
25% down · 7.5% · 30yr
- Down + closing
- —
- Monthly P&I
- —
- Monthly cashflow
- —
- DSCR
- —
- Eligible?
- —
Personal DTI + credit; lowest rate.
DSCR
20% down · 8.5% · 30yr
- Down + closing
- —
- Monthly P&I
- —
- Monthly cashflow
- —
- DSCR
- —
- Eligible?
- —
No personal income docs; deal must DSCR.
Hard money
10% down · 12.0% · 12mo
- Down + closing
- —
- Monthly P&I
- —
- Monthly cashflow
- —
- DSCR
- —
- Eligible?
- —
Short-term bridge; refi at stabilization.
Rent comps 5 comps
| Address | Beds | Baths | Sqft | Rent | $/sqft | DOM | Units | Dist |
|---|---|---|---|---|---|---|---|---|
| 401 E 5th St Unit 5 Clovis, NM | 2.0 | 1.0 | 800 | $850 | $1.06 | 43d | 1 | 0.74mi |
| 1808 Debra St Clovis, NM | 3.0 | 2.5 | 1412 | $1,400 | $0.99 | 43d | 1 | 1.06mi |
| 1500 Echols Ave Clovis, NM | 2.0 | 1.0–2.0 | 912 | $948 | $1.04 | 43d | 5 | 1.10mi |
| 2100 Mitchell St Unit 14 Clovis, NM | 2.0 | 1.0 | 743 | $750 | $1.01 | 43d | 1 | 1.24mi |
| 109 State Ave Clovis, NM | 2.0 | 1.0 | 816 | $2,000 | $2.45 | 43d | 1 | 1.44mi |
Listing history 2 events
-
2026-05-26$150,000 Active
-
2021-08-05soldstatus
ⓘ Source: listings_history table (triggers on properties + properties_extension) + one-shot
backfill from property_details.listing_events for pre-trigger history.
Tax reassessment forecast NM · Resets to sale price
- Current annual tax
- $1,315 · $110/mo
- Projected year-2 tax
- $1,315 · $110/mo
- Expected delta
- $0/yr ($0/mo · 0.0%)
ⓘ Screening estimate from a state-policy table — verify with the county assessor before closing.
Climate risk First Street
- Flood 1/10 Low FEMA zone X (unshaded) · 0% chance over 30 yrs
- Wildfire 5/10 Major
- Heat 5/10 Major 7 d/yr ≥97°F today · 20 d/yr by 30 yrs out
- Wind 2/10 Low
- Air quality 1/10 Low 0 unhealthy d/yr today · 0 by 30 yrs out
Nearby sold comps map
Loading sold comps map…
Walkable amenities ~0.75 mi
Loading nearby amenities…
Taxation est. · year 1
- Rental income
- $14,292
- − Mortgage interest
- −$8,402
- − Property taxes
- −$1,315
- − Insurance
- −$750
- − Repairs & maintenance
- −$1,143
- − Management
- −$1,143
- − Depreciation
- −$4,364
- Taxable loss
- −$2,826
- Est. tax savings @ 24.0%
- +$678
- After-tax cash flow
- $464/yr
For passive investors: Depreciation is non-cash, so a rental often shows a tax loss while cash-flowing — sheltering income. Rental losses are passive: they offset passive income freely, and up to $25,000/yr can offset ordinary (W-2) income if you actively participate and your MAGI is under $100k (phasing out to $0 by $150k); unused losses carry forward. On sale, claimed depreciation is recaptured at up to 25%, and gains may owe capital-gains tax (a 1031 exchange can defer both). Figures are a year-1 estimate at your 24.0% rate — not tax advice; consult a CPA.
Schools (NCES district)
- District
- Clovis Municipal Schools
- NCES district ID
- 3500570
- Math proficiency
- 31% ▲ 6.00%
- Reading proficiency
- 49% ▲ 14.00%
- Median HH income
- $40,532
- Composite
- 33.52/100
- National rank
- #5435
- State rank
- #13 of 29 in NM
Livability — Clovis
- Score
- 56/100
- State rank
- #171
- US rank
- #22374
Category grades
Schools grade is shown separately in the Schools card above.
Census & demographics
- Census place
- Clovis, NM
- County
- Curry County · 44,846 people
- City population
- 44,846
- Metro
- Clovis, NM
- Population (ZIP)
- 44,846
- Household income
- $56,587
- Rent vs Own
- Severe rent burden
- 1724.0
Population outlook (Curry County) Hauer SSP2
- Today (2025)
- 48,742 people
- By 2030
- 47,759 · -2.0%
- By 2040
- 45,444 · -6.8%
- By 2050
- 42,403 · -13.0%
- By 2075
- 33,878 · -30.5%
- By 2100
- 22,414 · -54.0%
Race, ethnicity, and origin ACS 2023
- Neighborhood character
- Diverse neighborhood (Simpson 0.60)
- Race & ethnicity
- Hispanic / Latino 47% White 42% Two or more races 14% Black 5% Asian 2% Native American 1%
- Hispanic origin (detail)
- Mexican 36%
- Common ancestry
- Slovak 2% Romanian 2% Lithuanian 1%
- Foreign-born
- 8% · Canada
- Languages at home
- 73% English-only · Spanish 25%
Political lean MEDSL · Curry
- 2024 margin
- Solid R (+42.6) · D 27.8% · R 70.4% · Other 1.8%
- 2008→2024 swing
- -8.5pp toward R · 2008: -34.1pp · 2024: -42.6pp
- All cycles
- 2024: R+42.6 2020: R+40.6 2016: R+42.4 2012: R+38.6 2008: R+34.1
Not yet ingested
- Civics
- —
Market trends
- HPI YoY
- ▼ -150.79%
- Current HPI
- 121.1877
- Rent YoY
- ▲ 5.54%
- Metro
- Clovis, NM
- State GDP YoY
- —
- F500 in state
- 0
Price history
2 events — show timeline
- 2026-05-26 Listed $150,000 NMMLS
- 2021-08-05 Sold (Public Records) — Public Records
Property tax history
+53.0%/yrLatest (2025): $1,315 · +3.8% YoY. Source: county tax records.
Cash-flow waterfall
monthlySold comps — $/sqft
last 12 mo · ≤1 miLoading sold comps…