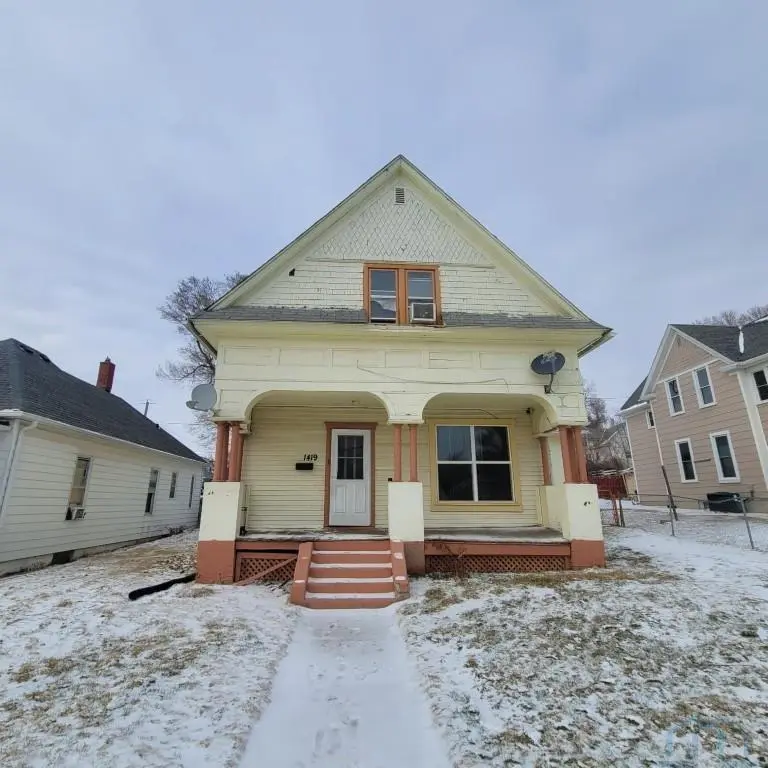
1419 W 4th St · Sioux City, IA
Flood risk 1/10 · Minimal
- FEMA flood zone
- X (unshaded)
- Chance of flooding over 30 yrs
- 0.0%
- Est. flood insurance / yr
- $473 – $860
Fire risk 4/10 · Minor
- Est. fire insurance / yr
- $902 – $1,676
Heat risk 3/10 · Minor
- Hot days now (above 103°F)
- 7 days/yr
- Hot days in 30 yrs
- 15 days/yr
Wind risk 2/10 · Minimal
- Chance of severe wind over 30 yrs
- —
Air-quality risk 1/10 · Minimal
- Unhealthy air days now
- 0 days/yr
- Unhealthy air days in 30 yrs
- 0 days/yr
Risk factors via First Street. Map © Google.
Why this score? — see what drove the B grade
The composite is a weighted blend of 9 inputs, each scored 0–100. Each bar is that input's sub-score; the figure is the points it added to the 100-point composite (weight × sub-score).
- Cash flow +30.0/30.0
- 1% rule +10.0/10.0
- DSCR +10.0/10.0
- ARV discount +7.5/15.0
- Schools +4.7/10.0
- Livability +3.9/5.0
- Rent growth +2.5/5.0
- Condition / age +2.5/5.0
- Appreciation +0.0/10.0
$74,900
🖨 Deal sheet 📄 Offer letter ✓ Due diligence
Listing remarks MLS
This listing is a wholesale listing! This home at 1419 W 4th St offers a generous layout with 5 bedrooms and 2 bathrooms across 1,910 sq. ft. of living space. The main floor features durable ceramic tile, while the remaining rooms are finished with easy-to-maintain laminate flooring. The functional kitchen includes laminate countertops and is fully equipped with a refrigerator, stove, and microwave. Additional conveniences include an in-home washer and dryer, and an unfinished basement for extra storage. Outside, you'll find wood siding and no HOA restrictions.
Key facts
- 5,992 sq ft lot
- Garage
- Built 1900
Neighborhood map
What this means for you Summary
Snapshot
- This is a 5-bed/2.0-bath single-family listed at $75k.
Deal economics
- At list price, monthly cash flow is $619 ($7k/yr) — positive.
- The deal already cash-flows at list — no discount required.
- Meets the 1% rule at list price ($2k rent vs $75k).
- Recommended offer: $70k (6.0% below list) — sets the bar for market timing.
- Cap rate 16.2% vs local median 3.7% in Sioux City — top-decile yield for the area; either an underpriced asset or a hidden risk that comps aren't pricing in. Stress-test before assuming the spread holds.
Location & tenants
- Location reads 78/100 on livability (#138 in IA, #2,544 nationally) — a middle-class / working-renter tenant base. Strengths: cost of living A+, housing A+, health & safety A+; Watch: crime F, commute F.
- Sioux City Community School District (urban): math 54% / reading 57% proficiency, ranked #264 of 289 in IA (top 91%) — acceptable for families but not a draw, mixed tenant base, ~2y average lease.
- Market conditions: 79 active listings in the ZIP; 170 units permitted in Woodbury County in 2024 (90 in 5+ unit buildings).
Forward outlook
- Local home prices are declining (-3.0%/yr); year-one equity from $518 of loan paydown is wiped out by about $2k of value loss. Plan a longer hold.
- At projected returns (-3.0% appreciation + 3.0% rent growth), your $21k cash investment doubles in ~4 years — after that, you're playing with house money.
Negotiation context
- It's been on market 82 days — a 6% lower offer ($70k) is reasonable based on typical stale-listing flexibility.
Risks & watch-outs
- Watch-outs: property tax is 2.7% of price; built in 1900 — expect roof / HVAC / electrical / plumbing capex.
Questions for the listing agent
- It's been on market 82 days. Have you received any prior offers? Is the seller open to a 6% concession, seller financing, or rate buy-down credit?
- Built in 1900 — when were the roof, HVAC, electrical panel, plumbing, and water heater last replaced?
- Property tax is high relative to price — has the assessment been appealed recently, and will the sale trigger a re-assessment?
- Why hasn't it sold? Are there any deal-killer items the seller is aware of (foundation, flood, title, zoning, code violations)?
- Is there a deadline driving the sale (1031 exchange, divorce, estate, relocation)? That informs how much negotiation room exists.
- Crime grade is F in this area — have there been break-ins, vandalism, or insurance claims at this property in the last 3 years? What carrier currently insures it and at what premium?
- What's the average days-on-market for RENTAL listings here right now (not sales)? A rising rental-DOM trend means longer vacancies and softer asking-rent achievability than the comps imply.
- What's the recent tenant-quality profile in this submarket — average credit score on applications, eviction rate, late-payment / NSF rate, and stable-employment percentage? A property-management company in the area should have these aggregated.
- How much new for-sale + rental construction is in the pipeline within 1–3 miles? Heavy new supply typically softens prices + rents 12–24 months out; constrained supply supports both.
Investment metrics
- 1% rule
- 2.05% ✓
- Cap rate
- 16.21%
- Cash-on-cash
- 35.42%
- DSCR
- 2.58
- GRM
- 4.1
CMA / ARV
- ARV (median comp)
- $161,054
- List price
- $74,900
- Delta
- -53.49%
- Verdict
- UNDERPRICED
- Comps
- 20 within 1.0 mi
Show comp detail 12 sales within ~0.75 mi
| Address | Dist | Beds/Ba | Sqft | Sold | Price | $/sf | Match |
|---|---|---|---|---|---|---|---|
| 1712 W 1st St | 0.32mi | 5/2.0 | 1,799 (-6%) | 1mo | $200,000 | $111 | 74 |
| 210 Ross St | 0.16mi | 5/2.5 | 2,128 (+11%) | 0mo | $180,000 | $85 | 71 |
| 1400 W 6th St | 0.16mi | 4/1.5 (-1) | 1,800 (-6%) | 12mo | $235,000 | $131 | 66 |
| 1422 W 5th St | 0.08mi | 4/1.5 (-1) | 1,624 (-15%) | 9mo | $155,000 | $95 | 56 |
| 1201 W 4th St | 0.19mi | 4/2.0 (-1) | 2,127 (+11%) | 20mo | $110,000 | $52 | 51 |
| 1408 Ruby St | 0.48mi | 4/1.0 (-1) | 1,768 (-7%) | 7mo | $167,000 | $94 | 50 |
| 1609 W 15th St | 0.42mi | 5/2.0 | 1,648 (-14%) | 10mo | $148,000 | $90 | 49 |
| 1901 Allan St | 0.74mi | 4/2.5 (-1) | 1,858 (-3%) | 6mo | $240,000 | $129 | 48 |
| 1421 W 15th St | 0.39mi | 4/2.0 (-1) | 1,632 (-15%) | 6mo | $156,500 | $96 | 47 |
| 1913 George St | 0.73mi | 5/2.0 | 1,703 (-11%) | 4mo | $160,000 | $94 | 45 |
| 1821 W 15th St | 0.50mi | 4/1.5 (-1) | 1,772 (-7%) | 24mo | $196,000 | $111 | 38 |
| 2105 W 5th St | 0.50mi | 4/1.8 (-1) | 1,680 (-12%) | 18mo | $150,000 | $89 | 36 |
Match score weights: distance 35% · size 25% · config 20% · recency 20%. Top-matched comps best support the ARV.
Projected returns pro-forma
-3.0% appreciation · 3.0% rent growth · sell at horizon
- IRR
- 31.1%
- Equity multiple
- 2.30×
- Total profit
- $27,355
- Equity at exit
- $11,168
- IRR
- 38.3%
- Equity multiple
- 4.57×
- Total profit
- $74,866
- Equity at exit
- $6,476
Cash invested: $20,972 (down + closing). Projections, not guarantees.
Landlord ↔ Tenant lean methodology
- Overall (STATE)
- 83 Strongly Landlord-Friendly
- State Iowa
- 83 Strongly Landlord-Friendly · R+6
- County
- — inherits STATE
- City
- — inherits STATE
ZIP-level market 51103
- Home prices YoY
- -23.0%
- Active inventory
- 79
- Price-to-rent
- 4.1×
Monthly cashflow live
- Estimated rent
- $1,535 medium interval (Pro) →
- Mortgage (P&I)
- −$393
- Tax from tax record
- −$169 /mo · $2,033/yr
- Insurance
- −$31
- HOA
- −$0
- Vacancy / Maint / Mgmt
- −$322
- Net cashflow
- $619
Break-even live
UW: 25.0% down · 7.5% · 30yr · 1.5% tax · 5.0% vac · 8.0% maint · 8.0% mgmt
Financing live
Cash to close
- Down payment
- $18,725
- Closing costs
- $2,247
- Reserves months
- —
- Total cash needed
- —
Loan-product check · same deal, 3 products live
Conventional
25% down · 7.5% · 30yr
- Down + closing
- —
- Monthly P&I
- —
- Monthly cashflow
- —
- DSCR
- —
- Eligible?
- —
Personal DTI + credit; lowest rate.
DSCR
20% down · 8.5% · 30yr
- Down + closing
- —
- Monthly P&I
- —
- Monthly cashflow
- —
- DSCR
- —
- Eligible?
- —
No personal income docs; deal must DSCR.
Hard money
10% down · 12.0% · 12mo
- Down + closing
- —
- Monthly P&I
- —
- Monthly cashflow
- —
- DSCR
- —
- Eligible?
- —
Short-term bridge; refi at stabilization.
Listing history 16 events
-
2026-06-16days on market $74,900 Active 82 DOM
-
2026-06-15days on market $74,900 Active 81 DOM
-
2026-06-14days on market $74,900 Active 79 DOM
-
2026-06-12days on market $74,900 Active 78 DOM
-
2026-06-09days on market $74,900 Active 75 DOM
-
2026-06-08days on market $74,900 Active 74 DOM
-
2026-06-07days on market $74,900 Active 73 DOM
-
2026-06-05days on market $74,900 Active 70 DOM
-
2026-06-02days on market $74,900 Active 68 DOM
-
2026-06-01days on market $74,900 Active 67 DOM
-
2026-05-31days on market $74,900 Active 66 DOM
-
2026-05-30days on market $74,900 Active 65 DOM
-
2026-05-04price $84,000 567-char remark
Show marketing remark (567 chars)
This listing is a wholesale listing! This home at 1419 W 4th St offers a generous layout with 5 bedrooms and 2 bathrooms across 1,910 sq. ft. of living space. The main floor features durable ceramic tile, while the remaining rooms are finished with easy-to-maintain laminate flooring. The functional kitchen includes laminate countertops and is fully equipped with a refrigerator, stove, and microwave. Additional conveniences include an in-home washer and dryer, and an unfinished basement for extra storage. Outside, you'll find wood siding and no HOA restrictions.
-
2026-04-25price $89,900 567-char remark
Show marketing remark (567 chars)
This listing is a wholesale listing! This home at 1419 W 4th St offers a generous layout with 5 bedrooms and 2 bathrooms across 1,910 sq. ft. of living space. The main floor features durable ceramic tile, while the remaining rooms are finished with easy-to-maintain laminate flooring. The functional kitchen includes laminate countertops and is fully equipped with a refrigerator, stove, and microwave. Additional conveniences include an in-home washer and dryer, and an unfinished basement for extra storage. Outside, you'll find wood siding and no HOA restrictions.
-
2026-04-15price $99,900 567-char remark
Show marketing remark (567 chars)
This listing is a wholesale listing! This home at 1419 W 4th St offers a generous layout with 5 bedrooms and 2 bathrooms across 1,910 sq. ft. of living space. The main floor features durable ceramic tile, while the remaining rooms are finished with easy-to-maintain laminate flooring. The functional kitchen includes laminate countertops and is fully equipped with a refrigerator, stove, and microwave. Additional conveniences include an in-home washer and dryer, and an unfinished basement for extra storage. Outside, you'll find wood siding and no HOA restrictions.
-
2026-03-26$109,900 Active 567-char remark
Show marketing remark (567 chars)
This listing is a wholesale listing! This home at 1419 W 4th St offers a generous layout with 5 bedrooms and 2 bathrooms across 1,910 sq. ft. of living space. The main floor features durable ceramic tile, while the remaining rooms are finished with easy-to-maintain laminate flooring. The functional kitchen includes laminate countertops and is fully equipped with a refrigerator, stove, and microwave. Additional conveniences include an in-home washer and dryer, and an unfinished basement for extra storage. Outside, you'll find wood siding and no HOA restrictions.
ⓘ Source: listings_history table (triggers on properties + properties_extension) + one-shot
backfill from property_details.listing_events for pre-trigger history.
Tax reassessment forecast IA · Partial reset (capped growth)
- Current annual tax
- $2,033 · $169/mo
- Projected year-2 tax
- $2,033 · $169/mo
- Expected delta
- $0/yr ($0/mo · 0.0%)
ⓘ Screening estimate from a state-policy table — verify with the county assessor before closing.
Climate risk First Street
- Flood 1/10 Low FEMA zone X (unshaded) · 0% chance over 30 yrs
- Wildfire 4/10 Moderate
- Heat 3/10 Moderate 7 d/yr ≥103°F today · 15 d/yr by 30 yrs out
- Wind 2/10 Low
- Air quality 1/10 Low 0 unhealthy d/yr today · 0 by 30 yrs out
Nearby sold comps map
Loading sold comps map…
Walkable amenities ~0.75 mi
Loading nearby amenities…
Taxation est. · year 1
- Rental income
- $18,416
- − Mortgage interest
- −$4,196
- − Property taxes
- −$2,033
- − Insurance
- −$374
- − Repairs & maintenance
- −$1,473
- − Management
- −$1,473
- − Depreciation
- −$2,179
- Taxable income
- $6,687
- Est. tax owed @ 24.0%
- −$1,605
- After-tax cash flow
- $5,823/yr
For passive investors: Depreciation is non-cash, so a rental often shows a tax loss while cash-flowing — sheltering income. Rental losses are passive: they offset passive income freely, and up to $25,000/yr can offset ordinary (W-2) income if you actively participate and your MAGI is under $100k (phasing out to $0 by $150k); unused losses carry forward. On sale, claimed depreciation is recaptured at up to 25%, and gains may owe capital-gains tax (a 1031 exchange can defer both). Figures are a year-1 estimate at your 24.0% rate — not tax advice; consult a CPA.
Schools (NCES district)
- District
- Sioux City Community School District
- NCES district ID
- 1926400
- Math proficiency
- 54% ▼ -7.00%
- Reading proficiency
- 57% ▼ -2.00%
- Median HH income
- $44,967
- Composite
- 46.86/100
- National rank
- #2371
- State rank
- #264 of 289 in IA
Livability — Sioux City
- Score
- 78/100
- State rank
- #138
- US rank
- #2544
Category grades
Schools grade is shown separately in the Schools card above.
Census & demographics
- Census place
- Sioux City, IA
- City population
- 51,789
- Population (ZIP)
- 17,145
Population outlook (Woodbury County) Hauer SSP2
- Today (2025)
- 103,226 people
- By 2030
- 103,060 · -0.2%
- By 2040
- 102,533 · -0.7%
- By 2050
- 102,788 · -0.4%
- By 2075
- 107,227 · +3.9%
- By 2100
- 113,980 · +10.4%
Race, ethnicity, and origin ACS 2023
- Neighborhood character
- Diverse neighborhood (Simpson 0.62)
- Race & ethnicity
- White 53% Hispanic / Latino 31% Two or more races 18% Asian 4% Black 4% Native American 4%
- Hispanic origin (detail)
- Mexican 20%
- Common ancestry
- Iranian 3% Portuguese 3% Slovak 2%
- Foreign-born
- 16% · Canada, Vietnam
- Languages at home
- 70% English-only · Spanish 23% Vietnamese 3% German/W. Germanic 1%
Political lean MEDSL · Woodbury
- 2024 margin
- Strong R (+23.0) · D 37.8% · R 60.9% · Other 1.3%
- 2008→2024 swing
- -22.5pp toward R · 2008: -0.5pp · 2024: -23.0pp
- All cycles
- 2024: R+23.0 2020: R+15.5 2016: R+19.9 2012: R+0.2 2008: R+0.5
Not yet ingested
- Civics
- —
Market trends
- HPI YoY
- ▼ -78.41%
- Current HPI
- 262.3809
- Rent YoY
- —
- Metro
- —
- State GDP YoY
- ▲ 2.48%
- F500 in state
- 4
Industry mix (Fortune 500 HQ in IA)
| Industry | F500 HQs | Revenue |
|---|---|---|
| Financial Services | 1 | $16B |
|
||
| Retail / Convenience | 1 | $15B |
|
||
Price history
-23.6% since first listed4 events — show timeline
- 2026-05-04 Price Changed $84,000 NWIA
- 2026-04-25 Price Changed $89,900 NWIA
- 2026-04-15 Price Changed $99,900 NWIA
- 2026-03-26 Listed $109,900 NWIA
Property tax history
+7.1%/yrLatest (2025): $2,033 · +16.3% YoY. Source: county tax records.
Cash-flow waterfall
monthlySold comps — $/sqft
last 12 mo · ≤1 miLoading sold comps…