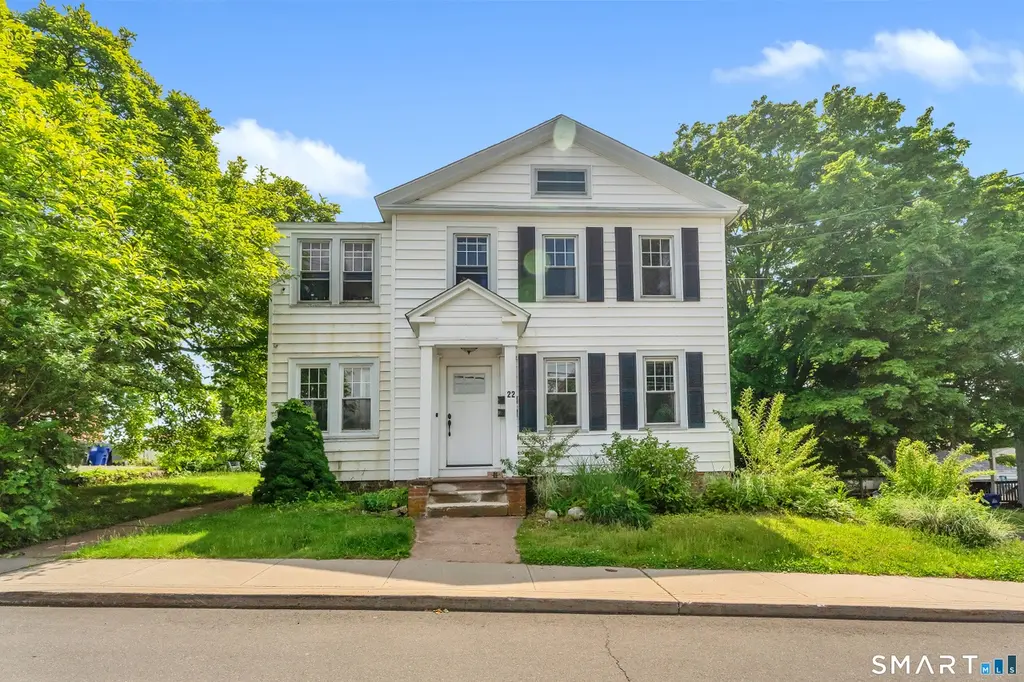
22 Hillside Ave · Branford Center, CT
Flood risk 1/10 · Minimal
- FEMA flood zone
- X (unshaded)
- Chance of flooding over 30 yrs
- 0.0%
- Est. flood insurance / yr
- $473 – $860
Fire risk 1/10 · Minimal
- Est. fire insurance / yr
- $829 – $1,539
Heat risk 7/10 · Major
- Hot days now (above 96°F)
- 7 days/yr
- Hot days in 30 yrs
- 18 days/yr
Wind risk 6/10 · Moderate
- Chance of severe wind over 30 yrs
- 64.0%
Air-quality risk 4/10 · Minor
- Unhealthy air days now
- 5 days/yr
- Unhealthy air days in 30 yrs
- 7 days/yr
Risk factors via First Street. Map © Google.
Why this score? — see what drove the D+ grade
The composite is a weighted blend of 9 inputs, each scored 0–100. Each bar is that input's sub-score; the figure is the points it added to the 100-point composite (weight × sub-score).
- ARV discount +13.5/15.0
- Cash flow +12.1/30.0
- Rent growth +5.0/5.0
- Schools +4.2/10.0
- Livability +4.0/5.0
- DSCR +3.6/10.0
- 1% rule +3.0/10.0
- Condition / age +2.5/5.0
- Appreciation +0.0/10.0
$514,900
🖨 Deal sheet 📄 Offer letter ✓ Due diligence
Listing remarks MLS
Was 2 family, can easily be converted back to legal 2 family. Property being sold as is. May be subject to probate court approval. Fabulous in town location. See m9083534
Key facts
- 9,583 sq ft lot
- Built 1880
- Listed 4 days
Property features AI
Finance
- Financial info: Multi-family property with 2 units
Exterior
- Utilities: Public water connected; Public sewer connected; Natural gas
- Home design: Multi-family (2-family) property
- Construction: Frame construction; Brick and stone foundation; Asphalt shingle roof; Built before or in 2026
- Exterior features: Porch; Level lot; Vinyl siding
Interior
- Bedrooms: 4 bedrooms
- Bathrooms: 2 full bathrooms
- Heating & cooling: Hot water heating; Natural gas hot water (40-gallon tank)
- Interior features: Full unfinished basement with storage and hatchway access; Attic with access via hatch
- Laundry & utility: Washer/dryer hookups in basement; Washer/dryer included for all units
Neighborhood map
What this means for you Summary
Snapshot
- This is a 4-bed/2.0-bath single-family listed at $515k.
Deal economics
- At list price, monthly cash flow is $-111 ($-1k/yr) — negative.
- To cash-flow at today's rent, offer at most $495k (3.8% below list).
- To meet the 1% rule (rent ≥ 1% of price), the offer needs to be $414k (19.7% below list).
- Recommended offer: $414k (19.7% below list) — sets the bar for 1% rule.
- Cap rate 6.0% vs local median 3.7% in Branford Center — top-decile yield for the area; either an underpriced asset or a hidden risk that comps aren't pricing in. Stress-test before assuming the spread holds.
Location & tenants
- Location reads 81/100 on livability (#16 in CT, #1,386 nationally) — a professional / high-income tenant draw. Strengths: crime A+, health & safety A+, housing B+; Watch: commute D+, cost of living D+.
- Branford School District (suburban): math 41% / reading 52% proficiency, ranked #85 of 153 in CT (top 56%) — families likely to look elsewhere, expect single-tenant / working-renter base with shorter leases; only 18% free/reduced lunch — higher-income household profile.
- Market conditions: Rents rising fast (+10.6%/yr); 114 active listings in the ZIP; 5 comparable units currently listed for rent nearby; rentals leasing fast (median 11d on market — plan ~1-2 weeks tenant-placement turnaround); 40% of comp listings sitting > 30 days — soft ceiling on asking rent; solid renter incomes; 1,059 units permitted in South Central Connecticut Planning Region in 2024 (779 in 5+ unit buildings).
- At $4,137/mo this rent would consume 47% of the median local household income ($105k/yr) (locally 1132% of renters already pay >50% of income on rent) — very limited rent-growth headroom before tenants either downsize or default.
Forward outlook
- Local home prices are declining (-3.0%/yr); year-one equity from $4k of loan paydown is wiped out by about $15k of value loss. Plan a longer hold.
Negotiation context
- Only 4 days on market — expect competitive offers; lowballing is unlikely to land.
- Current owner paid $320k; list at $515k implies a 61% gain — meaningful room to come down on a strong offer.
Risks & watch-outs
- Watch-outs: built in 1880 — expect roof / HVAC / electrical / plumbing capex.
- Climate carrying-cost: major wind risk, 64% chance of damaging wind over 30y; extreme-heat days projected 7→18/yr by 2055 (HVAC capex compounding) — expect insurance premiums to compound above CPI over the hold.
Questions for the listing agent
- What do current leases actually rent for vs. the listed asking? Can we see a recent rent roll and the last 12 months of T-12 income?
- Built in 1880 — when were the roof, HVAC, electrical panel, plumbing, and water heater last replaced?
- Is there a deadline driving the sale (1031 exchange, divorce, estate, relocation)? That informs how much negotiation room exists.
- Schools are B-rated — typically a magnet for longer-tenancy family renters. What's the average tenant stay here, and is there a school-zone premium baked into asking?
- The area grade is low — what's the realistic commute time and amenity access for the typical tenant pool here? Any planned neighborhood developments (good or bad) we should know about?
- What's the average days-on-market for RENTAL listings here right now (not sales)? A rising rental-DOM trend means longer vacancies and softer asking-rent achievability than the comps imply.
- What's the recent tenant-quality profile in this submarket — average credit score on applications, eviction rate, late-payment / NSF rate, and stable-employment percentage? A property-management company in the area should have these aggregated.
- How much new for-sale + rental construction is in the pipeline within 1–3 miles? Heavy new supply typically softens prices + rents 12–24 months out; constrained supply supports both.
Investment metrics
- 1% rule
- 0.80% ✗
- Cap rate
- 6.03%
- Cash-on-cash
- -0.92%
- DSCR
- 0.96
- GRM
- 10.4
CMA / ARV
- ARV (on-the-fly)
- $593,808
- Comps found
- 5
Show comp detail 5 sales within ~0.75 mi
| Address | Dist | Beds/Ba | Sqft | Sold | Price | $/sf | Match |
|---|---|---|---|---|---|---|---|
| 65 Harrison Ave | 0.15mi | 3/2.5 (-1) | 1,915 (-10%) | 23mo | $564,999 | $295 | 50 |
| 15 Hammer Pl | 0.54mi | 3/1.5 (-1) | 1,920 (-10%) | 15mo | $385,000 | $201 | 39 |
| 4 Abbotts Ln | 0.44mi | 4/2.0 | 1,837 (-14%) | 22mo | $585,000 | $318 | 38 |
| 146 Cedar St | 0.52mi | 3/1.5 (-1) | 1,890 (-12%) | 16mo | $380,000 | $201 | 36 |
| 56 Pine Orchard Rd | 0.75mi | 4/2.5 | 1,870 (-12%) | 12mo | $520,000 | $278 | 32 |
Match score weights: distance 35% · size 25% · config 20% · recency 20%. Top-matched comps best support the ARV.
Projected returns pro-forma
-3.0% appreciation · 8.0% rent growth · sell at horizon
- IRR
- -12.6%
- Equity multiple
- 0.52×
- Total profit
- $-68,693
- Equity at exit
- $76,773
- IRR
- 2.4%
- Equity multiple
- 1.21×
- Total profit
- $30,387
- Equity at exit
- $44,519
Cash invested: $144,172 (down + closing). Projections, not guarantees.
Landlord ↔ Tenant lean methodology
- Overall (STATE)
- 27 Tenant-Leaning
- State Connecticut
- 27 Tenant-Leaning · D+7
- County
- — inherits STATE
- City
- — inherits STATE
ZIP-level market 06405
- Rents YoY
- 10.6%
- Active inventory
- 114
- Price-to-rent
- 10.4×
Monthly cashflow live
- Estimated rent
- $4,137 medium interval (Pro) →
- Mortgage (P&I)
- −$2,700
- Tax from tax record
- −$464 /mo · $5,572/yr
- Insurance
- −$215
- HOA
- −$0
- Vacancy / Maint / Mgmt
- −$869
- Net cashflow
- $-111
Break-even live
UW: 25.0% down · 7.5% · 30yr · 1.5% tax · 5.0% vac · 8.0% maint · 8.0% mgmt
Financing live
Cash to close
- Down payment
- $128,725
- Closing costs
- $15,447
- Reserves months
- —
- Total cash needed
- —
Loan-product check · same deal, 3 products live
Conventional
25% down · 7.5% · 30yr
- Down + closing
- —
- Monthly P&I
- —
- Monthly cashflow
- —
- DSCR
- —
- Eligible?
- —
Personal DTI + credit; lowest rate.
DSCR
20% down · 8.5% · 30yr
- Down + closing
- —
- Monthly P&I
- —
- Monthly cashflow
- —
- DSCR
- —
- Eligible?
- —
No personal income docs; deal must DSCR.
Hard money
10% down · 12.0% · 12mo
- Down + closing
- —
- Monthly P&I
- —
- Monthly cashflow
- —
- DSCR
- —
- Eligible?
- —
Short-term bridge; refi at stabilization.
Rent comps 5 comps
| Address | Beds | Baths | Sqft | Rent | $/sqft | DOM | Units | Dist |
|---|---|---|---|---|---|---|---|---|
| 815 Main St Branford, CT | 3.0 | 1.5 | 1824 | $3,200 | $1.75 | 10d | 1 | 0.24mi |
| 30 Aceto St Branford, CT | 4.0 | 2.0 | 2170 | $1,350 | $0.62 | 10d | 1 | 0.34mi |
| 54 Monroe St Branford, CT | 5.0 | 4.0 | 2777 | $1,250 | $0.45 | 11d | 1 | 0.47mi |
| 52 Maple St Unit 101 Branford, CT | 4.0 | 3.0 | 2697 | $9,000 | $3.34 | 43d | 1 | 0.81mi |
| 124 S Montowese St #10 Branford, CT | 3.0 | 2.0 | 1599 | $3,500 | $2.19 | 43d | 1 | 1.23mi |
Listing history 8 events
-
2026-06-03statusdays on market $514,900 Under Contract 4 DOM
-
2026-06-01remarks 597-char remark
-
2026-06-01days on market $514,900 Active 3 DOM
-
2026-05-31days on market $514,900 Active 2 DOM
-
2026-05-27historical $514,900
-
2004-10-07soldstatus $319,900
-
2004-09-30soldstatus $319,900 170-char remark
Show marketing remark (170 chars)
Was 2 family, can easily be converted back to legal 2 family. Property being sold as is. May be subject to probate court approval. Fabulous in town location. See m9083534
-
2004-08-04$319,900 170-char remark
Show marketing remark (170 chars)
Was 2 family, can easily be converted back to legal 2 family. Property being sold as is. May be subject to probate court approval. Fabulous in town location. See m9083534
ⓘ Source: listings_history table (triggers on properties + properties_extension) + one-shot
backfill from property_details.listing_events for pre-trigger history.
Tax reassessment forecast CT · Partial reset (capped growth)
- Current annual tax
- $5,572 · $464/mo
- Projected year-2 tax
- $8,295 · $691/mo
- Expected delta
- +$2,723/yr (+$227/mo · 48.9%)
ⓘ Screening estimate from a state-policy table — verify with the county assessor before closing.
Climate risk First Street
- Flood 1/10 Low FEMA zone X (unshaded) · 0% chance over 30 yrs
- Wildfire 1/10 Low
- Heat 7/10 Severe 7 d/yr ≥96°F today · 18 d/yr by 30 yrs out
- Wind 6/10 Major 64% chance of damaging wind over 30 yrs
- Air quality 4/10 Moderate 5 unhealthy d/yr today · 7 by 30 yrs out
Nearby sold comps map
Loading sold comps map…
Walkable amenities ~0.75 mi
Loading nearby amenities…
Taxation est. · year 1
- Rental income
- $49,641
- − Mortgage interest
- −$28,842
- − Property taxes
- −$5,572
- − Insurance
- −$2,574
- − Repairs & maintenance
- −$3,971
- − Management
- −$3,971
- − Depreciation
- −$14,979
- Taxable loss
- −$10,269
- Est. tax savings @ 24.0%
- +$2,465
- After-tax cash flow
- $1,132/yr
For passive investors: Depreciation is non-cash, so a rental often shows a tax loss while cash-flowing — sheltering income. Rental losses are passive: they offset passive income freely, and up to $25,000/yr can offset ordinary (W-2) income if you actively participate and your MAGI is under $100k (phasing out to $0 by $150k); unused losses carry forward. On sale, claimed depreciation is recaptured at up to 25%, and gains may owe capital-gains tax (a 1031 exchange can defer both). Figures are a year-1 estimate at your 24.0% rate — not tax advice; consult a CPA.
Schools (NCES district)
- District
- Branford School District
- NCES district ID
- 0900420
- Math proficiency
- 41% ▼ -14.00%
- Reading proficiency
- 52% ▼ -10.00%
- Median HH income
- $70,979
- Composite
- 41.85/100
- National rank
- #3377
- State rank
- #85 of 153 in CT
Livability — Branford Center
- Score
- 81/100
- State rank
- #16
- US rank
- #1386
Category grades
Schools grade is shown separately in the Schools card above.
Census & demographics
- Census place
- Branford Center, CT
- County
- New Haven County · 688,236 people
- Metro
- New Haven-Milford, CT
- Population (ZIP)
- 28,217
- Household income
- $105,225
- Rent vs Own
- Severe rent burden
- 1132.0
Population outlook (South Central Connecticut County) Hauer SSP2
- By 2040
- 608,362
Race, ethnicity, and origin ACS 2023
- Neighborhood character
- Predominantly White (85%)
- Race & ethnicity
- White 85% Hispanic / Latino 5% Asian 4% Two or more races 4% Black 3%
- Hispanic origin (detail)
- Puerto Rican 1%
- Common ancestry
- Romanian 7% Lithuanian 2% Slovak 2%
- Foreign-born
- 10% · Canada, South Korea
- Languages at home
- 90% English-only · Spanish 4% Other Indo-European 3% Other Asian/Pacific 1%
Political lean MEDSL · South Central Connecticut
- 2024 margin
- Strong D (+20.1) · D 59.0% · R 38.9% · Other 2.1%
- All cycles
- 2024: D+20.1
Not yet ingested
- Civics
- —
Market trends
- HPI YoY
- ▼ -455.72%
- Current HPI
- 189.8481
- Rent YoY
- ▲ 10.58%
- Metro
- New Haven-Milford, CT
- State GDP YoY
- ▲ 1.06%
- F500 in state
- 38
Industry mix (Fortune 500 HQ in CT)
| Industry | F500 HQs | Revenue |
|---|---|---|
| Industrial Machinery | 4 | $38B |
|
||
| Insurance | 3 | $71B |
|
||
| Financial Services | 2 | $25B |
|
||
| Transportation / Logistics | 2 | $18B |
|
||
| Healthcare | 1 | $247B |
|
||
| Telecommunications | 1 | $55B |
|
||
Price history
+61.0% since first listed4 events — show timeline
- 2026-05-27 Coming Soon $514,900 Smart MLS
- 2004-10-07 Sold (Public Records) $319,900 Public Records
- 2004-09-30 Sold (MLS) $319,900 Smart MLS
- 2004-08-04 Listed $319,900 Smart MLS
Property tax history
+1.7%/yrLatest (2022): $5,572 · +0.0% YoY. Source: county tax records.
Cash-flow waterfall
monthlySold comps — $/sqft
last 12 mo · ≤1 miLoading sold comps…