 5-Plex
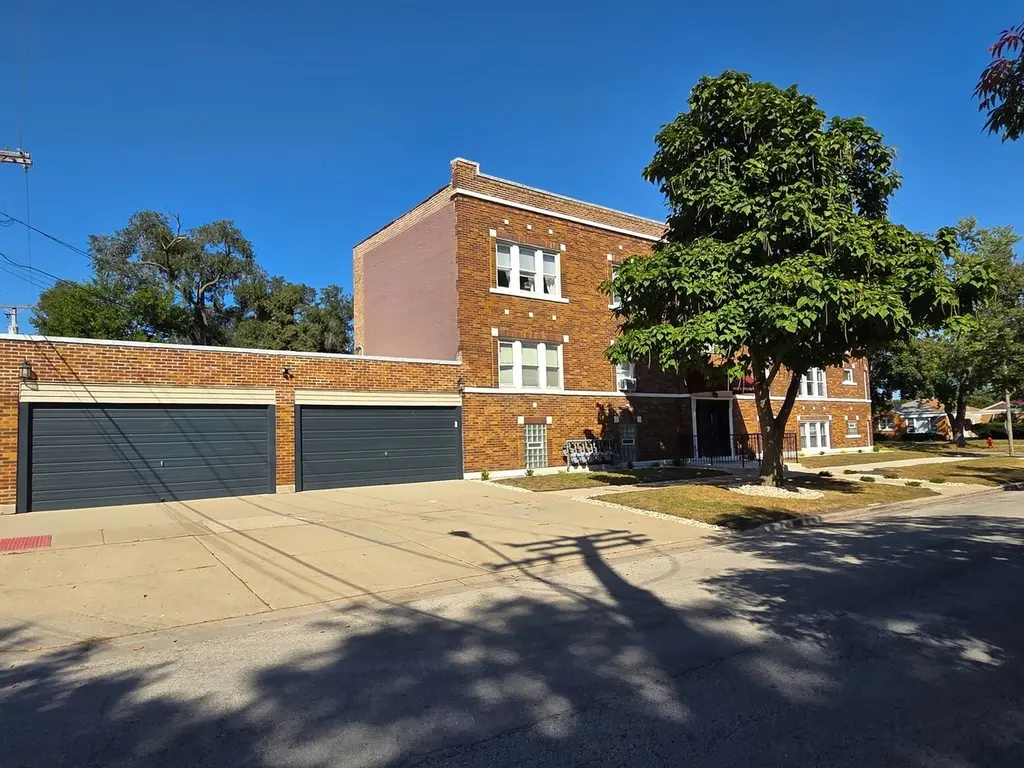
4252 Prescott Ave · Lyons, IL
Flood risk 1/10 · Minimal
- FEMA flood zone
- X (unshaded)
- Chance of flooding over 30 yrs
- 0.0%
- Est. flood insurance / yr
- $473 – $860
Fire risk 1/10 · Minimal
- Est. fire insurance / yr
- $804 – $1,492
Heat risk 3/10 · Minor
- Hot days now (above 101°F)
- 7 days/yr
- Hot days in 30 yrs
- 15 days/yr
Wind risk 2/10 · Minimal
- Chance of severe wind over 30 yrs
- 1.0%
Air-quality risk 4/10 · Minor
- Unhealthy air days now
- 3 days/yr
- Unhealthy air days in 30 yrs
- 5 days/yr
Risk factors via First Street. Map © Google.
Why this score? — see what drove the C- grade
The composite is a weighted blend of 9 inputs, each scored 0–100. Each bar is that input's sub-score; the figure is the points it added to the 100-point composite (weight × sub-score).
- Cash flow +20.8/30.0
- ARV discount +7.5/15.0
- DSCR +6.6/10.0
- 1% rule +5.8/10.0
- Livability +4.0/5.0
- Rent growth +2.5/5.0
- Condition / age +2.5/5.0
- Schools +1.1/10.0
- Appreciation +0.0/10.0
$700,000
🖨 Deal sheet 📄 Offer letter ✓ Due diligence
Multi-family units
County records classify this as Multi-Family (5+ Unit). Listing-text estimate: 5 units. confirmed
5+ unit building — per-unit beds/baths from public records are typically unavailable; the breakdown below (if shown) is an estimate from the listing text.
Listing remarks MLS
*SHOWINGS 4/17 - 3pm-6pm* Well-maintained brick 5-unit building in a quiet Lyons neighborhood, offering a strong investment opportunity. The property features a mix of 2BR/1BA layouts-three with separate dining rooms, two with efficient open layouts-all with hardwood floors and vinyl windows. One unit has a gutted kitchen and bathroom, offering a blank canvas for the next owner to customize and add value. Major updates include a new washer/dryer (coin-op), 75-gallon water heater (2023), 100 ft of new water line, 20 ft of new sewer line, and new concrete around the building (2024). Rear deck and staircase replaced in 2022. Boiler approx. 10 years old. Includes 6 electric and gas meters, gas steam heat, 4-car brick garage, 5 storage lockers, and basement workshop. Tenants pay electric and cooking gas. Close to schools, shopping, and expressways.
Key facts
- New water line
- New washer dryer
- New water heater
Tags
Neighborhood map
What this means for you Summary
Snapshot
- This is a 5 × 2.0-bed/1.0-bath units multifamily listed at $700k.
Deal economics
- At list price, monthly cash flow is $967 ($12k/yr) — positive. Per door: $193/mo.
- The deal already cash-flows at list — no discount required.
- Meets the 1% rule at list price ($8k rent vs $700k).
- Cap rate 8.0% vs local median 4.2% in Lyons — top-decile yield for the area; either an underpriced asset or a hidden risk that comps aren't pricing in. Stress-test before assuming the spread holds.
Location & tenants
- Location reads 79/100 on livability (#126 in IL, #2,222 nationally) — a middle-class / working-renter tenant base. Strengths: commute A+, cost of living A+, housing A+; Watch: schools F.
- J S Morton Hsd 201 (suburban): math 9% / reading 14% proficiency, ranked #557 of 620 in IL (top 90%) — low school quality limits family demand, transient renter base, plan for 1-2y turnover.
- Market conditions: 36 active listings in the ZIP; 6,272 units permitted in Cook County in 2024 (4,658 in 5+ unit buildings).
Forward outlook
- Local home prices are declining (-3.0%/yr); year-one equity from $5k of loan paydown is wiped out by about $21k of value loss. Plan a longer hold.
Negotiation context
- Only 9 days on market — expect competitive offers; lowballing is unlikely to land.
- 8 sale attempts since 16y ago with the ask held roughly flat each time — persistent listings suggest the price (not the market) is what's stuck; bring a comps-based counter.
Risks & watch-outs
- Watch-outs: built in 1930 — expect roof / HVAC / electrical / plumbing capex.
Questions for the listing agent
- Can we see the unit-by-unit rent roll, current vacancy, and any below-market leases? What's the average tenancy length?
- What capital expenditures (roof, boiler, parking lot, exteriors) have been made in the last 5 years, and what's planned in the next 2?
- Built in 1930 — when were the roof, HVAC, electrical panel, plumbing, and water heater last replaced?
- Is there a deadline driving the sale (1031 exchange, divorce, estate, relocation)? That informs how much negotiation room exists.
- Schools are F-rated, which usually means shorter tenancies and higher turnover. Who's the typical renter profile here, and what's been the actual vacancy rate?
- What's the average days-on-market for RENTAL listings here right now (not sales)? A rising rental-DOM trend means longer vacancies and softer asking-rent achievability than the comps imply.
- What's the recent tenant-quality profile in this submarket — average credit score on applications, eviction rate, late-payment / NSF rate, and stable-employment percentage? A property-management company in the area should have these aggregated.
- How much new apartment / multifamily construction is in the pipeline within 1–3 miles? Heavy new supply (>2% of stock underway) typically softens rents 12–24 months out; light construction supports rent growth.
Investment metrics
- 1% rule
- 1.08% ✓
- Cap rate
- 7.95%
- Cash-on-cash
- 5.92%
- DSCR
- 1.26
- GRM
- 7.7
CMA / ARV
No comps found within radius.
Projected returns pro-forma
-3.0% appreciation · 3.0% rent growth · sell at horizon
- IRR
- -7.1%
- Equity multiple
- 0.74×
- Total profit
- $-51,606
- Equity at exit
- $104,372
- IRR
- 2.5%
- Equity multiple
- 1.18×
- Total profit
- $35,301
- Equity at exit
- $60,523
Cash invested: $196,000 (down + closing). Projections, not guarantees.
Landlord ↔ Tenant lean methodology
- Overall (STATE)
- 43 Moderately Tenant-Leaning
- State Illinois
- 43 Moderately Tenant-Leaning · D+7
- County
- — inherits STATE
- City
- — inherits STATE
ZIP-level market 60534
- Home prices YoY
- -26.6%
- Active inventory
- 36
- Price-to-rent
- 38.5×
Monthly cashflow live
- Estimated rent
- $7,580 high interval (Pro) →
- Mortgage (P&I)
- −$3,671
- Tax from tax record
- −$1,059 /mo · $12,702/yr
- Insurance
- −$292
- HOA
- −$0
- Vacancy / Maint / Mgmt
- −$1,592
- Net cashflow
- $967
Break-even live
5-unit breakdown (identical units grouped — click to expand)
| Units | Beds | Baths | Est. rent |
|---|---|---|---|
| 5× units | 2.0 | 1 | $7,580 |
| #1 | 2.0 | 1 | $1,516 |
| #2 | 2.0 | 1 | $1,516 |
| #3 | 2.0 | 1 | $1,516 |
| #4 | 2.0 | 1 | $1,516 |
| #5 | 2.0 | 1 | $1,516 |
| Total (5 units) | $7,580 | ||
UW: 25.0% down · 7.5% · 30yr · 1.5% tax · 5.0% vac · 8.0% maint · 8.0% mgmt
Financing live
Cash to close
- Down payment
- $175,000
- Closing costs
- $21,000
- Reserves months
- —
- Total cash needed
- —
Loan-product check · same deal, 3 products live
Conventional
25% down · 7.5% · 30yr
- Down + closing
- —
- Monthly P&I
- —
- Monthly cashflow
- —
- DSCR
- —
- Eligible?
- —
Personal DTI + credit; lowest rate.
DSCR
20% down · 8.5% · 30yr
- Down + closing
- —
- Monthly P&I
- —
- Monthly cashflow
- —
- DSCR
- —
- Eligible?
- —
No personal income docs; deal must DSCR.
Hard money
10% down · 12.0% · 12mo
- Down + closing
- —
- Monthly P&I
- —
- Monthly cashflow
- —
- DSCR
- —
- Eligible?
- —
Short-term bridge; refi at stabilization.
Listing history 44 events
-
2026-06-18days on market $700,000 Active 9 DOM
-
2026-06-17days on market $700,000 Active 8 DOM
-
2026-06-16days on market $700,000 Active 7 DOM
-
2026-06-15days on market $700,000 Active 6 DOM
-
2026-06-13days on market $700,000 Active 4 DOM
-
2026-06-10statusdays on market $700,000 Active 1 DOM
-
2026-06-09days on market $700,000 Contingent - Continue to Show 70 DOM
-
2026-06-08days on market $700,000 Contingent - Continue to Show 69 DOM
-
2026-06-07days on market $700,000 Contingent - Continue to Show 68 DOM
-
2026-06-04days on market $700,000 Contingent - Continue to Show 65 DOM
-
2026-06-03days on market $700,000 Contingent - Continue to Show 64 DOM
-
2026-06-02days on market $700,000 Contingent - Continue to Show 63 DOM
-
2026-06-01days on market $700,000 Contingent - Continue to Show 62 DOM
-
2026-05-31days on market $700,000 Contingent - Continue to Show 61 DOM
-
2026-04-21historical Contingent - Continue to Show 855-char remark
Show marketing remark (855 chars)
*SHOWINGS 4/17 - 3pm-6pm* Well-maintained brick 5-unit building in a quiet Lyons neighborhood, offering a strong investment opportunity. The property features a mix of 2BR/1BA layouts-three with separate dining rooms, two with efficient open layouts-all with hardwood floors and vinyl windows. One unit has a gutted kitchen and bathroom, offering a blank canvas for the next owner to customize and add value. Major updates include a new washer/dryer (coin-op), 75-gallon water heater (2023), 100 ft of new water line, 20 ft of new sewer line, and new concrete around the building (2024). Rear deck and staircase replaced in 2022. Boiler approx. 10 years old. Includes 6 electric and gas meters, gas steam heat, 4-car brick garage, 5 storage lockers, and basement workshop. Tenants pay electric and cooking gas. Close to schools, shopping, and expressways.
-
2026-03-31$700,000 Active 855-char remark
Show marketing remark (855 chars)
*SHOWINGS 4/17 - 3pm-6pm* Well-maintained brick 5-unit building in a quiet Lyons neighborhood, offering a strong investment opportunity. The property features a mix of 2BR/1BA layouts-three with separate dining rooms, two with efficient open layouts-all with hardwood floors and vinyl windows. One unit has a gutted kitchen and bathroom, offering a blank canvas for the next owner to customize and add value. Major updates include a new washer/dryer (coin-op), 75-gallon water heater (2023), 100 ft of new water line, 20 ft of new sewer line, and new concrete around the building (2024). Rear deck and staircase replaced in 2022. Boiler approx. 10 years old. Includes 6 electric and gas meters, gas steam heat, 4-car brick garage, 5 storage lockers, and basement workshop. Tenants pay electric and cooking gas. Close to schools, shopping, and expressways.
-
2026-03-23historical Contingent - Continue to Show
-
2026-03-20historical
-
2026-02-20Active
-
2025-11-20historical Contingent - Continue to Show
-
2025-11-11historical
-
2025-10-27Active
-
2025-10-14historical Contingent - No Showings
-
2025-10-13historical
-
2025-10-02Active
-
2023-10-30soldstatus $610,000 Closed
-
2023-09-01historical Contingent - Continue to Show
-
2023-08-27$599,900 Active
-
2014-03-11soldstatus $280,000
-
2014-01-23soldstatus $280,000 Closed Sale
-
2013-12-17historical Contingent
-
2013-11-13price $299,000 Price Change
-
2013-10-10$335,000 New
-
2012-07-19historical
-
2011-09-07New
-
2011-09-03historical
-
2011-05-11price Price Change
-
2011-01-12price Price Change
-
2010-11-04price Price Change
-
2010-10-29price Price Change
-
2010-10-04price Price Change
-
2010-08-28New
-
1994-09-30soldstatus $195,500
-
1994-09-30soldstatus $293,250
ⓘ Source: listings_history table (triggers on properties + properties_extension) + one-shot
backfill from property_details.listing_events for pre-trigger history.
Tax reassessment forecast IL · Partial reset (capped growth)
- Current annual tax
- $12,702 · $1,059/mo
- Projected year-2 tax
- $14,296 · $1,191/mo
- Expected delta
- +$1,594/yr (+$133/mo · 12.5%)
ⓘ Screening estimate from a state-policy table — verify with the county assessor before closing.
Climate risk First Street
- Flood 1/10 Low FEMA zone X (unshaded) · 0% chance over 30 yrs
- Wildfire 1/10 Low
- Heat 3/10 Moderate 7 d/yr ≥101°F today · 15 d/yr by 30 yrs out
- Wind 2/10 Low 100% chance of damaging wind over 30 yrs
- Air quality 4/10 Moderate 3 unhealthy d/yr today · 5 by 30 yrs out
Nearby sold comps map
Loading sold comps map…
Walkable amenities ~0.75 mi
Loading nearby amenities…
Taxation est. · year 1
- Rental income
- $90,960
- − Mortgage interest
- −$39,211
- − Property taxes
- −$12,702
- − Insurance
- −$3,500
- − Repairs & maintenance
- −$7,277
- − Management
- −$7,277
- − Depreciation
- −$20,364
- Taxable income
- $629
- Est. tax owed @ 24.0%
- −$151
- After-tax cash flow
- $11,454/yr
For passive investors: Depreciation is non-cash, so a rental often shows a tax loss while cash-flowing — sheltering income. Rental losses are passive: they offset passive income freely, and up to $25,000/yr can offset ordinary (W-2) income if you actively participate and your MAGI is under $100k (phasing out to $0 by $150k); unused losses carry forward. On sale, claimed depreciation is recaptured at up to 25%, and gains may owe capital-gains tax (a 1031 exchange can defer both). Figures are a year-1 estimate at your 24.0% rate — not tax advice; consult a CPA.
Schools (NCES district)
- District
- J S Morton Hsd 201
- NCES district ID
- 1726880
- Math proficiency
- 9% ▲ 1.00%
- Reading proficiency
- 14% ▼ -1.00%
- Median HH income
- $48,698
- Composite
- 10.73/100
- National rank
- #9768
- State rank
- #557 of 620 in IL
Livability — Lyons
- Score
- 79/100
- State rank
- #126
- US rank
- #2222
Category grades
Schools grade is shown separately in the Schools card above.
Census & demographics
- Census place
- Lyons, IL
- City population
- 10,362
- Population (ZIP)
- 10,362
Population outlook (Cook County) Hauer SSP2
- Today (2025)
- 5,347,519 people
- By 2030
- 5,357,703 · +0.2%
- By 2040
- 5,324,924 · -0.4%
- By 2050
- 5,230,762 · -2.2%
- By 2075
- 4,785,735 · -10.5%
- By 2100
- 4,188,836 · -21.7%
Race, ethnicity, and origin ACS 2023
- Neighborhood character
- Diverse neighborhood (Simpson 0.55)
- Race & ethnicity
- Hispanic / Latino 49% White 46% Two or more races 8% Black 3% Asian 2%
- Hispanic origin (detail)
- Mexican 38% Puerto Rican 6%
- Common ancestry
- Romanian 17% Italian 1% Lithuanian 1%
- Foreign-born
- 24% · Canada, Vietnam, Jamaica
- Languages at home
- 54% English-only · Spanish 36% Russian/Polish/Slavic 6% Other Indo-European 3%
Political lean MEDSL · Cook
- 2024 margin
- Solid D (+42.0) · D 70.4% · R 28.4% · Other 1.2%
- 2008→2024 swing
- -11.4pp toward R · 2008: 53.4pp · 2024: 42.0pp
- All cycles
- 2024: D+42.0 2020: D+50.3 2016: D+53.0 2012: D+49.4 2008: D+53.4
Not yet ingested
- Civics
- —
Market trends
- HPI YoY
- ▼ -88.39%
- Current HPI
- 243.8425
- Rent YoY
- —
- Metro
- —
- State GDP YoY
- ▲ 1.59%
- F500 in state
- 60
Industry mix (Fortune 500 HQ in IL)
| Industry | F500 HQs | Revenue |
|---|---|---|
| Insurance | 4 | $201B |
|
||
| Consumer Goods | 4 | $87B |
|
||
| Industrial Machinery | 3 | $64B |
|
||
| Healthcare | 2 | $55B |
|
||
| Retail / Pharmacy | 1 | $148B |
|
||
| Agriculture / Food | 1 | $86B |
|
||
Price history
+258.1% since first listed30 events — show timeline
- 2026-04-21 Contingent — MRED as Distributed by MLS Grid
- 2026-03-31 Listed $700,000 MRED as Distributed by MLS Grid
- 2026-03-23 Contingent — MRED as Distributed by MLS Grid
- 2026-03-20 Listing Removed — MRED as Distributed by MLS Grid
- 2026-02-20 Listed — MRED as Distributed by MLS Grid
- 2025-11-20 Contingent — MRED as Distributed by MLS Grid
- 2025-11-11 Listing Removed — MRED as Distributed by MLS Grid
- 2025-10-27 Listed — MRED as Distributed by MLS Grid
- 2025-10-14 Contingent — MRED as Distributed by MLS Grid
- 2025-10-13 Listing Removed — MRED as Distributed by MLS Grid
- 2025-10-02 Listed — MRED as Distributed by MLS Grid
- 2023-10-30 Sold (MLS) $610,000 MRED as Distributed by MLS Grid
- 2023-09-01 Contingent — MRED as Distributed by MLS Grid
- 2023-08-27 Listed $599,900 MRED as Distributed by MLS Grid
- 2014-03-11 Sold (Public Records) $280,000 Public Records
- 2014-01-23 Sold (MLS) $280,000 MRED as Distributed by MLS Grid
- 2013-12-17 Contingent — MRED as Distributed by MLS Grid
- 2013-11-13 Price Changed $299,000 MRED as Distributed by MLS Grid
- 2013-10-10 Listed $335,000 MRED as Distributed by MLS Grid
- 2012-07-19 Listing Removed — MRED as Distributed by MLS Grid
- 2011-09-07 Listed — MRED as Distributed by MLS Grid
- 2011-09-03 Listing Removed — MRED as Distributed by MLS Grid
- 2011-05-11 Price Changed — MRED as Distributed by MLS Grid
- 2011-01-12 Price Changed — MRED as Distributed by MLS Grid
- 2010-11-04 Price Changed — MRED as Distributed by MLS Grid
- 2010-10-29 Price Changed — MRED as Distributed by MLS Grid
- 2010-10-04 Price Changed — MRED as Distributed by MLS Grid
- 2010-08-28 Listed — MRED as Distributed by MLS Grid
- 1994-09-30 Sold (Public Records) $293,250 Public Records
- 1994-09-30 Sold (Public Records) $195,500 Public Records
Property tax history
+1.3%/yrLatest (2023): $12,702 · -13.5% YoY. Source: county tax records.
Cash-flow waterfall
monthlySold comps — $/sqft
last 12 mo · ≤1 miLoading sold comps…