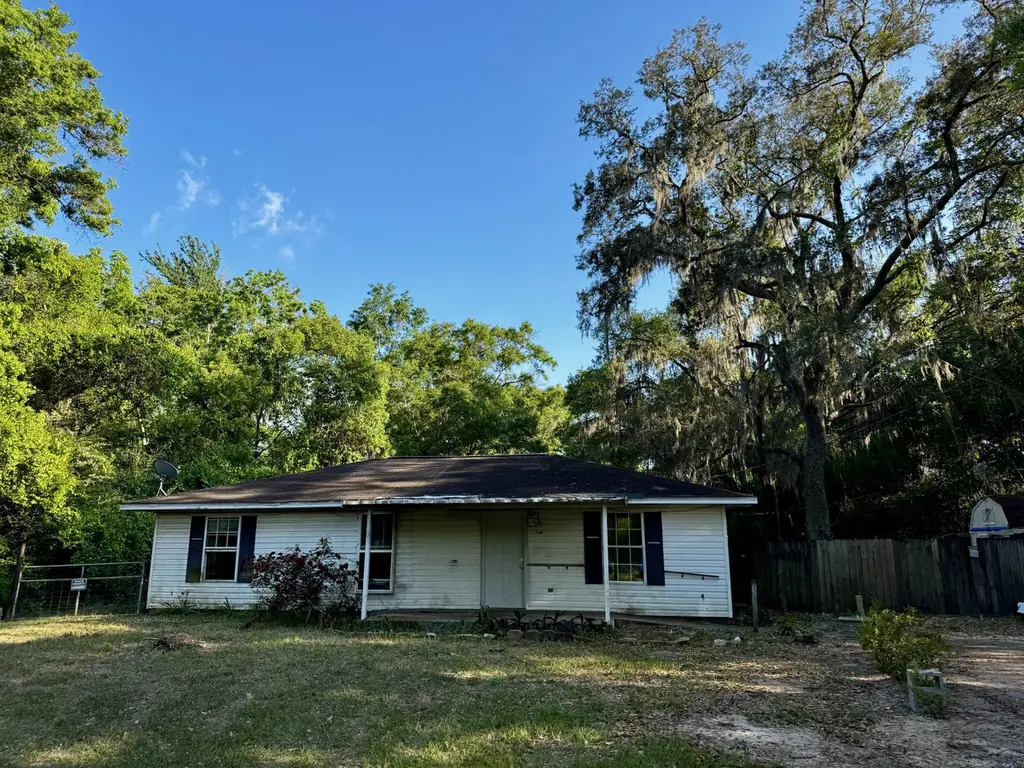
6875 Sunburst Ln · Milton, FL
Flood risk 1/10 · Minimal
- FEMA flood zone
- X (unshaded)
- Chance of flooding over 30 yrs
- 0.0%
- Est. flood insurance / yr
- $507 – $1,088
Fire risk 5/10 · Moderate
- Est. fire insurance / yr
- $947 – $1,759
Heat risk 9/10 · Severe
- Hot days now (above 104°F)
- 7 days/yr
- Hot days in 30 yrs
- 20 days/yr
Wind risk 9/10 · Severe
- Chance of severe wind over 30 yrs
- 99.0%
Air-quality risk 2/10 · Minimal
- Unhealthy air days now
- 0 days/yr
- Unhealthy air days in 30 yrs
- 1 days/yr
Risk factors via First Street. Map © Google.
Why this score? — see what drove the B grade
The composite is a weighted blend of 9 inputs, each scored 0–100. Each bar is that input's sub-score; the figure is the points it added to the 100-point composite (weight × sub-score).
- Cash flow +30.0/30.0
- 1% rule +10.0/10.0
- DSCR +10.0/10.0
- ARV discount +7.5/15.0
- Schools +5.3/10.0
- Livability +3.9/5.0
- Rent growth +3.2/5.0
- Condition / age +2.5/5.0
- Appreciation +0.0/10.0
$84,500
🖨 Deal sheet 📄 Offer letter ✓ Due diligence
Listing remarks
Handyman Special with a Backyard Paradise! Bring your toolbelt and your imagination to this 3-bedroom, 1-bathroom home bursting with potential. Perfect for investors, flippers, or handy homeowners looking to build immediate sweat equity. No HOA and RV Outlet in backyard. The interior requires repairs and cosmetic updates, but the bones are here to create your dream space. Property was built to be handicap accessible. The true highlight of this property is the spectacular, expansive backyard. The beautiful, lush yard offers a private oasis perfect for gardening, entertaining, or future expansion. The property is being sold strictly AS-IS, and the seller will make no repairs. Cash or renovati
Key facts
- Private oasis
- Public boat ramp
- Expansive backyard
Tags
Property features AI
Finance
- Other: Lot dimensions approximately 193 x 129; Lot size about 0.6 acre; One-story; total building area reported
- Financial info: Was not specified
- HOA & community: Subdivision: SKYLINE HEIGHTS; Handicap provisions in community
Exterior
- Parking: Detached carport
- Security: Was not specified
- Utilities: Electric service; Public water; Septic tank
- Home design: Single-story ranch; Built in 2000; Resid Single Family zoning
- Construction: Vinyl siding
- Exterior features: Cleared lot; Dead-end street; Within half a mile to water; County road frontage; Paved road access
Interior
- Kitchen: Kitchen on the first floor
- Bedrooms: Three bedrooms (all on the first floor)
- Flooring: Was not specified
- Bathrooms: One full bathroom
- Heating & cooling: Ceiling fan cooling
- Interior features: Ceiling fans; Electric water heater
- Laundry & utility: Was not specified
Neighborhood map
What this means for you Summary
Snapshot
- This is a 3-bed/1.0-bath single-family listed at $84k.
Deal economics
- At list price, monthly cash flow is $805 ($10k/yr) — positive.
- The deal already cash-flows at list — no discount required.
- Meets the 1% rule at list price ($2k rent vs $84k).
- Cap rate 17.7% vs local median 4.6% in Milton — top-decile yield for the area; either an underpriced asset or a hidden risk that comps aren't pricing in. Stress-test before assuming the spread holds.
Location & tenants
- Location reads 78/100 on livability (#166 in FL, #2,480 nationally) — a middle-class / working-renter tenant base. Strengths: cost of living A+, housing A+, health & safety A+; Watch: amenities D-, commute F.
- Santa Rosa (suburban): math 63% / reading 60% proficiency, ranked #8 of 73 in FL (top 11%) — acceptable for families but not a draw, mixed tenant base, ~2y average lease.
- Zoned schools: W. H. Rhodes Elementary School (math 55% / reading 47%, grade C-, #1,043 of 2,144 statewide, top 49%, 812 students, 79% FRL); Milton High School (math 44% / reading 42%, grade F, #255 of 667 statewide, top 39%, 2,085 students, 54% FRL) — zoned schools average 66% FRL vs 36% district-wide (30 pts higher); higher-poverty schools than district average — tighter screening recommended.
- Zoned-school proficiency averages 47% at this address vs 62% district-wide (-14 pts) — the specific schools serving this property underperform the Santa Rosa average; the district grade overstates school quality for this exact location.
- Market conditions: Rents rising (+2.7%/yr); 360 active listings in the ZIP; 4 comparable units currently listed for rent nearby; rentals at typical pace (median 21d on market — plan ~3-4 weeks tenant-placement turnaround); solid renter incomes; 1,983 units permitted in Santa Rosa County in 2024 (128 in 5+ unit buildings).
Forward outlook
- Local home prices are declining (-3.0%/yr); year-one equity from $584 of loan paydown is wiped out by about $3k of value loss. Plan a longer hold.
- Santa Rosa County population projected at +31% by 2050 — long-run rental-demand tailwind backs the buy-and-hold thesis.
- At projected returns (-3.0% appreciation + 2.7% rent growth), your $24k cash investment doubles in ~3 years — after that, you're playing with house money.
Negotiation context
- Only 6 days on market — expect competitive offers; lowballing is unlikely to land.
Risks & watch-outs
- Climate carrying-cost: severe wind risk, 99% chance of damaging wind over 30y; moderate wildfire risk; extreme-heat days projected 7→20/yr by 2055 (HVAC capex compounding) — expect insurance premiums to compound above CPI over the hold.
Questions for the listing agent
- Is there a deadline driving the sale (1031 exchange, divorce, estate, relocation)? That informs how much negotiation room exists.
- Schools are B-rated — typically a magnet for longer-tenancy family renters. What's the average tenant stay here, and is there a school-zone premium baked into asking?
- What's the average days-on-market for RENTAL listings here right now (not sales)? A rising rental-DOM trend means longer vacancies and softer asking-rent achievability than the comps imply.
- What's the recent tenant-quality profile in this submarket — average credit score on applications, eviction rate, late-payment / NSF rate, and stable-employment percentage? A property-management company in the area should have these aggregated.
- How much new for-sale + rental construction is in the pipeline within 1–3 miles? Heavy new supply typically softens prices + rents 12–24 months out; constrained supply supports both.
Investment metrics
- 1% rule
- 1.96% ✓
- Cap rate
- 17.73%
- Cash-on-cash
- 40.84%
- DSCR
- 2.82
- GRM
- 4.2
CMA / ARV
- ARV (on-the-fly)
- $210,496
- Comps found
- 12
Show comp detail 12 sales within ~0.75 mi
| Address | Dist | Beds/Ba | Sqft | Sold | Price | $/sf | Match |
|---|---|---|---|---|---|---|---|
| 6844 Ferris Hill St | 0.24mi | 3/2.0 | 1,150 (+0%) | 2mo | $240,000 | $209 | 82 |
| 5544 Hill St | 0.31mi | 3/2.0 | 1,120 (-2%) | 7mo | $189,900 | $170 | 72 |
| 5540 Hill St | 0.33mi | 3/2.0 | 1,120 (-2%) | 7mo | $195,000 | $174 | 72 |
| 6760 North Ave | 0.36mi | 3/2.0 | 1,173 (+2%) | 12mo | $222,000 | $189 | 65 |
| 6756 North Ave | 0.40mi | 3/2.0 | 1,173 (+2%) | 11mo | $219,000 | $187 | 64 |
| 6761 Harvell St | 0.34mi | 3/2.0 | 1,250 (+9%) | 5mo | $230,000 | $184 | 61 |
| 5796 Washington St | 0.58mi | 3/2.0 | 1,200 (+5%) | 4mo | $199,900 | $167 | 58 |
| 6804 Dixon St | 0.58mi | 3/2.0 | 1,220 (+7%) | 4mo | $200,000 | $164 | 55 |
| 6740 Cotter Dr | 0.56mi | 3/2.0 | 1,218 (+6%) | 6mo | $225,000 | $185 | 54 |
| 6612 Cedar St | 0.74mi | 3/1.0 | 1,124 (-2%) | 13mo | $170,000 | $151 | 51 |
| 5577 Riverside St | 0.45mi | 4/1.0 (+1) | 1,109 (-3%) | 22mo | $192,000 | $173 | 51 |
| 6850 Quinn Bayou Dr | 0.62mi | 2/2.0 (-1) | 1,296 (+13%) | 20mo | $525,000 | $405 | 23 |
Match score weights: distance 35% · size 25% · config 20% · recency 20%. Top-matched comps best support the ARV.
Projected returns pro-forma
-3.0% appreciation · 2.7% rent growth · sell at horizon
- IRR
- 37.0%
- Equity multiple
- 2.57×
- Total profit
- $37,066
- Equity at exit
- $12,599
- IRR
- 43.4%
- Equity multiple
- 5.06×
- Total profit
- $96,178
- Equity at exit
- $7,306
Cash invested: $23,660 (down + closing). Projections, not guarantees.
Landlord ↔ Tenant lean methodology
- Overall (STATE)
- 87 Strongly Landlord-Friendly
- State Florida
- 87 Strongly Landlord-Friendly · R+3
- County
- — inherits STATE
- City
- — inherits STATE
ZIP-level market 32570
- Home prices YoY
- -15.1%
- Rents YoY
- 2.7%
- Active inventory
- 360
- Price-to-rent
- 4.2×
Monthly cashflow live
- Estimated rent
- $1,659 medium interval (Pro) →
- Mortgage (P&I)
- −$443
- Tax from tax record
- −$27 /mo · $325/yr
- Insurance
- −$35
- HOA
- −$0
- Vacancy / Maint / Mgmt
- −$348
- Net cashflow
- $805
Break-even live
UW: 25.0% down · 7.5% · 30yr · 1.5% tax · 5.0% vac · 8.0% maint · 8.0% mgmt
Financing live
Cash to close
- Down payment
- $21,125
- Closing costs
- $2,535
- Reserves months
- —
- Total cash needed
- —
Loan-product check · same deal, 3 products live
Conventional
25% down · 7.5% · 30yr
- Down + closing
- —
- Monthly P&I
- —
- Monthly cashflow
- —
- DSCR
- —
- Eligible?
- —
Personal DTI + credit; lowest rate.
DSCR
20% down · 8.5% · 30yr
- Down + closing
- —
- Monthly P&I
- —
- Monthly cashflow
- —
- DSCR
- —
- Eligible?
- —
No personal income docs; deal must DSCR.
Hard money
10% down · 12.0% · 12mo
- Down + closing
- —
- Monthly P&I
- —
- Monthly cashflow
- —
- DSCR
- —
- Eligible?
- —
Short-term bridge; refi at stabilization.
Rent comps 4 comps
| Address | Beds | Baths | Sqft | Rent | $/sqft | DOM | Units | Dist |
|---|---|---|---|---|---|---|---|---|
| 5394 Munson Hwy Milton, FL | 2.0 | 2.0 | 900 | $1,250 | $1.39 | 14d | 1 | 0.36mi |
| 5376 Conecuh St Milton, FL | 2.0 | 1.0 | 730 | $1,400 | $1.92 | 23d | 1 | 0.72mi |
| 6593 Lee St Unit B Milton, FL | 2.0 | 1.0 | 750 | $1,300 | $1.73 | 21d | 1 | 0.79mi |
| 5357 Locklin Ave Milton, FL | 3.0 | 1.0 | 1100 | $1,700 | $1.55 | 14d | 1 | 1.19mi |
Listing history 6 events
-
2026-06-03status $84,500 Pending 6 DOM
-
2026-06-02days on market $84,500 Active 6 DOM
-
2026-06-01days on market $84,500 Active 5 DOM
-
2026-05-31days on market $84,500 Active 4 DOM
-
2026-05-31days on market $84,500 Active 3 DOM
-
2026-05-27$84,500 Active
ⓘ Source: listings_history table (triggers on properties + properties_extension) + one-shot
backfill from property_details.listing_events for pre-trigger history.
Tax reassessment forecast FL · Resets to sale price
- Current annual tax
- $325 · $27/mo
- Projected year-2 tax
- $701 · $58/mo
- Expected delta
- +$376/yr (+$31/mo · 115.7%)
ⓘ Screening estimate from a state-policy table — verify with the county assessor before closing.
Climate risk First Street
- Flood 1/10 Low FEMA zone X (unshaded) · 0% chance over 30 yrs
- Wildfire 5/10 Major
- Heat 9/10 Extreme 7 d/yr ≥104°F today · 20 d/yr by 30 yrs out
- Wind 9/10 Extreme 99% chance of damaging wind over 30 yrs
- Air quality 2/10 Low 0 unhealthy d/yr today · 1 by 30 yrs out
Nearby sold comps map
Loading sold comps map…
Walkable amenities ~0.75 mi
Loading nearby amenities…
Taxation est. · year 1
- Rental income
- $19,908
- − Mortgage interest
- −$4,733
- − Property taxes
- −$325
- − Insurance
- −$422
- − Repairs & maintenance
- −$1,593
- − Management
- −$1,593
- − Depreciation
- −$2,458
- Taxable income
- $8,783
- Est. tax owed @ 24.0%
- −$2,108
- After-tax cash flow
- $7,554/yr
For passive investors: Depreciation is non-cash, so a rental often shows a tax loss while cash-flowing — sheltering income. Rental losses are passive: they offset passive income freely, and up to $25,000/yr can offset ordinary (W-2) income if you actively participate and your MAGI is under $100k (phasing out to $0 by $150k); unused losses carry forward. On sale, claimed depreciation is recaptured at up to 25%, and gains may owe capital-gains tax (a 1031 exchange can defer both). Figures are a year-1 estimate at your 24.0% rate — not tax advice; consult a CPA.
Schools (NCES district)
- District
- Santa Rosa
- NCES district ID
- 1201650
- Math proficiency
- 63% ▼ -6.00%
- Reading proficiency
- 60% ▼ -5.00%
- Median HH income
- $58,161
- Composite
- 53.12/100
- National rank
- #1511
- State rank
- #8 of 73 in FL
Livability — Milton
- Score
- 78/100
- State rank
- #166
- US rank
- #2480
Category grades
Schools grade is shown separately in the Schools card above.
Census & demographics
- County
- Santa Rosa County · 194,764 people
- City population
- 42,171
- Metro
- Pensacola-Ferry Pass-Brent, FL
- Population (ZIP)
- 37,197
- Household income
- $77,222
- Rent vs Own
- Severe rent burden
- 590.0
Population outlook (Santa Rosa County) Hauer SSP2
- Today (2025)
- 195,978 people
- By 2030
- 209,782 · +7.0%
- By 2040
- 235,293 · +20.1%
- By 2050
- 256,408 · +30.8%
- By 2075
- 298,074 · +52.1%
- By 2100
- 303,216 · +54.7%
Race, ethnicity, and origin ACS 2023
- Neighborhood character
- Predominantly White (80%)
- Race & ethnicity
- White 80% Two or more races 7% Black 6% Hispanic / Latino 6% Asian 1%
- Hispanic origin (detail)
- Mexican 2% Puerto Rican 2%
- Common ancestry
- Italian 4% Lithuanian 3% Portuguese 2%
- Foreign-born
- 4% · Canada
- Languages at home
- 94% English-only · Spanish 4% Other Asian/Pacific 1%
Political lean MEDSL · Santa Rosa
- 2024 margin
- Solid R (+51.0) · D 24.1% · R 75.0%
- 2008→2024 swing
- -3.0pp toward R · 2008: -47.9pp · 2024: -51.0pp
- All cycles
- 2024: R+51.0 2020: R+46.5 2016: R+53.5 2012: R+52.6 2008: R+47.9
Not yet ingested
- Civics
- —
Market trends
- HPI YoY
- ▼ -51.06%
- Current HPI
- 287.7469
- Rent YoY
- ▲ 2.70%
- Metro
- Pensacola-Ferry Pass-Brent, FL
- State GDP YoY
- ▲ 3.28%
- F500 in state
- 36
Industry mix (Fortune 500 HQ in FL)
| Industry | F500 HQs | Revenue |
|---|---|---|
| Industrial Technology | 2 | $29B |
|
||
| Insurance | 2 | $17B |
|
||
| Retail | 1 | $60B |
|
||
| Technology Distribution | 1 | $58B |
|
||
| Homebuilding | 1 | $35B |
|
||
| Technology Manufacturing | 1 | $35B |
|
||
Price history
1 event — show timeline
- 2026-05-27 Listed $84,500 ECAR
Property tax history
-8.8%/yrLatest (2025): $325 · +1.4% YoY. Source: county tax records.
Cash-flow waterfall
monthlySold comps — $/sqft
last 12 mo · ≤1 miLoading sold comps…