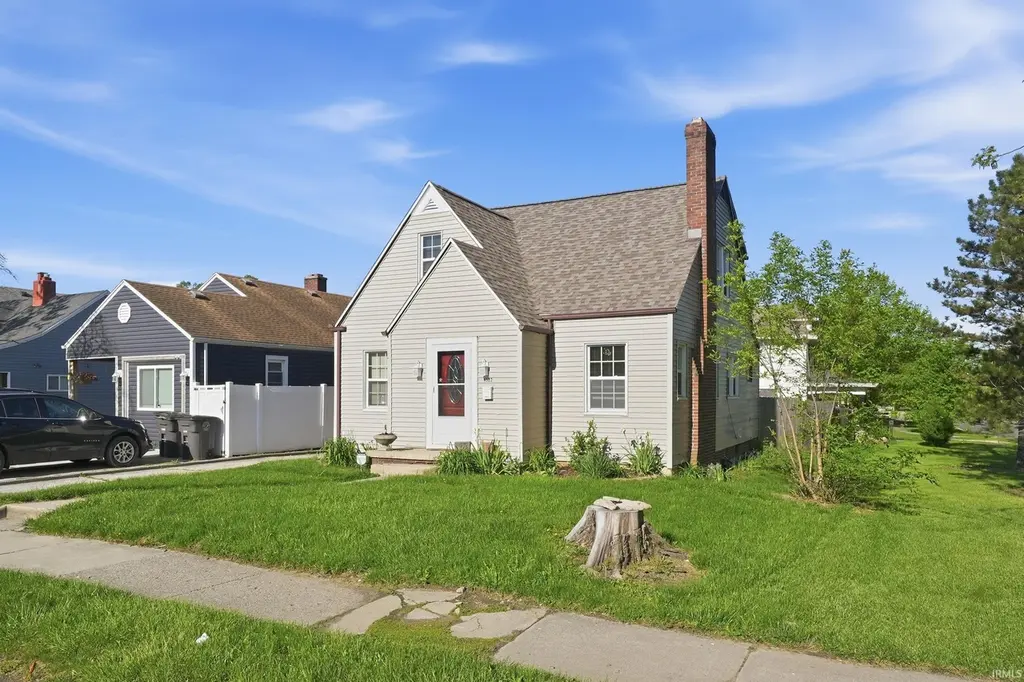
4522 S Calhoun St · Fort Wayne, IN
Flood risk 1/10 · Minimal
- FEMA flood zone
- X (unshaded)
- Chance of flooding over 30 yrs
- 0.0%
- Est. flood insurance / yr
- $473 – $860
Fire risk 1/10 · Minimal
- Est. fire insurance / yr
- $717 – $1,331
Heat risk 3/10 · Minor
- Hot days now (above 100°F)
- 7 days/yr
- Hot days in 30 yrs
- 17 days/yr
Wind risk 2/10 · Minimal
- Chance of severe wind over 30 yrs
- —
Air-quality risk 3/10 · Minor
- Unhealthy air days now
- 2 days/yr
- Unhealthy air days in 30 yrs
- 3 days/yr
Risk factors via First Street. Map © Google.
Why this score? — see what drove the C- grade
The composite is a weighted blend of 9 inputs, each scored 0–100. Each bar is that input's sub-score; the figure is the points it added to the 100-point composite (weight × sub-score).
- Cash flow +18.2/30.0
- ARV discount +12.5/15.0
- DSCR +5.7/10.0
- Rent growth +4.6/5.0
- Livability +4.2/5.0
- 1% rule +3.6/10.0
- Condition / age +2.5/5.0
- Schools +2.2/10.0
- Appreciation +0.0/10.0
$159,900
🖨 Deal sheet 📄 Offer letter ✓ Due diligence
Listing remarks
Character, space, and major updates come together in this charming 4 bedroom, 1.5 bath home in the heart of Fort Wayne’s desirable ‘07! Offering over 1,600 square feet, this home features beautiful natural light, hardwood flooring, flexible living spaces, and a functional layout full of opportunity. The woodburning fireplace is functional and adds to the cozy character throughout the home. Recent big-ticket improvements provide peace of mind including a new roof in 2024, many new windows in 2024, recently updated plumbing, and recently updated electrical. Furnace was replaced in 2022 and includes a 10-year warranty. Basement work has already been completed and workmanship is war
Key facts
- Updated electrical
- Furnace replaced
- New roof
Tags
Property features AI
Finance
- Other: Listed by Mike Thomas Assoc., Inc.
Exterior
- Parking: Detached off-street garage (1 car)
- Utilities: Public water; Public sewer
- Home design: Single-family residence, site-built; One story
- Construction: Vinyl siding
- Exterior features: Level lot; Lot dimensions approximately 40 x 117 (0.11 acre); Subdivision: Harrison Hill
Interior
- Bathrooms: One full bathroom; One half bathroom; One main-level bathroom
- Heating & cooling: Natural gas forced-air heating; No cooling
- Interior features: Living room fireplace; Full unfinished basement with crawl space
- Laundry & utility: Laundry in basement
Neighborhood map
What this means for you Summary
Snapshot
- This is a 4-bed/1.5-bath single-family listed at $160k.
Deal economics
- At list price, monthly cash flow is $145 ($2k/yr) — positive.
- The deal already cash-flows at list — no discount required.
- To meet the 1% rule (rent ≥ 1% of price), the offer needs to be $138k (13.8% below list).
- Recommended offer: $138k (13.8% below list) — sets the bar for 1% rule.
- Cap rate 7.4% vs local median 4.8% in Fort Wayne — top-decile yield for the area; either an underpriced asset or a hidden risk that comps aren't pricing in. Stress-test before assuming the spread holds.
Location & tenants
- Location reads 84/100 on livability (#6 in IN, #676 nationally) — a professional / high-income tenant draw. Strengths: amenities A+, commute A+, cost of living A+; Watch: crime C-, employment D+.
- Fort Wayne Community Schools (urban): math 22% / reading 29% proficiency, ranked #263 of 301 in IN (top 87%) — low school quality limits family demand, transient renter base, plan for 1-2y turnover; 60% free/reduced lunch — lower-income household profile, screen leases tightly.
- Zoned schools: South Wayne Elementary School (math 17% / reading 17%, grade F, #837 of 994 statewide, top 86%, 362 students, 88% FRL); Portage Middle School (math 8% / reading 18%, grade F, #304 of 330 statewide, top 94%, 436 students, 79% FRL); South Side High School (math 12% / reading 39%, grade F, #322 of 369 statewide, top 87%, 1,423 students, 73% FRL) — zoned schools average 80% FRL vs 60% district-wide (20 pts higher); higher-poverty schools than district average — tighter screening recommended.
- Market conditions: Rents rising fast (+8.2%/yr); 94 active listings in the ZIP; 19 comparable units currently listed for rent nearby; rentals at typical pace (median 21d on market — plan ~3-4 weeks tenant-placement turnaround); 1,861 units permitted in Allen County in 2024 (576 in 5+ unit buildings).
Forward outlook
- Local home prices are declining (-3.0%/yr); year-one equity from $1k of loan paydown is wiped out by about $5k of value loss. Plan a longer hold.
- Allen County population projected at +10% by 2050 — modest demand growth; plan on rents tracking national, not racing it.
- At projected returns (-3.0% appreciation + 8.0% rent growth), your $45k cash investment doubles in ~10 years — after that, you're playing with house money.
Negotiation context
- It's been on market 36 days — a 3% lower offer ($155k) is reasonable based on typical stale-listing flexibility.
- 6 sale attempts since 2y ago with the ask held roughly flat each time — persistent listings suggest the price (not the market) is what's stuck; bring a comps-based counter.
Risks & watch-outs
- Watch-outs: built in 1940 — expect roof / HVAC / electrical / plumbing capex.
Questions for the listing agent
- It's been on market 36 days. Have you received any prior offers? Is the seller open to a 14% concession, seller financing, or rate buy-down credit?
- Built in 1940 — when were the roof, HVAC, electrical panel, plumbing, and water heater last replaced?
- Is there a deadline driving the sale (1031 exchange, divorce, estate, relocation)? That informs how much negotiation room exists.
- Schools are D-rated, which usually means shorter tenancies and higher turnover. Who's the typical renter profile here, and what's been the actual vacancy rate?
- What's the average days-on-market for RENTAL listings here right now (not sales)? A rising rental-DOM trend means longer vacancies and softer asking-rent achievability than the comps imply.
- What's the recent tenant-quality profile in this submarket — average credit score on applications, eviction rate, late-payment / NSF rate, and stable-employment percentage? A property-management company in the area should have these aggregated.
- How much new for-sale + rental construction is in the pipeline within 1–3 miles? Heavy new supply typically softens prices + rents 12–24 months out; constrained supply supports both.
Investment metrics
- 1% rule
- 0.86% ✗
- Cap rate
- 7.38%
- Cash-on-cash
- 3.88%
- DSCR
- 1.17
- GRM
- 9.7
CMA / ARV
- ARV (median comp)
- $179,947
- List price
- $159,900
- Delta
- -11.14%
- Verdict
- UNDERPRICED
- Comps
- 20 within 1.0 mi
Show comp detail 12 sales within ~0.75 mi
| Address | Dist | Beds/Ba | Sqft | Sold | Price | $/sf | Match |
|---|---|---|---|---|---|---|---|
| 4628 W Lafayette Esplanade Blvd | 0.16mi | 4/2.0 | 1,648 (+0%) | 2mo | $180,000 | $109 | 89 |
| 326 Lexington Ct | 0.32mi | 4/2.0 | 1,656 (+0%) | 3mo | $187,000 | $113 | 80 |
| 306 W Sherwood Ter | 0.15mi | 3/2.5 (-1) | 1,757 (+7%) | 1mo | $180,000 | $102 | 72 |
| 4233 Arlington Ave | 0.45mi | 3/1.5 (-1) | 1,696 (+3%) | 2mo | $220,000 | $130 | 67 |
| 444 W Fairfax Ave | 0.57mi | 4/1.5 | 1,596 (-3%) | 3mo | $150,000 | $94 | 66 |
| 4707 S Calhoun St | 0.15mi | 3/2.0 (-1) | 1,456 (-12%) | 2mo | $200,000 | $137 | 65 |
| 4720 Beaver Ave | 0.71mi | 3/1.5 (-1) | 1,668 (+1%) | 1mo | $260,000 | $156 | 59 |
| 3606 S Harrison St | 0.66mi | 3/1.5 (-1) | 1,555 (-6%) | 2mo | $211,000 | $136 | 53 |
| 4727 Weisser Park Ave | 0.63mi | 3/1.0 (-1) | 1,728 (+5%) | 3mo | $139,000 | $80 | 53 |
| 4405 Tacoma Ave | 0.55mi | 3/1.5 (-1) | 1,456 (-12%) | 2mo | $240,000 | $165 | 48 |
| 326 Arcadia Ct | 0.72mi | 3/1.0 (-1) | 1,526 (-7%) | 1mo | $171,000 | $112 | 46 |
| 4615 Beaver Ave | 0.71mi | 3/1.5 (-1) | 1,794 (+9%) | 3mo | $255,000 | $142 | 45 |
Match score weights: distance 35% · size 25% · config 20% · recency 20%. Top-matched comps best support the ARV.
Projected returns pro-forma
-3.0% appreciation · 8.0% rent growth · sell at horizon
- IRR
- -5.5%
- Equity multiple
- 0.79×
- Total profit
- $-9,489
- Equity at exit
- $23,842
- IRR
- 8.9%
- Equity multiple
- 1.81×
- Total profit
- $36,447
- Equity at exit
- $13,825
Cash invested: $44,772 (down + closing). Projections, not guarantees.
Landlord ↔ Tenant lean methodology
- Overall (STATE)
- 90 Strongly Landlord-Friendly
- State Indiana
- 90 Strongly Landlord-Friendly · R+11
- County
- — inherits STATE
- City
- — inherits STATE
ZIP-level market 46807
- Rents YoY
- 8.2%
- Active inventory
- 94
- Price-to-rent
- 9.7×
Monthly cashflow live
- Estimated rent
- $1,379 high interval (Pro) →
- Mortgage (P&I)
- −$839
- Tax from tax record
- −$39 /mo · $473/yr
- Insurance
- −$67
- HOA
- −$0
- Vacancy / Maint / Mgmt
- −$290
- Net cashflow
- $145
Break-even live
UW: 25.0% down · 7.5% · 30yr · 1.5% tax · 5.0% vac · 8.0% maint · 8.0% mgmt
Financing live
Cash to close
- Down payment
- $39,975
- Closing costs
- $4,797
- Reserves months
- —
- Total cash needed
- —
Loan-product check · same deal, 3 products live
Conventional
25% down · 7.5% · 30yr
- Down + closing
- —
- Monthly P&I
- —
- Monthly cashflow
- —
- DSCR
- —
- Eligible?
- —
Personal DTI + credit; lowest rate.
DSCR
20% down · 8.5% · 30yr
- Down + closing
- —
- Monthly P&I
- —
- Monthly cashflow
- —
- DSCR
- —
- Eligible?
- —
No personal income docs; deal must DSCR.
Hard money
10% down · 12.0% · 12mo
- Down + closing
- —
- Monthly P&I
- —
- Monthly cashflow
- —
- DSCR
- —
- Eligible?
- —
Short-term bridge; refi at stabilization.
Rent comps 19 comps
| Address | Beds | Baths | Sqft | Rent | $/sqft | DOM | Units | Dist |
|---|---|---|---|---|---|---|---|---|
| 4133 Lafayette St Fort Wayne, IN | 4.0 | 2.0 | 1640 | $1,400 | $0.85 | 21d | 1 | 0.38mi |
| 4201 S Wayne Ave Fort Wayne, IN | 3.0 | 1.5 | 1252 | $1,400 | $1.12 | 21d | 1 | 0.55mi |
| 3510 S Harrison St Fort Wayne, IN | 3.0 | 1.0 | 1248 | $975 | $0.78 | 13d | 1 | 0.70mi |
| 3221 S Harrison St Fort Wayne, IN | 5.0 | 2.0 | 2062 | $1,650 | $0.80 | 21d | 1 | 0.87mi |
| 3221 Webster St Fort Wayne, IN | 5.0 | 2.0 | 1885 | $1,575 | $0.84 | 13d | 1 | 0.88mi |
| 1023 Hamilton Ave Fort Wayne, IN | 3.0 | 1.0 | 1152 | $1,075 | $0.93 | 13d | 1 | 0.98mi |
| 700 Candlelite Ct Fort Wayne, IN | 2.0–3.0 | 1.0–2.5 | 1388 | $1,399 | $1.01 | 13d | 4 | 0.98mi |
| 3008 Webster St Fort Wayne, IN | 3.0 | 1.0 | 1344 | $1,449 | $1.08 | 21d | 1 | 1.03mi |
| 522 Pinegrove Ln Fort Wayne, IN | 2.0–3.0 | 1.0–1.5 | 1248 | $1,259 | $1.01 | 13d | 8 | 1.07mi |
| 724 Kinnaird Ave Fort Wayne, IN | 3.0 | 1.5 | 1880 | $1,450 | $0.77 | 43d | 1 | 1.08mi |
| 116 E Pontiac St Fort Wayne, IN | 3.0 | 1.5 | 1400 | $1,175 | $0.84 | 21d | 1 | 1.21mi |
| 2616 S Harrison St Fort Wayne, IN | 4.0 | 2.0 | 1908 | $1,500 | $0.79 | 43d | 1 | 1.23mi |
| 1024 Colerick St Fort Wayne, IN | 4.0 | 1.0 | 1388 | $1,065 | $0.77 | 21d | 1 | 1.23mi |
| 4705 S Anthony Blvd Fort Wayne, IN | 3.0 | 1.0 | 1110 | $1,050 | $0.95 | 13d | 1 | 1.27mi |
| 451 E Pontiac St Fort Wayne, IN | 3.0 | 1.0 | 1308 | $1,050 | $0.80 | 43d | 1 | 1.27mi |
| 2530 Lafayette St Fort Wayne, IN | 4.0 | 1.0 | 1816 | $1,500 | $0.83 | 43d | 1 | 1.29mi |
| 3009 Holton Ave Fort Wayne, IN | 3.0 | 1.0 | 1212 | $1,400 | $1.16 | 13d | 1 | 1.39mi |
| 1730 Scotsdale Dr Fort Wayne, IN | 3.0 | 1.0 | 1192 | $1,125 | $0.94 | 13d | 1 | 1.46mi |
| 2431 Fox Ave Fort Wayne, IN | 3.0 | 1.5 | 1522 | $1,550 | $1.02 | 13d | 1 | 1.47mi |
Listing history 29 events
-
2026-06-18days on market $159,900 Active 36 DOM
-
2026-06-17days on market $159,900 Active 35 DOM
-
2026-06-16days on market $159,900 Active 34 DOM
-
2026-06-15days on market $159,900 Active 33 DOM
-
2026-06-14days on market $159,900 Active 31 DOM
-
2026-06-10days on market $159,900 Active 28 DOM
-
2026-06-09days on market $159,900 Active 27 DOM
-
2026-06-08days on market $159,900 Active 26 DOM
-
2026-06-07days on market $159,900 Active 25 DOM
-
2026-06-03days on market $159,900 Active 21 DOM
-
2026-06-02days on market $159,900 Active 20 DOM
-
2026-06-01days on market $159,900 Active 19 DOM
-
2026-05-31days on market $159,900 Active 18 DOM
-
2026-05-30days on market $159,900 Active 17 DOM
-
2026-05-13$159,900 Active 1127-char remark
-
2026-03-01status Pending
-
2026-02-14price $157,000
-
2025-11-23price $168,000
-
2025-11-06price $156,000
-
2025-09-28$172,900 Active
-
2025-08-06price $184,400
-
2025-07-25$186,400 Active
-
2025-06-29price $192,000
-
2025-06-05$197,000 Active
-
2025-01-11price $197,000
-
2024-10-04$198,900 Active
-
2024-08-16price $199,000
-
2024-07-10price $204,000
-
2024-06-21$209,000 Active
ⓘ Source: listings_history table (triggers on properties + properties_extension) + one-shot
backfill from property_details.listing_events for pre-trigger history.
Tax reassessment forecast IN · Partial reset (capped growth)
- Current annual tax
- $473 · $39/mo
- Projected year-2 tax
- $916 · $76/mo
- Expected delta
- +$443/yr (+$37/mo · 93.8%)
ⓘ Screening estimate from a state-policy table — verify with the county assessor before closing.
Climate risk First Street
- Flood 1/10 Low FEMA zone X (unshaded) · 0% chance over 30 yrs
- Wildfire 1/10 Low
- Heat 3/10 Moderate 7 d/yr ≥100°F today · 17 d/yr by 30 yrs out
- Wind 2/10 Low
- Air quality 3/10 Moderate 2 unhealthy d/yr today · 3 by 30 yrs out
Nearby sold comps map
Loading sold comps map…
Walkable amenities ~0.75 mi
Loading nearby amenities…
Taxation est. · year 1
- Rental income
- $16,545
- − Mortgage interest
- −$8,957
- − Property taxes
- −$473
- − Insurance
- −$800
- − Repairs & maintenance
- −$1,324
- − Management
- −$1,324
- − Depreciation
- −$4,652
- Taxable loss
- −$983
- Est. tax savings @ 24.0%
- +$236
- After-tax cash flow
- $1,972/yr
For passive investors: Depreciation is non-cash, so a rental often shows a tax loss while cash-flowing — sheltering income. Rental losses are passive: they offset passive income freely, and up to $25,000/yr can offset ordinary (W-2) income if you actively participate and your MAGI is under $100k (phasing out to $0 by $150k); unused losses carry forward. On sale, claimed depreciation is recaptured at up to 25%, and gains may owe capital-gains tax (a 1031 exchange can defer both). Figures are a year-1 estimate at your 24.0% rate — not tax advice; consult a CPA.
Schools (NCES district)
- District
- Fort Wayne Community Schools
- NCES district ID
- 1803630
- Math proficiency
- 22% ▼ -11.00%
- Reading proficiency
- 29% ▼ -7.00%
- Median HH income
- $41,951
- Composite
- 21.68/100
- National rank
- #8275
- State rank
- #263 of 301 in IN
Livability — Fort Wayne
- Score
- 84/100
- State rank
- #6
- US rank
- #676
Category grades
Schools grade is shown separately in the Schools card above.
Census & demographics
- Census place
- Fort Wayne, IN
- County
- Allen County · 326,813 people
- City population
- 326,813
- Metro
- Fort Wayne, IN
- Population (ZIP)
- 16,317
- Household income
- $58,685
- Rent vs Own
- Severe rent burden
- 680.0
Population outlook (Allen County) Hauer SSP2
- Today (2025)
- 394,020 people
- By 2030
- 405,128 · +2.8%
- By 2040
- 423,476 · +7.5%
- By 2050
- 435,137 · +10.4%
- By 2075
- 450,293 · +14.3%
- By 2100
- 424,101 · +7.6%
Race, ethnicity, and origin ACS 2023
- Neighborhood character
- Diverse neighborhood (Simpson 0.66)
- Race & ethnicity
- White 54% Two or more races 19% Hispanic / Latino 16% Black 14% Asian 4%
- Hispanic origin (detail)
- Mexican 15%
- Common ancestry
- Slovak 3% Lithuanian 3% Romanian 2%
- Foreign-born
- 9% · Canada, Philippines, Jamaica
- Languages at home
- 82% English-only · Spanish 13% Other Asian/Pacific 4% German/W. Germanic 1%
Political lean MEDSL · Allen
- 2024 margin
- R (+12.5) · D 42.9% · R 55.4% · Other 1.7%
- 2008→2024 swing
- -8.1pp toward R · 2008: -4.3pp · 2024: -12.5pp
- All cycles
- 2024: R+12.5 2020: R+11.2 2016: R+19.6 2012: R+16.8 2008: R+4.3
Not yet ingested
- Civics
- —
Market trends
- HPI YoY
- ▼ -318.66%
- Current HPI
- 272.6238
- Rent YoY
- ▲ 8.24%
- Metro
- Fort Wayne, IN
- State GDP YoY
- ▲ 2.90%
- F500 in state
- 18
Industry mix (Fortune 500 HQ in IN)
| Industry | F500 HQs | Revenue |
|---|---|---|
| Industrial Machinery | 2 | $37B |
|
||
| Healthcare | 1 | $177B |
|
||
| Pharmaceuticals | 1 | $45B |
|
||
| Metals / Steel | 1 | $18B |
|
||
| Agriculture | 1 | $17B |
|
||
| Packaging | 1 | $12B |
|
||
Price history
-23.5% since first listed15 events — show timeline
- 2026-05-13 Listed $159,900 IRMLS
- 2026-03-01 Pending — IRMLS
- 2026-02-14 Price Changed $157,000 IRMLS
- 2025-11-23 Price Changed $168,000 IRMLS
- 2025-11-06 Price Changed $156,000 IRMLS
- 2025-09-28 Listed $172,900 IRMLS
- 2025-08-06 Price Changed $184,400 IRMLS
- 2025-07-25 Listed $186,400 IRMLS
- 2025-06-29 Price Changed $192,000 IRMLS
- 2025-06-05 Listed $197,000 IRMLS
- 2025-01-11 Price Changed $197,000 IRMLS
- 2024-10-04 Listed $198,900 IRMLS
- 2024-08-16 Price Changed $199,000 IRMLS
- 2024-07-10 Price Changed $204,000 IRMLS
- 2024-06-21 Listed $209,000 IRMLS
Property tax history
+0.8%/yrLatest (2024): $473 · +6.1% YoY. Source: county tax records.
Cash-flow waterfall
monthlySold comps — $/sqft
last 12 mo · ≤1 miLoading sold comps…