 Duplex
2811-2813 W 55th Ct N · Wichita, KS
Flood risk No data
- FEMA flood zone
- —
- Chance of flooding over 30 yrs
- —
- Est. flood insurance / yr
- —
Fire risk No data
- Est. fire insurance / yr
- —
Heat risk No data
- Hot days now (above threshold)
- —
- Hot days in 30 yrs
- —
Wind risk No data
- Chance of severe wind over 30 yrs
- —
Air-quality risk No data
- Unhealthy air days now
- —
- Unhealthy air days in 30 yrs
- —
Risk factors via First Street. Map © Google.
Why this score? — see what drove the D grade
The composite is a weighted blend of 9 inputs, each scored 0–100. Each bar is that input's sub-score; the figure is the points it added to the 100-point composite (weight × sub-score).
- Cash flow +13.3/30.0
- ARV discount +7.5/15.0
- 1% rule +4.1/10.0
- DSCR +4.0/10.0
- Condition / age +4.0/5.0
- Livability +3.6/5.0
- Schools +3.1/10.0
- Rent growth +2.5/5.0
- Appreciation +0.0/10.0
$355,500
🖨 Deal sheet (PDF) 📄 Offer letter ✓ Due diligence
Multi-family units
County records classify this as Multi-Family (5+ Unit). Listing-text estimate: 2 units. estimate disagrees with records
5+ unit building — per-unit beds/baths from public records are typically unavailable; the breakdown below (if shown) is an estimate from the listing text.
Key facts
- Zero entry
- Large serving bar
- Private bathroom
Tags
Property features AI
Finance
- HOA & community: Has association; Association fee $1,200; HOA initiation fee $500; Association fee includes lawn service
Exterior
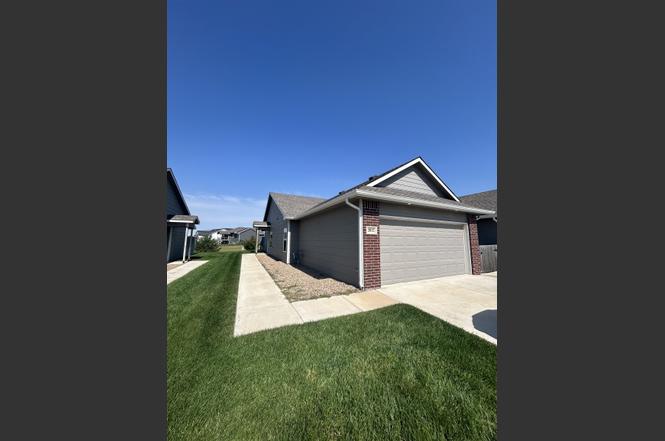
- Parking: Detached 2-car garage
- Utilities: Public sewer available
- Home design: Duplex
- Construction: Composition roof; No basement / slab foundation
- Exterior features: One-level property; Patio
Interior
- Kitchen: Dishwasher; Disposal; Microwave; Refrigerator; Range
- Bathrooms: 2 full bathrooms
- Heating & cooling: Central air conditioning (electric); Natural gas heating
- Interior features: Dishwasher; Disposal; Microwave; Refrigerator; Range
- Laundry & utility: Washer; Dryer; Laundry on main floor
Neighborhood map
What this means for you Summary
Snapshot
- This is a 2 × 3-bed/2.0-bath units multifamily listed at $356k. Condition is rated good.
Deal economics
- At list price, monthly cash flow is $-3 ($-33/yr) — negative. Per door: $-1/mo.
- To cash-flow at today's rent, offer at most $355k (0.1% below list).
- To meet the 1% rule (rent ≥ 1% of price), the offer needs to be $323k (9.1% below list).
- Recommended offer: $313k (12.0% below list) — sets the bar for market timing.
Location & tenants
- Location reads 72/100 on livability (#100 in KS) — a middle-class / working-renter tenant base. Strengths: amenities A+, cost of living A+, housing A+; Watch: employment D+, crime F, commute F.
- Valley Center Pub Schools (suburban): math 30% / reading 37% proficiency, ranked #57 of 169 in KS (top 34%) — families likely to look elsewhere, expect single-tenant / working-renter base with shorter leases.
- Zoned schools: Valley Center Intermediate School (math 33% / reading 54%, grade F, #268 of 684 statewide, top 39%, 480 students, 41% FRL); Valley Center Middle School (math 23% / reading 28%, grade F, #104 of 219 statewide, top 49%, 761 students, 42% FRL); Valley Center High (math 22% / reading 22%, grade F, #165 of 327 statewide, top 55%, 995 students, 34% FRL).
- Market conditions: 60 active listings in the ZIP; 2,613 units permitted in Sedgwick County in 2024 (258 in 5+ unit buildings).
- At $3,233/mo this rent would consume 54% of the median local household income ($72k/yr) (locally 267% of renters already pay >50% of income on rent) — very limited rent-growth headroom before tenants either downsize or default.
Forward outlook
- Local home prices are declining (-3.0%/yr); year-one equity from $2k of loan paydown is wiped out by about $11k of value loss. Plan a longer hold.
- Sedgwick County population projected at +5% by 2050 — modest demand growth; plan on rents tracking national, not racing it.
Negotiation context
- It's been on market 348 days — a 12% lower offer ($313k) is reasonable based on typical stale-listing flexibility.
- 2 sale attempts; this cycle's ask is 24417% above the opening price — seller raised mid-cycle; expect resistance to lowballs.
Questions for the listing agent
- What do current leases actually rent for vs. the listed asking? Can we see a recent rent roll and the last 12 months of T-12 income?
- It's been on market 348 days. Have you received any prior offers? Is the seller open to a 12% concession, seller financing, or rate buy-down credit?
- Can we see the unit-by-unit rent roll, current vacancy, and any below-market leases? What's the average tenancy length?
- What capital expenditures (roof, boiler, parking lot, exteriors) have been made in the last 5 years, and what's planned in the next 2?
- What does the HOA fee cover, when was the last increase, and are there any pending special assessments or reserve-fund shortfalls?
- Why hasn't it sold? Are there any deal-killer items the seller is aware of (foundation, flood, title, zoning, code violations)?
- Is there a deadline driving the sale (1031 exchange, divorce, estate, relocation)? That informs how much negotiation room exists.
- Schools are F-rated, which usually means shorter tenancies and higher turnover. Who's the typical renter profile here, and what's been the actual vacancy rate?
- Crime grade is F in this area — have there been break-ins, vandalism, or insurance claims at this property in the last 3 years? What carrier currently insures it and at what premium?
- The area grade is low — what's the realistic commute time and amenity access for the typical tenant pool here? Any planned neighborhood developments (good or bad) we should know about?
- What's the average days-on-market for RENTAL listings here right now (not sales)? A rising rental-DOM trend means longer vacancies and softer asking-rent achievability than the comps imply.
- What's the recent tenant-quality profile in this submarket — average credit score on applications, eviction rate, late-payment / NSF rate, and stable-employment percentage? A property-management company in the area should have these aggregated.
- How much new apartment / multifamily construction is in the pipeline within 1–3 miles? Heavy new supply (>2% of stock underway) typically softens rents 12–24 months out; light construction supports rent growth.
Investment metrics
- 1% rule
- 0.91% ✗
- Cap rate
- 6.28%
- Cash-on-cash
- -0.03%
- DSCR
- 1.00
- GRM
- 9.2
CMA / ARV
No comps found within radius.
Projected returns pro-forma
-3.0% appreciation · 3.0% rent growth · sell at horizon
- IRR
- -16.3%
- Equity multiple
- 0.42×
- Total profit
- $-57,669
- Equity at exit
- $53,006
- IRR
- -8.0%
- Equity multiple
- 0.50×
- Total profit
- $-49,991
- Equity at exit
- $30,737
Cash invested: $99,540 (down + closing). Projections, not guarantees.
Landlord ↔ Tenant lean methodology
- Overall (STATE)
- 83 Strongly Landlord-Friendly
- State Kansas
- 83 Strongly Landlord-Friendly · R+10
- County
- — inherits STATE
- City
- — inherits STATE
ZIP-level market 67204
- Active inventory
- 60
- Price-to-rent
- 18.3×
Monthly cashflow live
- Estimated rent
- $3,233 medium interval (Pro) →
- Mortgage (P&I)
- −$1,864
- Tax est. 1.5%
- −$444 /mo · $5,332/yr
- Insurance
- −$148
- HOA
- −$100
- Vacancy / Maint / Mgmt
- −$679
- Net cashflow
- $-3
Break-even live
Sensitivity live
| Price | -10% $243 | -5% $120 | +0% $-3 | +5% $-126 | +10% $-248 |
|---|---|---|---|---|---|
| Rent | -10% $-258 | -5% $-130 | +0% $-3 | +5% $125 | +10% $253 |
| Rate | -1.0pp $176 | -0.5pp $88 | base $-3 | +0.5pp $-95 | +1.0pp $-189 |
2-unit breakdown (identical units grouped — click to expand)
| Units | Beds | Baths | Est. rent |
|---|---|---|---|
| 2× units | 3 | 2 | $3,234 |
| #1 | 3 | 2 | $1,617 |
| #2 | 3 | 2 | $1,617 |
| Total (2 units) | $3,233 | ||
UW: 25.0% down · 7.5% · 30yr · 1.5% tax · 5.0% vac · 8.0% maint · 8.0% mgmt
Financing live
Cash to close
- Down payment
- $88,875
- Closing costs
- $10,665
- Reserves months
- —
- Total cash needed
- —
Loan-product check · same deal, 3 products live
Conventional
25% down · 7.5% · 30yr
- Down + closing
- —
- Monthly P&I
- —
- Monthly cashflow
- —
- DSCR
- —
- Eligible?
- —
Personal DTI + credit; lowest rate.
DSCR
20% down · 8.5% · 30yr
- Down + closing
- —
- Monthly P&I
- —
- Monthly cashflow
- —
- DSCR
- —
- Eligible?
- —
No personal income docs; deal must DSCR.
Hard money
10% down · 12.0% · 12mo
- Down + closing
- —
- Monthly P&I
- —
- Monthly cashflow
- —
- DSCR
- —
- Eligible?
- —
Short-term bridge; refi at stabilization.
HOA detail
- Monthly dues
- $100 · $1,200/yr
Listing history 20 events
-
2026-06-22days on market $355,500 Active 348 DOM
-
2026-06-18days on market $355,500 Active 345 DOM
-
2026-06-17days on market $355,500 Active 344 DOM
-
2026-06-16days on market $355,500 Active 343 DOM
-
2026-06-15days on market $355,500 Active 342 DOM
-
2026-06-14days on market $355,500 Active 340 DOM
-
2026-06-13days on market $355,500 Active 339 DOM
-
2026-06-10days on market $355,500 Active 337 DOM
-
2026-06-09days on market $355,500 Active 336 DOM
-
2026-06-08days on market $355,500 Active 335 DOM
-
2026-06-07days on market $355,500 Active 334 DOM
-
2026-06-05days on market $355,500 Active 331 DOM
-
2026-06-03days on market $355,500 Active 330 DOM
-
2026-06-02days on market $355,500 Active 329 DOM
-
2026-06-01days on market $355,500 Active 328 DOM
-
2026-05-31days on market $355,500 Active 327 DOM
-
2026-05-30days on market $355,500 Active 326 DOM
-
2026-05-20$1,450
-
2026-04-29price $355,500
-
2025-07-08$362,500 Active
ⓘ Source: listings_history table (triggers on properties + properties_extension) + one-shot
backfill from property_details.listing_events for pre-trigger history.
Nearby sold comps map
Loading sold comps map…
Walkable amenities ~0.75 mi
Loading nearby amenities…
Taxation est. · year 1
- Rental income
- $38,796
- − Mortgage interest
- −$19,914
- − Property taxes
- −$5,332
- − Insurance
- −$1,778
- − Repairs & maintenance
- −$3,104
- − Management
- −$3,104
- − HOA
- −$1,200
- − Depreciation
- −$10,342
- Taxable loss
- −$5,977
- Est. tax savings @ 24.0%
- +$1,434
- After-tax cash flow
- $1,402/yr
For passive investors: Depreciation is non-cash, so a rental often shows a tax loss while cash-flowing — sheltering income. Rental losses are passive: they offset passive income freely, and up to $25,000/yr can offset ordinary (W-2) income if you actively participate and your MAGI is under $100k (phasing out to $0 by $150k); unused losses carry forward. On sale, claimed depreciation is recaptured at up to 25%, and gains may owe capital-gains tax (a 1031 exchange can defer both). Figures are a year-1 estimate at your 24.0% rate — not tax advice; consult a CPA.
Condition & rehab AI · 13 photos
This multi-family property is in good condition with minimal repairs needed. Painting the exterior and cleaning gutters would significantly enhance its curb appeal and value.
Value-add opportunities
- Both Paint exterior — Enhances curb appeal and value
- Both Clean gutters — Improves drainage and aesthetics
Renovation cost estimate screening
Value-add ROI direction
- Both Paint exterior — Enhances curb appeal and value ↑
- Both Clean gutters — Improves drainage and aesthetics ↑
ⓘ Cost ranges are severity-bucket heuristics (US national rule-of-thumb). Get contractor quotes + a written scope before underwriting a rehab budget.
Schools (NCES district)
- District
- Valley Center Pub Schools
- NCES district ID
- 2012510
- Math proficiency
- 30% ▼ -9.00%
- Reading proficiency
- 37% ▼ -6.00%
- Median HH income
- $66,689
- Composite
- 30.68/100
- National rank
- #6178
- State rank
- #57 of 169 in KS
Livability — Wichita
- Score
- 72/100
- State rank
- #100
- US rank
- #5730
Category grades
Schools grade is shown separately in the Schools card above.
Census & demographics
- Census place
- Wichita, KS
- County
- Sedgwick County · 432,957 people
- City population
- 365,168
- Metro
- Wichita, KS
- Population (ZIP)
- 22,538
- Household income
- $71,999
- Rent vs Own
- Severe rent burden
- 267.0
Population outlook (Sedgwick County) Hauer SSP2
- Today (2025)
- 537,014 people
- By 2030
- 546,984 · +1.9%
- By 2040
- 559,141 · +4.1%
- By 2050
- 562,027 · +4.7%
- By 2075
- 557,255 · +3.8%
- By 2100
- 513,383 · -4.4%
Race, ethnicity, and origin ACS 2023
- Neighborhood character
- Diverse neighborhood (Simpson 0.58)
- Race & ethnicity
- White 49% Hispanic / Latino 42% Two or more races 19% Black 3% Asian 1%
- Hispanic origin (detail)
- Mexican 41%
- Common ancestry
- Lithuanian 3% Italian 2% Serbian 1%
- Foreign-born
- 17% · Canada, Vietnam
- Languages at home
- 63% English-only · Spanish 35%
Political lean MEDSL · Sedgwick
- 2024 margin
- R (+13.8) · D 42.3% · R 56.1% · Other 1.6%
- 2008→2024 swing
- -1.1pp toward R · 2008: -12.7pp · 2024: -13.8pp
- All cycles
- 2024: R+13.8 2020: R+12.6 2016: R+19.1 2012: R+19.7 2008: R+12.7
Not yet ingested
- Civics
- —
Market trends
- HPI YoY
- ▼ -162.52%
- Current HPI
- 246.2816
- Rent YoY
- —
- Metro
- Wichita, KS
- State GDP YoY
- —
- F500 in state
- 0
Price history
-99.6% since first listed3 events — show timeline
- 2026-05-20 Listed for Rent $1,450 APPFOLIO
- 2026-04-29 Price Changed $355,500 SCKMLS as Distributed by MLS Grid
- 2025-07-08 Listed $362,500 SCKMLS as Distributed by MLS Grid
Cash-flow waterfall
monthlySold comps — $/sqft
last 12 mo · ≤1 miLoading sold comps…