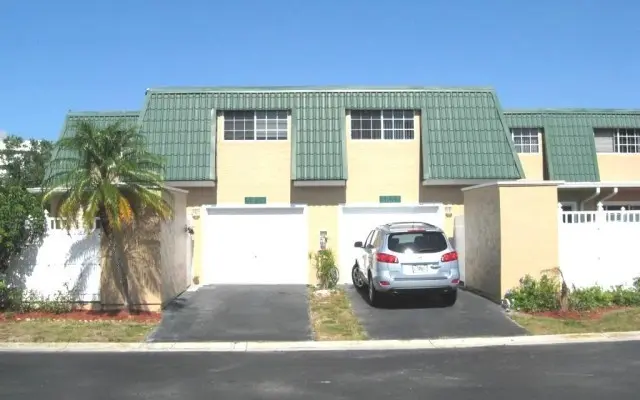
5837 Whiting Ct · McGregor, FL
Flood risk 9/10 · Severe
- FEMA flood zone
- AE
- Chance of flooding over 30 yrs
- 0.99%
- Est. flood insurance / yr
- $1,737 – $8,500
Fire risk 1/10 · Minimal
- Est. fire insurance / yr
- $947 – $1,759
Heat risk 10/10 · Severe
- Hot days now (above 107°F)
- 7 days/yr
- Hot days in 30 yrs
- 27 days/yr
Wind risk 10/10 · Severe
- Chance of severe wind over 30 yrs
- 99.0%
Air-quality risk 2/10 · Minimal
- Unhealthy air days now
- 1 days/yr
- Unhealthy air days in 30 yrs
- 1 days/yr
Risk factors via First Street. Map © Google.
Why this score? — see what drove the D grade
The composite is a weighted blend of 9 inputs, each scored 0–100. Each bar is that input's sub-score; the figure is the points it added to the 100-point composite (weight × sub-score).
- Cash flow +15.0/30.0
- ARV discount +7.5/15.0
- 1% rule +5.0/10.0
- DSCR +5.0/10.0
- Schools +4.1/10.0
- Livability +3.6/5.0
- Condition / age +2.5/5.0
- Rent growth +0.5/5.0
- Appreciation +0.0/10.0
$5,000
🖨 Deal sheet 📄 Offer letter ✓ Due diligence
Listing remarks
Foreclosure Auction Ends June 04, 2026 at 09:00 AM EST. Discover this inviting 4-bedroom, 2.5-bathroom single-family home, offering a great opportunity in the desirable Fort Myers area. The list price is the opening bid for the online auction. Sold As-is. Explore more details and submit your bid through Federa.
Key facts
- Garage
- Built 1975
- Listed 6 days
Property features AI
Exterior
- Parking: 1-car garage
- Home design: Residential property
- Exterior features: Zoned RM-2
Interior
- Bathrooms: 2 full bathrooms; 1 half bathroom
- Interior features: Located near the end of a cul-de-sac (per directions)
Neighborhood map
What this means for you Summary
Snapshot
- This is a 4-bed/3.0-bath condo listed at $5k.
Deal economics
- At list price, monthly cash flow is $1k ($15k/yr) — positive.
- The deal already cash-flows at list — no discount required.
- Meets the 1% rule at list price ($2k rent vs $5k).
- Cap rate 417.0% vs local median 1.1% in McGregor — top-decile yield for the area; either an underpriced asset or a hidden risk that comps aren't pricing in. Stress-test before assuming the spread holds.
Location & tenants
- Location reads 71/100 on livability (#380 in FL) — a middle-class / working-renter tenant base. Strengths: crime A+, health & safety A, housing A-; Watch: cost of living D+, schools D, amenities F.
- Lee (suburban): math 47% / reading 50% proficiency, ranked #42 of 73 in FL (top 58%) — families likely to look elsewhere, expect single-tenant / working-renter base with shorter leases.
- Market conditions: Rents falling (-7.8%/yr); 619 active listings in the ZIP; 29 comparable units currently listed for rent nearby; rentals at typical pace (median 24d on market — plan ~3-4 weeks tenant-placement turnaround); solid renter incomes; 15,411 units permitted in Lee County in 2024 (4,686 in 5+ unit buildings).
- This rent runs 33% of the median local income ($80k/yr) — at the standard rent-burdened threshold; future hikes will face affordability resistance.
Forward outlook
- Local home prices are declining (-3.0%/yr); year-one equity from $35 of loan paydown is wiped out by about $150 of value loss. Plan a longer hold.
- Lee County population projected at +44% by 2050 — long-run rental-demand tailwind backs the buy-and-hold thesis.
- At projected returns (-3.0% appreciation + 0.0% rent growth), your $1k cash investment doubles in ~1 year — after that, you're playing with house money.
Negotiation context
- Only 6 days on market — expect competitive offers; lowballing is unlikely to land.
Risks & watch-outs
- Watch-outs: flood insurance adds $427/mo.
- Climate carrying-cost: in FEMA flood zone AE (mandatory federal flood insurance); severe wind risk, 99% chance of damaging wind over 30y; extreme-heat days projected 7→27/yr by 2055 (HVAC capex compounding) — expect insurance premiums to compound above CPI over the hold.
Questions for the listing agent
- Built in 1975 — when were the roof, HVAC, electrical panel, plumbing, and water heater last replaced?
- What's the actual annual flood-insurance premium (NFIP or private), and is the property in a SFHA with mandatory coverage?
- Any open or pending special assessments — roof, HVAC, plumbing, elevator, façade? What's the per-unit balance and payoff schedule, and is the seller paying it off at close or rolling it to the buyer?
- Is there a deadline driving the sale (1031 exchange, divorce, estate, relocation)? That informs how much negotiation room exists.
- Schools are D-rated, which usually means shorter tenancies and higher turnover. Who's the typical renter profile here, and what's been the actual vacancy rate?
- The area grade is low — what's the realistic commute time and amenity access for the typical tenant pool here? Any planned neighborhood developments (good or bad) we should know about?
- What's the average days-on-market for RENTAL listings here right now (not sales)? A rising rental-DOM trend means longer vacancies and softer asking-rent achievability than the comps imply.
- What's the recent tenant-quality profile in this submarket — average credit score on applications, eviction rate, late-payment / NSF rate, and stable-employment percentage? A property-management company in the area should have these aggregated.
- How much new apartment / multifamily construction is in the pipeline within 1–3 miles? Heavy new supply (>2% of stock underway) typically softens rents 12–24 months out; light construction supports rent growth.
Investment metrics
- 1% rule
- 44.19% ✓
- Cap rate
- 416.96%
- Cash-on-cash
- 1466.65%
- DSCR
- 66.26
- GRM
- 0.2
CMA / ARV
No comps found within radius.
Projected returns pro-forma
-3.0% appreciation · 0.0% rent growth · sell at horizon
- IRR
- —
- Equity multiple
- 54.45×
- Total profit
- $74,823
- Equity at exit
- $746
- IRR
- —
- Equity multiple
- 105.77×
- Total profit
- $146,677
- Equity at exit
- $432
Cash invested: $1,400 (down + closing). Projections, not guarantees.
Landlord ↔ Tenant lean methodology
- Overall (STATE)
- 87 Strongly Landlord-Friendly
- State Florida
- 87 Strongly Landlord-Friendly · R+3
- County
- — inherits STATE
- City
- — inherits STATE
ZIP-level market 33919
- Rents YoY
- -7.8%
- Active inventory
- 619
- Price-to-rent
- 0.2×
Monthly cashflow live
- Estimated rent
- $2,210 high interval (Pro) →
- Mortgage (P&I)
- −$26
- Tax est. 1.5%
- −$6 /mo · $75/yr
- Insurance
- −$2
- Flood insurance flood zone
- −$427 /mo · $5,118/yr
- HOA
- −$0
- Vacancy / Maint / Mgmt
- −$464
- Net cashflow
- $1,285
Break-even live
UW: 25.0% down · 7.5% · 30yr · 1.5% tax · 5.0% vac · 8.0% maint · 8.0% mgmt
Financing live
Cash to close
- Down payment
- $1,250
- Closing costs
- $150
- Reserves months
- —
- Total cash needed
- —
Loan-product check · same deal, 3 products live
Conventional
25% down · 7.5% · 30yr
- Down + closing
- —
- Monthly P&I
- —
- Monthly cashflow
- —
- DSCR
- —
- Eligible?
- —
Personal DTI + credit; lowest rate.
DSCR
20% down · 8.5% · 30yr
- Down + closing
- —
- Monthly P&I
- —
- Monthly cashflow
- —
- DSCR
- —
- Eligible?
- —
No personal income docs; deal must DSCR.
Hard money
10% down · 12.0% · 12mo
- Down + closing
- —
- Monthly P&I
- —
- Monthly cashflow
- —
- DSCR
- —
- Eligible?
- —
Short-term bridge; refi at stabilization.
Rent comps 29 comps
| Address | Beds | Baths | Sqft | Rent | $/sqft | DOM | Units | Dist |
|---|---|---|---|---|---|---|---|---|
| 4797 Albacore Ln Fort Myers, FL | 3.0 | 2.5 | 1391 | $1,900 | $1.37 | 23d | 1 | 0.05mi |
| 8910 College Pointe Ct Fort Myers, FL | 1.0–3.0 | 1.0–2.0 | 1076 | $2,473 | $2.30 | 1d | 18 | 0.25mi |
| 958 Indiana Ave Fort Myers, FL | 3.0 | 2.0 | 1422 | $2,500 | $1.76 | 23d | 1 | 0.32mi |
| 8251 Pathfinder Loop #621 Fort Myers, FL | 3.0 | 2.0 | 1306 | $4,000 | $3.06 | 23d | 1 | 0.34mi |
| 9000 Colby Dr Fort Myers, FL | 1.0–3.0 | 1.0–2.0 | 1078 | $2,342 | $2.17 | 23d | 9 | 0.40mi |
| 5820 Algiers St Fort Myers, FL | 3.0 | 3.0 | 935 | $1,899 | $2.03 | 23d | 1 | 0.48mi |
| 13140 Broadhurst Loop #306 Fort Myers, FL | 3.0 | 2.5 | 1562 | $2,500 | $1.60 | 23d | 1 | 0.49mi |
| 13120 Broadhurst Loop #505 Fort Myers, FL | 3.0 | 2.5 | 1409 | $1,995 | $1.42 | 23d | 1 | 0.51mi |
| 5883 Sand Oak Dr Fort Myers, FL | 3.0 | 2.0 | 1582 | $2,300 | $1.45 | 3d | 1 | 0.64mi |
| 6124 Principia Dr #2 Fort Myers, FL | 3.0 | 1.0 | 897 | $1,400 | $1.56 | 15d | 1 | 0.66mi |
| 806 Entrada Dr N Fort Myers, FL | 3.0 | 2.0 | 1556 | $2,200 | $1.41 | 23d | 1 | 0.66mi |
| 6182 Principia Dr #4 Fort Myers, FL | 3.0 | 1.0 | 897 | $1,345 | $1.50 | 23d | 1 | 0.76mi |
| 9521 Mariners Cove Ln Fort Myers, FL | 3.0 | 3.0 | 1840 | $3,000 | $1.63 | 23d | 1 | 1.04mi |
| 4410 Taffrail Ct Unit 2B Fort Myers, FL | 3.0 | 2.0 | 1581 | $2,200 | $1.39 | 23d | 1 | 1.07mi |
| 6671 Fiesta Way Fort Myers, FL | 3.0 | 2.0 | 1038 | $2,300 | $2.22 | 15d | 1 | 1.11mi |
| 4283 Island Cir Fort Myers, FL | 3.0 | 2.0 | 1360 | $1,850 | $1.36 | 23d | 1 | 1.13mi |
| 1608 Park Meadows Dr #1 Fort Myers, FL | 3.0 | 2.5 | 1722 | $1,950 | $1.13 | 23d | 1 | 1.21mi |
| 1637 S Mayfair Rd Fort Myers, FL | 3.0 | 2.0 | 1638 | $2,475 | $1.51 | 14d | 1 | 1.22mi |
| 1637 S Mayfair Rd Fort Myers, FL | 3.0 | 2.0 | 1638 | $2,475 | $1.51 | 19d | 1 | 1.22mi |
| 1174 Lake McGregor Dr Fort Myers, FL | 3.0 | 2.0 | 1300 | $2,000 | $1.54 | 23d | 1 | 1.25mi |
| 9901 Sunset Cove Ln #226 Fort Myers, FL | 3.0 | 2.0 | 1419 | $1,800 | $1.27 | 23d | 1 | 1.26mi |
| 4200 Steamboat Bnd #403 Fort Myers, FL | 3.0 | 2.0 | 1403 | $1,800 | $1.28 | 21d | 1 | 1.29mi |
| 4200 Steamboat Bnd #403 Fort Myers, FL | 3.0 | 2.0 | 1403 | $1,850 | $1.32 | 23d | 1 | 1.29mi |
| 12750 Equestrian Cir #3005 Fort Myers, FL | 3.0 | 2.0 | 1154 | $1,650 | $1.43 | 23d | 1 | 1.31mi |
| 13655 McGregor Village Dr #15 Fort Myers, FL | 3.0 | 2.5 | 1539 | $2,200 | $1.43 | 23d | 1 | 1.35mi |
| 13911 Lake Mahogany Blvd Fort Myers, FL | 3.0 | 2.0 | 1496 | $2,100 | $1.40 | 23d | 1 | 1.35mi |
| 1208 Westfield Dr Fort Myers, FL | 3.0 | 2.0 | 1600 | $2,900 | $1.81 | 23d | 1 | 1.40mi |
| 7861 Reflection Cove Dr Fort Myers, FL | 1.0–3.0 | 1.0–2.0 | 1012 | $2,080 | $2.05 | 1d | 30 | 1.41mi |
| 7850 Lake Sawgrass Loop #4111 Fort Myers, FL | 3.0 | 2.0 | 1285 | $2,300 | $1.79 | 23d | 1 | 1.47mi |
HOA detail condo
- Monthly dues
- $0 · $0/yr
- Assessments
- None detected in remarks — confirm with the listing agent.
Listing history 4 events
-
2026-06-03days on market $5,000 Active 6 DOM
-
2026-06-02days on market $5,000 Active 5 DOM
-
2026-06-01days on market $5,000 Active 4 DOM
-
2026-05-31days on market $5,000 Active 3 DOM
ⓘ Source: listings_history table (triggers on properties + properties_extension) + one-shot
backfill from property_details.listing_events for pre-trigger history.
Climate risk First Street
- Flood 9/10 Extreme FEMA zone AE · 99% chance over 30 yrs
- Wildfire 1/10 Low
- Heat 10/10 Extreme 7 d/yr ≥107°F today · 27 d/yr by 30 yrs out
- Wind 10/10 Extreme 99% chance of damaging wind over 30 yrs
- Air quality 2/10 Low 1 unhealthy d/yr today · 1 by 30 yrs out
Nearby sold comps map
Loading sold comps map…
Walkable amenities ~0.75 mi
Loading nearby amenities…
Taxation est. · year 1
- Rental income
- $26,516
- − Mortgage interest
- −$280
- − Property taxes
- −$75
- − Insurance
- −$5,144
- − Repairs & maintenance
- −$2,121
- − Management
- −$2,121
- − Depreciation
- −$145
- Taxable income
- $16,630
- Est. tax owed @ 24.0%
- −$3,991
- After-tax cash flow
- $11,424/yr
For passive investors: Depreciation is non-cash, so a rental often shows a tax loss while cash-flowing — sheltering income. Rental losses are passive: they offset passive income freely, and up to $25,000/yr can offset ordinary (W-2) income if you actively participate and your MAGI is under $100k (phasing out to $0 by $150k); unused losses carry forward. On sale, claimed depreciation is recaptured at up to 25%, and gains may owe capital-gains tax (a 1031 exchange can defer both). Figures are a year-1 estimate at your 24.0% rate — not tax advice; consult a CPA.
Schools (NCES district)
- District
- Lee
- NCES district ID
- 1201080
- Math proficiency
- 47% ▼ -11.00%
- Reading proficiency
- 50% ▼ -4.00%
- Median HH income
- $49,518
- Composite
- 41.49/100
- National rank
- #3458
- State rank
- #42 of 73 in FL
Livability — McGregor
- Score
- 71/100
- State rank
- #380
- US rank
- #6748
Category grades
Schools grade is shown separately in the Schools card above.
Census & demographics
- Census place
- McGregor, FL
- County
- Lee County · 788,662 people
- Metro
- Cape Coral-Fort Myers, FL
- Population (ZIP)
- 30,412
- Household income
- $80,451
- Rent vs Own
- Severe rent burden
- 762.0
Population outlook (Lee County) Hauer SSP2
- Today (2025)
- 871,946 people
- By 2030
- 955,468 · +9.6%
- By 2040
- 1,113,587 · +27.7%
- By 2050
- 1,256,891 · +44.1%
- By 2075
- 1,560,270 · +78.9%
- By 2100
- 1,726,848 · +98.0%
Race, ethnicity, and origin ACS 2023
- Neighborhood character
- Predominantly White (84%)
- Race & ethnicity
- White 84% Hispanic / Latino 8% Two or more races 7% Asian 3% Black 2%
- Hispanic origin (detail)
- Mexican 2% Puerto Rican 3%
- Common ancestry
- Romanian 3% Slovak 2% Scotch-Irish 2%
- Foreign-born
- 10% · Canada, China, Jamaica
- Languages at home
- 88% English-only · Spanish 5% German/W. Germanic 2% Russian/Polish/Slavic 1%
Political lean MEDSL · Lee
- 2024 margin
- Strong R (+28.4) · D 35.5% · R 63.9%
- 2008→2024 swing
- -18.0pp toward R · 2008: -10.4pp · 2024: -28.4pp
- All cycles
- 2024: R+28.4 2020: R+19.2 2016: R+20.4 2012: R+16.6 2008: R+10.4
Not yet ingested
- Civics
- —
Market trends
- HPI YoY
- ▼ -220.59%
- Current HPI
- 237.5227
- Rent YoY
- ▼ -7.85%
- Metro
- Cape Coral-Fort Myers, FL
- State GDP YoY
- ▲ 3.28%
- F500 in state
- 36
Industry mix (Fortune 500 HQ in FL)
| Industry | F500 HQs | Revenue |
|---|---|---|
| Industrial Technology | 2 | $29B |
|
||
| Insurance | 2 | $17B |
|
||
| Retail | 1 | $60B |
|
||
| Technology Distribution | 1 | $58B |
|
||
| Homebuilding | 1 | $35B |
|
||
| Technology Manufacturing | 1 | $35B |
|
||
Price history
-77.9% since first listed3 events — show timeline
- 2026-05-28 Listed $5,000 NFMLS
- 1981-08-01 Sold (Public Records) $48,900 Public Records
- 1980-01-01 Sold (Public Records) $22,600 Public Records
Property tax history
+1.3%/yrLatest (2025): $608 · +8.5% YoY. Source: county tax records.
Cash-flow waterfall
monthlySold comps — $/sqft
last 12 mo · ≤1 miLoading sold comps…