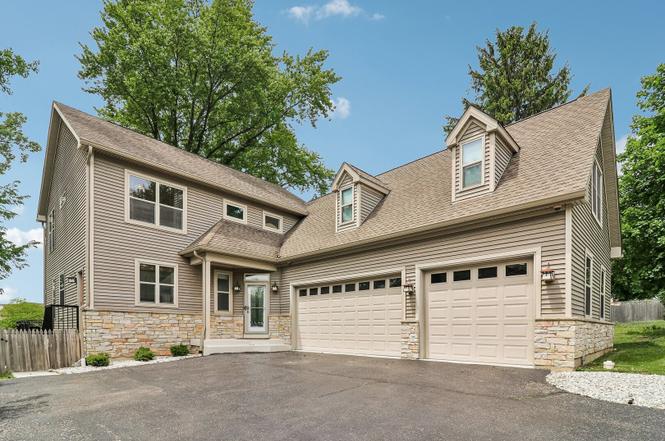
200 Sunset Ct · Lake Zurich, IL
Flood risk 1/10 · Minimal
- FEMA flood zone
- X (unshaded)
- Chance of flooding over 30 yrs
- 0.0%
- Est. flood insurance / yr
- $473 – $860
Fire risk 2/10 · Minimal
- Est. fire insurance / yr
- $804 – $1,492
Heat risk 2/10 · Minimal
- Hot days now (above 100°F)
- 7 days/yr
- Hot days in 30 yrs
- 14 days/yr
Wind risk 2/10 · Minimal
- Chance of severe wind over 30 yrs
- —
Air-quality risk 3/10 · Minor
- Unhealthy air days now
- 3 days/yr
- Unhealthy air days in 30 yrs
- 3 days/yr
Risk factors via First Street. Map © Google.
Why this score? — see what drove the F grade
The composite is a weighted blend of 9 inputs, each scored 0–100. Each bar is that input's sub-score; the figure is the points it added to the 100-point composite (weight × sub-score).
- Cash flow +7.6/30.0
- Schools +4.6/10.0
- Livability +3.8/5.0
- ARV discount +3.1/15.0
- 1% rule +2.8/10.0
- Rent growth +2.5/5.0
- Condition / age +2.5/5.0
- DSCR +1.7/10.0
- Appreciation +0.0/10.0
$719,900
🖨 Deal sheet 📄 Offer letter ✓ Due diligence
Listing remarks MLS
This is the one you have been waiting for. Located in the attendance boundary for the new May Whitney elementary school. This high quality custom home built in 2005 has generous living spaces in all the right places. Main level has 9ft ceilings and a wide open floor plan; open den, living room with corner fireplace. Huge kitchen with custom hickory cabinets and a 6 x 4 ft island with granite top. Open dining area and laundry fill out the main level. The second level has a 4th bedroom (currently used as exercise room) with a private full bath with heated whirlpool, walk-in closet, projector and powered movie screen and hookups for wet bar. Updated master bath features a heated floor, double sinks and awesome shower. Finished has the 5th bedroom, full bath and Rec Room (Media room) with projector and 85 inch TV. 3 car heated garage and above ground heated pool. Sitting a a quiet cul-de-sac lot and I think we checked all the boxes.
Key facts
- Quartz countertops
- Bench seating
- Remodeled kitchen
Tags
Property features AI
Finance
- Other: School bus service available
- Financial info: Homeowner tax exemption reported
- HOA & community: No required master association fee; Community features include a park, street lights and paved streets
Exterior
- Parking: Attached garage (garage owned) with 3 garage spaces; Asphalt driveway; Garage door opener
- Security: CO detectors
- Utilities: Public water; Public sewer; 200+ amp electric service
- Home design: Detached single-family home; 2-story design; Fee simple ownership; Rehab completed in 2025; Approx. total finished area updated from assessor records
- Construction: Built approximately 21–25 years ago; Vinyl siding with stone accents; Asphalt roof; Concrete perimeter foundation
- Exterior features: Above-ground pool; Deck; Exterior lighting; Fenced backyard with wood fencing; Located on a cul-de-sac
Interior
- Kitchen: Kitchen with island, breakfast bar/eating area and pantry-closet; Range; Microwave; Dishwasher; Refrigerator
- Bedrooms: 4 bedrooms (plus possible 5th bedroom in the basement); Basement bedroom (13 x 14) with vinyl flooring; Second-floor bedrooms with hardwood flooring (including master bedroom 14 x 22)
- Flooring: Hardwood flooring in main living areas and bedrooms; Engineered hardwood in basement family room; Tile flooring in foyer, bar/entertainment area and laundry; Vinyl flooring in some basement rooms
- Bathrooms: 4 full bathrooms; 1 half bathroom; Double sink vanities; Basement bathroom(s) present
- Heating & cooling: Natural gas forced-air heating; Central air conditioning
- Interior features: Open floorplan; Walk-in closet(s); Finished full basement; Combined dining and living room; Gas log fireplace with gas starter in living room; Ceiling fan(s); CO detectors; Sump pump; Humidifier
- Laundry & utility: Main-level laundry with gas dryer hookup, laundry closet and utility sink; Washer; Dryer; Water heater (gas)
Neighborhood map
What this means for you Summary
Snapshot
- This is a 4-bed/4.5-bath single-family listed at $720k.
Deal economics
- At list price, monthly cash flow is $-854 ($-10k/yr) — negative.
- To cash-flow at today's rent, offer at most $569k (21.0% below list).
- To meet the 1% rule (rent ≥ 1% of price), the offer needs to be $559k (22.3% below list).
- Recommended offer: $559k (22.3% below list) — sets the bar for 1% rule.
Location & tenants
- Location reads 76/100 on livability (#175 in IL, #3,345 nationally) — a middle-class / working-renter tenant base. Strengths: crime A+, employment A+, housing A+; Watch: health & safety C-, amenities F, commute F.
- Lake Zurich CUSD 95 (suburban): math 47% / reading 47% proficiency, ranked #44 of 620 in IL (top 7%) — families likely to look elsewhere, expect single-tenant / working-renter base with shorter leases; only 10% free/reduced lunch — higher-income household profile.
- Zoned schools: May Whitney Elem School (math 45% / reading 37%, grade F, #372 of 2,056 statewide, top 18%, 657 students, 0% FRL); Lake Zurich Middle - N Campus (math 42% / reading 45%, grade D, #101 of 665 statewide, top 16%, 704 students, 0% FRL); Lake Zurich High School (math 54% / reading 58%, grade C, #25 of 693 statewide, top 4%, 1,804 students, 0% FRL).
- Market conditions: 164 active listings in the ZIP; 4 comparable units currently listed for rent nearby; rentals lingering (median 44d on market — plan ~5-8 weeks vacancy on turnover, expect pricing pressure); 75% of comp listings sitting > 30 days — soft ceiling on asking rent; high-income renter base; 948 units permitted in Lake County in 2024 (424 in 5+ unit buildings).
- This rent runs 38% of the median local income ($176k/yr) — at the standard rent-burdened threshold; future hikes will face affordability resistance.
Forward outlook
- Local home prices are declining (-3.0%/yr); year-one equity from $5k of loan paydown is wiped out by about $22k of value loss. Plan a longer hold.
- Lake County population projected to shrink 8% by 2050 — rents likely to lag national; underwrite the cash flow, not the appreciation.
Negotiation context
- Only 1 days on market — expect competitive offers; lowballing is unlikely to land.
- 7 sale attempts since 18y ago with the ask held roughly flat each time — persistent listings suggest the price (not the market) is what's stuck; bring a comps-based counter.
- Current owner paid $530k; 36% above their basis — modest negotiation headroom, anchor on the comps not their cost.
Questions for the listing agent
- What do current leases actually rent for vs. the listed asking? Can we see a recent rent roll and the last 12 months of T-12 income?
- Is there a deadline driving the sale (1031 exchange, divorce, estate, relocation)? That informs how much negotiation room exists.
- Schools are B-rated — typically a magnet for longer-tenancy family renters. What's the average tenant stay here, and is there a school-zone premium baked into asking?
- The area grade is low — what's the realistic commute time and amenity access for the typical tenant pool here? Any planned neighborhood developments (good or bad) we should know about?
- What's the average days-on-market for RENTAL listings here right now (not sales)? A rising rental-DOM trend means longer vacancies and softer asking-rent achievability than the comps imply.
- What's the recent tenant-quality profile in this submarket — average credit score on applications, eviction rate, late-payment / NSF rate, and stable-employment percentage? A property-management company in the area should have these aggregated.
- How much new for-sale + rental construction is in the pipeline within 1–3 miles? Heavy new supply typically softens prices + rents 12–24 months out; constrained supply supports both.
Investment metrics
- 1% rule
- 0.78% ✗
- Cap rate
- 4.87%
- Cash-on-cash
- -5.09%
- DSCR
- 0.77
- GRM
- 10.7
CMA / ARV
- ARV (on-the-fly)
- $655,730
- Comps found
- 12
Show comp detail 12 sales within ~0.75 mi
| Address | Dist | Beds/Ba | Sqft | Sold | Price | $/sf | Match |
|---|---|---|---|---|---|---|---|
| 874 Savoy Ct | 0.09mi | 3/2.5 (-1) | 2,589 (-9%) | 0mo | $579,000 | $224 | 67 |
| 77 Mionske Dr | 0.19mi | 5/3.0 (+1) | 2,640 (-7%) | 3mo | $248,009 | $94 | 65 |
| 315 Seaton Ct | 0.08mi | 3/2.5 (-1) | 2,598 (-9%) | 11mo | $600,000 | $231 | 60 |
| 514 N Prairie Ln | 0.26mi | 5/3.0 (+1) | 2,834 (-1%) | 23mo | $652,500 | $230 | 57 |
| 865 Savoy Ct | 0.07mi | 3/3.5 (-1) | 2,598 (-9%) | 20mo | $565,000 | $217 | 56 |
| 2085 Yearling (lot 12) Ct | 0.58mi | 4/4.5 | 2,625 (-8%) | 5mo | $1,564,555 | $596 | 56 |
| 163 Forest Ave | 0.62mi | 4/3.5 | 2,847 (-0%) | 14mo | $500,000 | $176 | 56 |
| 302 Seaton Ct | 0.06mi | 3/3.5 (-1) | 2,430 (-15%) | 14mo | $575,000 | $237 | 52 |
| 477 Grand Ave | 0.50mi | 4/3.0 | 2,958 (+4%) | 19mo | $525,000 | $177 | 49 |
| 480 Grand Ave | 0.48mi | 5/3.5 (+1) | 2,990 (+5%) | 15mo | $2,399,900 | $803 | 48 |
| 443 Pheasant Ridge Rd | 0.64mi | 4/2.5 | 2,430 (-15%) | 13mo | $600,000 | $247 | 27 |
| 733 Edelweiss Dr | 0.59mi | 4/2.5 | 2,430 (-15%) | 18mo | $517,000 | $213 | 24 |
Match score weights: distance 35% · size 25% · config 20% · recency 20%. Top-matched comps best support the ARV.
Projected returns pro-forma
-3.0% appreciation · 3.0% rent growth · sell at horizon
- IRR
- -24.9%
- Equity multiple
- 0.15×
- Total profit
- $-170,801
- Equity at exit
- $107,339
- IRR
- -20.6%
- Equity multiple
- -0.08×
- Total profit
- $-217,712
- Equity at exit
- $62,244
Cash invested: $201,572 (down + closing). Projections, not guarantees.
Landlord ↔ Tenant lean methodology
- Overall (STATE)
- 43 Moderately Tenant-Leaning
- State Illinois
- 43 Moderately Tenant-Leaning · D+7
- County
- — inherits STATE
- City
- — inherits STATE
ZIP-level market 60047
- Active inventory
- 164
- Price-to-rent
- 10.7×
Monthly cashflow live
- Estimated rent
- $5,592 medium interval (Pro) →
- Mortgage (P&I)
- −$3,775
- Tax from tax record
- −$1,196 /mo · $14,357/yr
- Insurance
- −$300
- HOA
- −$0
- Vacancy / Maint / Mgmt
- −$1,174
- Net cashflow
- $-854
Break-even live
UW: 25.0% down · 7.5% · 30yr · 1.5% tax · 5.0% vac · 8.0% maint · 8.0% mgmt
Financing live
Cash to close
- Down payment
- $179,975
- Closing costs
- $21,597
- Reserves months
- —
- Total cash needed
- —
Loan-product check · same deal, 3 products live
Conventional
25% down · 7.5% · 30yr
- Down + closing
- —
- Monthly P&I
- —
- Monthly cashflow
- —
- DSCR
- —
- Eligible?
- —
Personal DTI + credit; lowest rate.
DSCR
20% down · 8.5% · 30yr
- Down + closing
- —
- Monthly P&I
- —
- Monthly cashflow
- —
- DSCR
- —
- Eligible?
- —
No personal income docs; deal must DSCR.
Hard money
10% down · 12.0% · 12mo
- Down + closing
- —
- Monthly P&I
- —
- Monthly cashflow
- —
- DSCR
- —
- Eligible?
- —
Short-term bridge; refi at stabilization.
Rent comps 4 comps
| Address | Beds | Baths | Sqft | Rent | $/sqft | DOM | Units | Dist |
|---|---|---|---|---|---|---|---|---|
| 121 Rosehall Dr Lake Zurich, IL | 3.0 | 3.0 | 2000 | $3,600 | $1.80 | 43d | 1 | 0.25mi |
| 154 Oak St Lake Zurich, IL | 4.0 | 3.5 | 3597 | $8,400 | $2.34 | 43d | 1 | 0.50mi |
| 148 Oak St Lake Zurich, IL | 4.0 | 3.5 | 3597 | $8,400 | $2.34 | 43d | 1 | 0.51mi |
| 975 Old Mill Grove Rd Lake Zurich, IL | 4.0 | 2.5 | 3300 | $5,900 | $1.79 | 3d | 1 | 1.13mi |
Listing history 2 events
-
2026-06-17remarks 699-char remark
-
2026-06-17$719,900 Active 1 DOM
ⓘ Source: listings_history table (triggers on properties + properties_extension) + one-shot
backfill from property_details.listing_events for pre-trigger history.
Tax reassessment forecast IL · Partial reset (capped growth)
- Current annual tax
- $14,357 · $1,196/mo
- Projected year-2 tax
- $15,350 · $1,279/mo
- Expected delta
- +$992/yr (+$83/mo · 6.9%)
ⓘ Screening estimate from a state-policy table — verify with the county assessor before closing.
Climate risk First Street
- Flood 1/10 Low FEMA zone X (unshaded) · 0% chance over 30 yrs
- Wildfire 2/10 Low
- Heat 2/10 Low 7 d/yr ≥100°F today · 14 d/yr by 30 yrs out
- Wind 2/10 Low
- Air quality 3/10 Moderate 3 unhealthy d/yr today · 3 by 30 yrs out
Nearby sold comps map
Loading sold comps map…
Walkable amenities ~0.75 mi
Loading nearby amenities…
Taxation est. · year 1
- Rental income
- $67,098
- − Mortgage interest
- −$40,326
- − Property taxes
- −$14,357
- − Insurance
- −$3,600
- − Repairs & maintenance
- −$5,368
- − Management
- −$5,368
- − Depreciation
- −$20,943
- Taxable loss
- −$22,862
- Est. tax savings @ 24.0%
- +$5,487
- After-tax cash flow
- $-4,765/yr
For passive investors: Depreciation is non-cash, so a rental often shows a tax loss while cash-flowing — sheltering income. Rental losses are passive: they offset passive income freely, and up to $25,000/yr can offset ordinary (W-2) income if you actively participate and your MAGI is under $100k (phasing out to $0 by $150k); unused losses carry forward. On sale, claimed depreciation is recaptured at up to 25%, and gains may owe capital-gains tax (a 1031 exchange can defer both). Figures are a year-1 estimate at your 24.0% rate — not tax advice; consult a CPA.
Schools (NCES district)
- District
- Lake Zurich CUSD 95
- NCES district ID
- 1721900
- Math proficiency
- 47% ▼ -5.00%
- Reading proficiency
- 47% ▼ -7.00%
- Median HH income
- $114,452
- Composite
- 46.47/100
- National rank
- #2437
- State rank
- #44 of 620 in IL
Livability — Lake Zurich
- Score
- 76/100
- State rank
- #175
- US rank
- #3345
Category grades
Schools grade is shown separately in the Schools card above.
Census & demographics
- Census place
- Lake Zurich, IL
- County
- Lake County · 591,991 people
- Metro
- Chicago-Naperville-Elgin, IL-IN-WI
- Population (ZIP)
- 44,240
- Household income
- $176,081
- Rent vs Own
- Severe rent burden
- 377.0
Population outlook (Lake County) Hauer SSP2
- Today (2025)
- 700,217 people
- By 2030
- 693,290 · -1.0%
- By 2040
- 673,588 · -3.8%
- By 2050
- 643,556 · -8.1%
- By 2075
- 562,792 · -19.6%
- By 2100
- 457,715 · -34.6%
Race, ethnicity, and origin ACS 2023
- Neighborhood character
- Predominantly White (78%)
- Race & ethnicity
- White 78% Asian 12% Two or more races 6% Hispanic / Latino 6%
- Hispanic origin (detail)
- Mexican 3%
- Common ancestry
- Romanian 11% Scotch-Irish 3% Portuguese 2%
- Foreign-born
- 18% · Canada, China, South Korea
- Languages at home
- 76% English-only · Russian/Polish/Slavic 8% Spanish 5% Other Indo-European 4%
Political lean MEDSL · Lake
- 2024 margin
- Strong D (+20.8) · D 59.7% · R 38.9% · Other 1.4%
- 2008→2024 swing
- +1.1pp toward D · 2008: 19.6pp · 2024: 20.8pp
- All cycles
- 2024: D+20.8 2020: D+24.1 2016: D+20.3 2012: D+8.1 2008: D+19.6
Not yet ingested
- Civics
- —
Market trends
- HPI YoY
- ▼ -228.82%
- Current HPI
- 204.4326
- Rent YoY
- —
- Metro
- Chicago-Naperville-Elgin, IL-IN-WI
- State GDP YoY
- ▲ 1.59%
- F500 in state
- 60
Industry mix (Fortune 500 HQ in IL)
| Industry | F500 HQs | Revenue |
|---|---|---|
| Insurance | 4 | $201B |
|
||
| Consumer Goods | 4 | $87B |
|
||
| Industrial Machinery | 3 | $64B |
|
||
| Healthcare | 2 | $55B |
|
||
| Retail / Pharmacy | 1 | $148B |
|
||
| Agriculture / Food | 1 | $86B |
|
||
Price history
+657.8% since first listed24 events — show timeline
- 2026-06-17 Listed $719,900 MRED as Distributed by MLS Grid
- 2021-12-16 Sold (Public Records) $530,000 Public Records
- 2021-11-22 Sold (MLS) $530,000 MRED as Distributed by MLS Grid
- 2021-10-24 Pending — MRED as Distributed by MLS Grid
- 2021-10-18 Relisted — MRED as Distributed by MLS Grid
- 2021-10-16 Pending — MRED as Distributed by MLS Grid
- 2021-10-15 Price Changed $548,000 MRED as Distributed by MLS Grid
- 2021-09-30 Price Changed $560,000 MRED as Distributed by MLS Grid
- 2021-09-20 Listed $575,000 MRED as Distributed by MLS Grid
- 2013-05-30 Sold (Public Records) $420,000 Public Records
- 2013-05-15 Sold (MLS) $420,000 MRED as Distributed by MLS Grid
- 2013-03-19 Contingent — MRED as Distributed by MLS Grid
- 2013-03-03 Price Changed $429,900 MRED as Distributed by MLS Grid
- 2013-02-22 Listed $439,900 MRED as Distributed by MLS Grid
- 2013-02-22 Listing Removed — MRED as Distributed by MLS Grid
- 2013-02-18 Relisted — MRED as Distributed by MLS Grid
- 2013-02-15 Contingent — MRED as Distributed by MLS Grid
- 2013-02-08 Listed — MRED as Distributed by MLS Grid
- 2009-04-09 Sold (Public Records) $441,000 Public Records
- 2009-03-18 Listing Removed — MRED as Distributed by MLS Grid
- 2009-03-18 Sold (MLS) $441,000 MRED as Distributed by MLS Grid
- 2009-01-27 Contingent — MRED as Distributed by MLS Grid
- 2008-11-23 Listed $459,800 MRED as Distributed by MLS Grid
- 2004-11-08 Sold (Public Records) $95,000 Public Records
Property tax history
+2.4%/yrLatest (2024): $14,357 · +7.4% YoY. Source: county tax records.
Cash-flow waterfall
monthlySold comps — $/sqft
last 12 mo · ≤1 miLoading sold comps…