8403 NE ST Johns Rd · Hazel Dell, WA
Flood risk No data
- FEMA flood zone
- —
- Chance of flooding over 30 yrs
- —
- Est. flood insurance / yr
- —
Fire risk No data
- Est. fire insurance / yr
- —
Heat risk No data
- Hot days now (above threshold)
- —
- Hot days in 30 yrs
- —
Wind risk No data
- Chance of severe wind over 30 yrs
- —
Air-quality risk No data
- Unhealthy air days now
- —
- Unhealthy air days in 30 yrs
- —
Risk factors via First Street. Map © Google.
Why this score? — see what drove the B grade
The composite is a weighted blend of 9 inputs, each scored 0–100. Each bar is that input's sub-score; the figure is the points it added to the 100-point composite (weight × sub-score).
- Cash flow +30.0/30.0
- 1% rule +10.0/10.0
- DSCR +10.0/10.0
- ARV discount +7.5/15.0
- Schools +5.0/10.0
- Livability +4.1/5.0
- Rent growth +3.0/5.0
- Condition / age +2.5/5.0
- Appreciation +0.0/10.0
$75,000
🖨 Deal sheet (PDF) 📄 Offer letter ✓ Due diligence
Listing remarks MLS
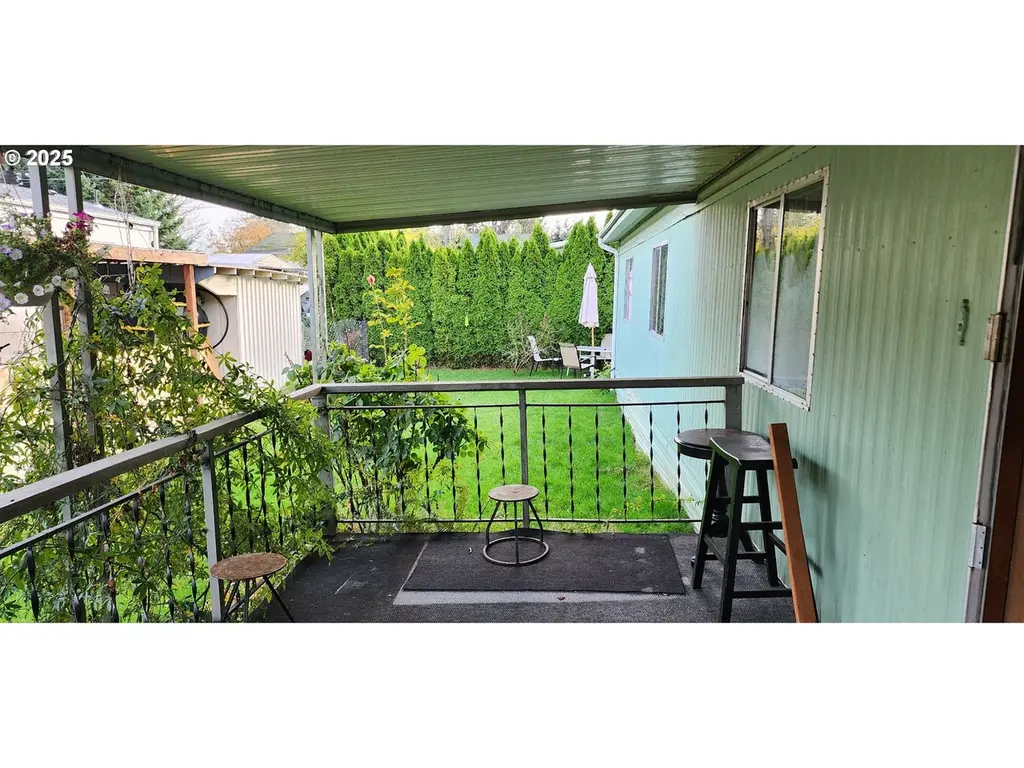
Double wide manufactured home in a mobile home park. No age restrictions! 1296 sf, 3 bedrooms, 2 full baths. Indoor laundry, primary bedroom with bath. Large lot, covered patio, car port and a storage shed. This is unit #6
Key facts
- Car port
- Covered patio
- Storage shed
Tags
Neighborhood map
What this means for you Summary
Snapshot
- This is a 2-bed/1.0-bath land listed at $75k.
Deal economics
- At list price, monthly cash flow is $896 ($11k/yr) — positive.
- The deal already cash-flows at list — no discount required.
- Meets the 1% rule at list price ($2k rent vs $75k).
- Recommended offer: $66k (12.0% below list) — sets the bar for market timing.
- Cap rate 20.6% vs local median 3.3% in Hazel Dell — top-decile yield for the area; either an underpriced asset or a hidden risk that comps aren't pricing in. Stress-test before assuming the spread holds.
Location & tenants
- Location reads 82/100 on livability (#67 in WA, #1,216 nationally) — a professional / high-income tenant draw. Strengths: amenities A+, commute A+, housing A+; Watch: crime D+, cost of living D.
- Battle Ground School District (suburban): math 48% / reading 60% proficiency, ranked #92 of 291 in WA (top 32%) — acceptable for families but not a draw, mixed tenant base, ~2y average lease.
- Zoned schools: Pleasant Valley Primary (556 students, 42% FRL); Pleasant Valley Middle (396 students, 45% FRL); Prairie High School (1,603 students, 41% FRL).
- Market conditions: Rents rising (+2.0%/yr); 188 active listings in the ZIP; 16 comparable units currently listed for rent nearby; rentals leasing fast (median 9d on market — plan ~1-2 weeks tenant-placement turnaround); solid renter incomes; 3,547 units permitted in Clark County in 2024 (1,361 in 5+ unit buildings).
Forward outlook
- Local home prices are declining (-3.0%/yr); year-one equity from $519 of loan paydown is wiped out by about $2k of value loss. Plan a longer hold.
- Clark County population projected at +29% by 2050 — long-run rental-demand tailwind backs the buy-and-hold thesis.
- At projected returns (-3.0% appreciation + 2.0% rent growth), your $21k cash investment doubles in ~3 years — after that, you're playing with house money.
Negotiation context
- It's been on market 219 days — a 12% lower offer ($66k) is reasonable based on typical stale-listing flexibility.
- 2 sale attempts; this cycle's ask has dropped $15k (17%) from the opening price — seller is motivated, your offer sets the floor, not the list.
Questions for the listing agent
- It's been on market 219 days. Have you received any prior offers? Is the seller open to a 12% concession, seller financing, or rate buy-down credit?
- Built in 1973 — when were the roof, HVAC, electrical panel, plumbing, and water heater last replaced?
- Why hasn't it sold? Are there any deal-killer items the seller is aware of (foundation, flood, title, zoning, code violations)?
- Is there a deadline driving the sale (1031 exchange, divorce, estate, relocation)? That informs how much negotiation room exists.
- Schools are F-rated, which usually means shorter tenancies and higher turnover. Who's the typical renter profile here, and what's been the actual vacancy rate?
- Crime grade is D in this area — have there been break-ins, vandalism, or insurance claims at this property in the last 3 years? What carrier currently insures it and at what premium?
- What's the average days-on-market for RENTAL listings here right now (not sales)? A rising rental-DOM trend means longer vacancies and softer asking-rent achievability than the comps imply.
- What's the recent tenant-quality profile in this submarket — average credit score on applications, eviction rate, late-payment / NSF rate, and stable-employment percentage? A property-management company in the area should have these aggregated.
- How much new for-sale + rental construction is in the pipeline within 1–3 miles? Heavy new supply typically softens prices + rents 12–24 months out; constrained supply supports both.
Investment metrics
- 1% rule
- 2.39% ✓
- Cap rate
- 20.63%
- Cash-on-cash
- 51.22%
- DSCR
- 3.28
- GRM
- 3.5
CMA / ARV
- ARV (median comp)
- $167,000
- List price
- $75,000
- Delta
- -55.09%
- Verdict
- UNDERPRICED
- Comps
- 11 within 2.0 mi
Projected returns pro-forma
-3.0% appreciation · 2.0% rent growth · sell at horizon
- IRR
- 47.9%
- Equity multiple
- 3.06×
- Total profit
- $43,178
- Equity at exit
- $11,183
- IRR
- 53.2%
- Equity multiple
- 5.95×
- Total profit
- $104,045
- Equity at exit
- $6,485
Cash invested: $21,000 (down + closing). Projections, not guarantees.
Landlord ↔ Tenant lean methodology
- Overall (STATE)
- 28 Tenant-Leaning
- State Washington
- 28 Tenant-Leaning · D+8
- County
- — inherits STATE
- City
- — inherits STATE
ZIP-level market 98665
- Rents YoY
- 2.0%
- Active inventory
- 188
- Price-to-rent
- 3.5×
Monthly cashflow live
- Estimated rent
- $1,791 high interval (Pro) →
- Mortgage (P&I)
- −$393
- Tax est. 1.5%
- −$94 /mo · $1,125/yr
- Insurance
- −$31
- HOA
- −$0
- Vacancy / Maint / Mgmt
- −$376
- Net cashflow
- $896
Break-even live
Sensitivity live
| Price | -10% $948 | -5% $922 | +0% $896 | +5% $870 | +10% $845 |
|---|---|---|---|---|---|
| Rent | -10% $755 | -5% $826 | +0% $896 | +5% $967 | +10% $1,038 |
| Rate | -1.0pp $934 | -0.5pp $915 | base $896 | +0.5pp $877 | +1.0pp $857 |
UW: 25.0% down · 7.5% · 30yr · 1.5% tax · 5.0% vac · 8.0% maint · 8.0% mgmt
Financing live
Cash to close
- Down payment
- $18,750
- Closing costs
- $2,250
- Reserves months
- —
- Total cash needed
- —
Loan-product check · same deal, 3 products live
Conventional
25% down · 7.5% · 30yr
- Down + closing
- —
- Monthly P&I
- —
- Monthly cashflow
- —
- DSCR
- —
- Eligible?
- —
Personal DTI + credit; lowest rate.
DSCR
20% down · 8.5% · 30yr
- Down + closing
- —
- Monthly P&I
- —
- Monthly cashflow
- —
- DSCR
- —
- Eligible?
- —
No personal income docs; deal must DSCR.
Hard money
10% down · 12.0% · 12mo
- Down + closing
- —
- Monthly P&I
- —
- Monthly cashflow
- —
- DSCR
- —
- Eligible?
- —
Short-term bridge; refi at stabilization.
Rent comps 16 comps
| Address | Beds | Baths | Sqft | Rent | $/sqft | DOM | Units | Dist |
|---|---|---|---|---|---|---|---|---|
| 8515 NE Saint Johns Rd Unit A09 Vancouver, WA | 1.0 | 1.0 | 801 | $1,495 | $1.87 | 25d | 1 | 0.13mi |
| 8515 NE Saint Johns Rd Unit B29 Vancouver, WA | 1.0 | 1.0 | 801 | $1,495 | $1.87 | 4d | 1 | 0.13mi |
| 8515 NE Saint Johns Rd Unit B22 Vancouver, WA | 1.0 | 1.0 | 801 | $1,495 | $1.87 | 45d | 1 | 0.13mi |
| 8007 NE 38th Ave Vancouver, WA | 3.0 | 2.5 | 1477 | $2,395 | $1.62 | 4d | 1 | 0.48mi |
| 7714 NE 39th Ct Vancouver, WA | 1.0–2.0 | 1.0–2.0 | 921 | $2,055 | $2.23 | 0d | 11 | 0.60mi |
| 5313 NE 68th St Vancouver, WA | 2.0–3.0 | 2.0 | 1108 | $1,625 | $1.47 | 18d | 2 | 0.84mi |
| 10601 NE 45th Ave Vancouver, WA | 3.0 | 2.0 | 1409 | $2,750 | $1.95 | 45d | 1 | 1.08mi |
| 7700 NE 72nd Ave Vancouver, WA | 1.0–2.0 | 1.0–2.0 | 978 | $3,190 | $3.26 | 0d | 7 | 1.11mi |
| 2703 NE 99th St Vancouver, WA | 1.0 | 1.0 | 800 | $1,700 | $2.12 | 6d | 1 | 1.15mi |
| 6313 NE 61st Ave Vancouver, WA | 3.0 | 2.5 | 1346 | $2,495 | $1.85 | 0d | 1 | 1.21mi |
| 2301 NE 81st St Vancouver, WA | 1.0–3.0 | 1.0–2.0 | 1080 | $1,975 | $1.83 | 3d | 10 | 1.24mi |
| 8601 NE 21st Ave Unit D Vancouver, WA | 3.0 | 2.5 | 1155 | $2,200 | $1.90 | 14d | 1 | 1.30mi |
| 8601 NE 21st Ave Unit D Vancouver, WA | 3.0 | 2.5 | 1155 | $2,200 | $1.90 | 16d | 1 | 1.30mi |
| 5917 NE 58th Ave Vancouver, WA | 3.0 | 2.5 | 1498 | $2,350 | $1.57 | 25d | 1 | 1.30mi |
| 5917 NE 58th St Vancouver, WA | 1.0–3.0 | 1.0–2.0 | 1162 | $1,762 | $1.52 | 9d | 3 | 1.48mi |
| 6909 NE 63rd St Vancouver, WA | 1.0–2.0 | 1.0–2.5 | 1035 | $2,300 | $2.22 | 5d | 2 | 1.49mi |
Listing history 20 events
-
2026-06-21days on market $75,000 Active 219 DOM
-
2026-06-18days on market $75,000 Active 216 DOM
-
2026-06-17days on market $75,000 Active 215 DOM
-
2026-06-16days on market $75,000 Active 214 DOM
-
2026-06-15days on market $75,000 Active 213 DOM
-
2026-06-13days on market $75,000 Active 211 DOM
-
2026-06-09days on market $75,000 Active 207 DOM
-
2026-06-08days on market $75,000 Active 206 DOM
-
2026-06-07days on market $75,000 Active 205 DOM
-
2026-06-03days on market $75,000 Active 201 DOM
-
2026-06-02pricedays on market $75,000 Active 200 DOM
-
2026-06-01days on market $78,000 Active 199 DOM
-
2026-05-31days on market $78,000 Active 198 DOM
-
2026-04-30price $78,000 222-char remark
Show marketing remark (222 chars)
Double wide manufactured home in a mobile home park. No age restrictions! 1296 sf, 3 bedrooms, 2 full baths. Indoor laundry, primary bedroom with bath. Large lot, covered patio, car port and a storage shed. This is unit #6
-
2026-03-22status Active 222-char remark
Show marketing remark (222 chars)
Double wide manufactured home in a mobile home park. No age restrictions! 1296 sf, 3 bedrooms, 2 full baths. Indoor laundry, primary bedroom with bath. Large lot, covered patio, car port and a storage shed. This is unit #6
-
2026-03-19status Pending 222-char remark
Show marketing remark (222 chars)
Double wide manufactured home in a mobile home park. No age restrictions! 1296 sf, 3 bedrooms, 2 full baths. Indoor laundry, primary bedroom with bath. Large lot, covered patio, car port and a storage shed. This is unit #6
-
2025-11-11$90,000 Active 222-char remark
Show marketing remark (222 chars)
Double wide manufactured home in a mobile home park. No age restrictions! 1296 sf, 3 bedrooms, 2 full baths. Indoor laundry, primary bedroom with bath. Large lot, covered patio, car port and a storage shed. This is unit #6
-
2009-09-08soldstatus $4,518,683
-
1980-10-31soldstatus $800,000
-
1978-01-01soldstatus $544,000
ⓘ Source: listings_history table (triggers on properties + properties_extension) + one-shot
backfill from property_details.listing_events for pre-trigger history.
Nearby sold comps map
Loading sold comps map…
Walkable amenities ~0.75 mi
Loading nearby amenities…
Taxation est. · year 1
- Rental income
- $21,488
- − Mortgage interest
- −$4,201
- − Property taxes
- −$1,125
- − Insurance
- −$375
- − Repairs & maintenance
- −$1,719
- − Management
- −$1,719
- − Depreciation
- −$2,182
- Taxable income
- $10,167
- Est. tax owed @ 24.0%
- −$2,440
- After-tax cash flow
- $8,316/yr
For passive investors: Depreciation is non-cash, so a rental often shows a tax loss while cash-flowing — sheltering income. Rental losses are passive: they offset passive income freely, and up to $25,000/yr can offset ordinary (W-2) income if you actively participate and your MAGI is under $100k (phasing out to $0 by $150k); unused losses carry forward. On sale, claimed depreciation is recaptured at up to 25%, and gains may owe capital-gains tax (a 1031 exchange can defer both). Figures are a year-1 estimate at your 24.0% rate — not tax advice; consult a CPA.
Schools (NCES district)
- District
- Battle Ground School District
- NCES district ID
- 5300380
- Math proficiency
- 48% ▼ -1.00%
- Reading proficiency
- 60% ▼ -1.00%
- Median HH income
- $69,646
- Composite
- 49.81/100
- National rank
- #4201
- State rank
- #92 of 291 in WA
Livability — Hazel Dell
- Score
- 82/100
- State rank
- #67
- US rank
- #1216
Category grades
Schools grade is shown separately in the Schools card above.
Census & demographics
- County
- Clark County · 513,189 people
- City population
- 28,243
- Metro
- Portland-Vancouver-Hillsboro, OR-WA
- Population (ZIP)
- 28,910
- Household income
- $88,559
- Rent vs Own
- Severe rent burden
- 1070.0
Population outlook (Clark County) Hauer SSP2
- Today (2025)
- 529,610 people
- By 2030
- 563,242 · +6.4%
- By 2040
- 625,905 · +18.2%
- By 2050
- 681,558 · +28.7%
- By 2075
- 805,967 · +52.2%
- By 2100
- 877,450 · +65.7%
Race, ethnicity, and origin ACS 2023
- Neighborhood character
- Predominantly White (70%)
- Race & ethnicity
- White 70% Hispanic / Latino 14% Two or more races 11% Asian 5% Black 3%
- Hispanic origin (detail)
- Mexican 12%
- Common ancestry
- Portuguese 5% Italian 4% Slovak 3%
- Foreign-born
- 12% · Canada, China
- Languages at home
- 80% English-only · Spanish 9% Russian/Polish/Slavic 3% Other Asian/Pacific 2%
Political lean MEDSL · Clark
- 2024 margin
- Lean D (+7.0) · D 52.1% · R 45.1% · Other 2.8%
- 2008→2024 swing
- +0.9pp no change · 2008: 6.1pp · 2024: 7.0pp
- All cycles
- 2024: D+7.0 2020: D+5.1 2016: D+0.1 2012: D+0.1 2008: D+6.1
Not yet ingested
- Civics
- —
Market trends
- HPI YoY
- ▼ -274.20%
- Current HPI
- 303.1342
- Rent YoY
- ▲ 2.00%
- Metro
- Portland-Vancouver-Hillsboro, OR-WA
- State GDP YoY
- ▲ 4.65%
- F500 in state
- 22
Industry mix (Fortune 500 HQ in WA)
| Industry | F500 HQs | Revenue |
|---|---|---|
| Retail | 2 | $269B |
|
||
| Technology / Retail | 1 | $638B |
|
||
| Technology | 1 | $245B |
|
||
| Telecommunications | 1 | $38B |
|
||
| Food / Beverage | 1 | $36B |
|
||
| Automotive / Trucks | 1 | $34B |
|
||
Price history
-85.7% since first listed7 events — show timeline
- 2026-04-30 Price Changed $78,000 RMLS
- 2026-03-22 Relisted — RMLS
- 2026-03-19 Pending — RMLS
- 2025-11-11 Listed $90,000 RMLS
- 2009-09-08 Sold (Public Records) $4,518,683 Public Records
- 1980-10-31 Sold (Public Records) $800,000 Public Records
- 1978-01-01 Sold (Public Records) $544,000 Public Records
Property tax history
+26.5%/yrLatest (2026): $39,674 · -12.0% YoY. Source: county tax records.
Cash-flow waterfall
monthlySold comps — $/sqft
last 12 mo · ≤1 miLoading sold comps…