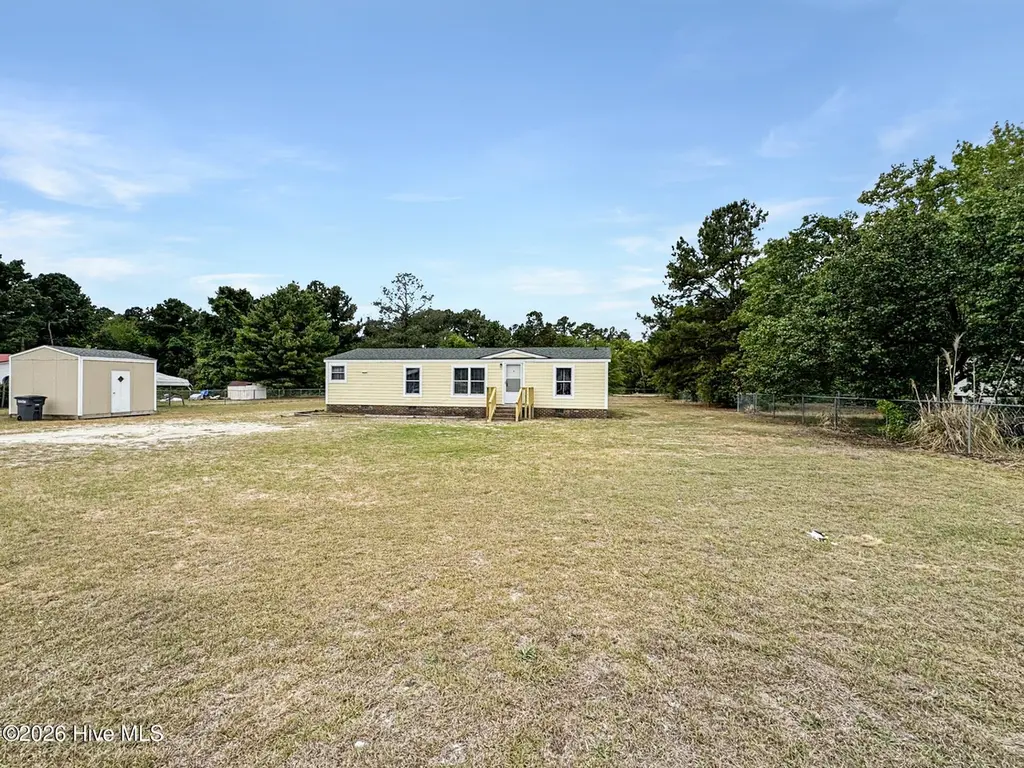
156 Countryside Dr · Pinebluff, NC
Flood risk 1/10 · Minimal
- FEMA flood zone
- X (unshaded)
- Chance of flooding over 30 yrs
- 0.0%
- Est. flood insurance / yr
- $507 – $1,088
Fire risk 7/10 · Major
- Est. fire insurance / yr
- $906 – $1,684
Heat risk 8/10 · Major
- Hot days now (above 107°F)
- 7 days/yr
- Hot days in 30 yrs
- 17 days/yr
Wind risk 6/10 · Moderate
- Chance of severe wind over 30 yrs
- 67.0%
Air-quality risk 1/10 · Minimal
- Unhealthy air days now
- 0 days/yr
- Unhealthy air days in 30 yrs
- 0 days/yr
Risk factors via First Street. Map © Google.
Why this score? — see what drove the B grade
The composite is a weighted blend of 9 inputs, each scored 0–100. Each bar is that input's sub-score; the figure is the points it added to the 100-point composite (weight × sub-score).
- Cash flow +27.1/30.0
- ARV discount +15.0/15.0
- DSCR +9.4/10.0
- 1% rule +7.3/10.0
- Schools +4.4/10.0
- Livability +3.4/5.0
- Condition / age +2.5/5.0
- Rent growth +1.7/5.0
- Appreciation +0.0/10.0
$145,000
🖨 Deal sheet 📄 Offer letter ✓ Due diligence
Listing remarks MLS
First time home buyers and investors: Don't miss the opportunity to see this turn-key home nestled on a large, pristine, fenced in yard in Aberdeen. This 3 bed/ 2 bath home has updated flooring throughout (NO carpet), hardie plank exterior, new water heater and roof, and fresh paint. Schedule a showing and see the possibilities for yourself.
Key facts
- Cement board siding
- Storage shed
- Community water
Tags
Neighborhood map
What this means for you Summary
Snapshot
- This is a 3-bed/2.0-bath single-family listed at $145k.
Deal economics
- At list price, monthly cash flow is $412 ($5k/yr) — positive.
- The deal already cash-flows at list — no discount required.
- Meets the 1% rule at list price ($2k rent vs $145k).
- Recommended offer: $141k (3.0% below list) — sets the bar for market timing.
Location & tenants
- Location reads 67/100 on livability (#219 in NC) — a middle-class / working-renter tenant base. Strengths: crime A+, cost of living A+, housing A+; Watch: amenities F, commute F, health & safety F.
- Moore County Schools (rural): math 48% / reading 54% proficiency, ranked #58 of 178 in NC (top 33%) — acceptable for families but not a draw, mixed tenant base, ~2y average lease.
- Zoned schools: Aberdeen Elementary (math 24% / reading 34%, grade F, #1,007 of 1,410 statewide, top 72%, 629 students, 73% FRL); Southern Middle (math 30% / reading 41%, grade F, #279 of 475 statewide, top 60%, 576 students, 53% FRL); Pinecrest High (math 66% / reading 72%, grade B, #131 of 535 statewide, top 25%, 2,221 students, 34% FRL).
- Market conditions: Rents falling (-3.1%/yr); 331 active listings in the ZIP; solid renter incomes; 941 units permitted in Moore County in 2024 (0 in 5+ unit buildings).
Forward outlook
- Local home prices are declining (-3.0%/yr); year-one equity from $1k of loan paydown is wiped out by about $4k of value loss. Plan a longer hold.
- Moore County population projected at +29% by 2050 — long-run rental-demand tailwind backs the buy-and-hold thesis.
Negotiation context
- It's been on market 48 days — a 3% lower offer ($141k) is reasonable based on typical stale-listing flexibility.
- 2 sale attempts since 6y ago with the ask held roughly flat each time — persistent listings suggest the price (not the market) is what's stuck; bring a comps-based counter.
- Current owner paid $53k; list at $145k implies a 173% gain — meaningful room to come down on a strong offer.
Risks & watch-outs
- Climate carrying-cost: major wind risk, 67% chance of damaging wind over 30y; major wildfire risk; extreme-heat days projected 7→17/yr by 2055 (HVAC capex compounding) — expect insurance premiums to compound above CPI over the hold.
Questions for the listing agent
- It's been on market 48 days. Have you received any prior offers? Is the seller open to a 3% concession, seller financing, or rate buy-down credit?
- Is there a deadline driving the sale (1031 exchange, divorce, estate, relocation)? That informs how much negotiation room exists.
- Schools are D-rated, which usually means shorter tenancies and higher turnover. Who's the typical renter profile here, and what's been the actual vacancy rate?
- What's the average days-on-market for RENTAL listings here right now (not sales)? A rising rental-DOM trend means longer vacancies and softer asking-rent achievability than the comps imply.
- What's the recent tenant-quality profile in this submarket — average credit score on applications, eviction rate, late-payment / NSF rate, and stable-employment percentage? A property-management company in the area should have these aggregated.
- How much new for-sale + rental construction is in the pipeline within 1–3 miles? Heavy new supply typically softens prices + rents 12–24 months out; constrained supply supports both.
Investment metrics
- 1% rule
- 1.23% ✓
- Cap rate
- 9.70%
- Cash-on-cash
- 12.18%
- DSCR
- 1.54
- GRM
- 6.8
CMA / ARV
- ARV (on-the-fly)
- $254,150
- Comps found
- 1
Show comp detail 1 sale within ~0.75 mi
| Address | Dist | Beds/Ba | Sqft | Sold | Price | $/sf | Match |
|---|---|---|---|---|---|---|---|
| 740 Pinebluff Lake Rd | 0.23mi | 3/1.5 | 1,019 (-11%) | 20mo | $225,000 | $221 | 52 |
Match score weights: distance 35% · size 25% · config 20% · recency 20%. Top-matched comps best support the ARV.
Projected returns pro-forma
-3.0% appreciation · 0.0% rent growth · sell at horizon
- IRR
- -1.7%
- Equity multiple
- 0.94×
- Total profit
- $-2,479
- Equity at exit
- $21,620
- IRR
- 4.5%
- Equity multiple
- 1.28×
- Total profit
- $11,463
- Equity at exit
- $12,537
Cash invested: $40,600 (down + closing). Projections, not guarantees.
Landlord ↔ Tenant lean methodology
- Overall (STATE)
- 85 Strongly Landlord-Friendly
- State North Carolina
- 85 Strongly Landlord-Friendly · R+3
- County
- — inherits STATE
- City
- — inherits STATE
ZIP-level market 28315
- Home prices YoY
- -31.4%
- Rents YoY
- -3.1%
- Active inventory
- 331
- Price-to-rent
- 6.8×
Monthly cashflow live
- Estimated rent
- $1,790 medium interval (Pro) →
- Mortgage (P&I)
- −$760
- Tax est. 1.5%
- −$181 /mo · $2,175/yr
- Insurance
- −$60
- HOA
- −$0
- Vacancy / Maint / Mgmt
- −$376
- Net cashflow
- $412
Break-even live
UW: 25.0% down · 7.5% · 30yr · 1.5% tax · 5.0% vac · 8.0% maint · 8.0% mgmt
Financing live
Cash to close
- Down payment
- $36,250
- Closing costs
- $4,350
- Reserves months
- —
- Total cash needed
- —
Loan-product check · same deal, 3 products live
Conventional
25% down · 7.5% · 30yr
- Down + closing
- —
- Monthly P&I
- —
- Monthly cashflow
- —
- DSCR
- —
- Eligible?
- —
Personal DTI + credit; lowest rate.
DSCR
20% down · 8.5% · 30yr
- Down + closing
- —
- Monthly P&I
- —
- Monthly cashflow
- —
- DSCR
- —
- Eligible?
- —
No personal income docs; deal must DSCR.
Hard money
10% down · 12.0% · 12mo
- Down + closing
- —
- Monthly P&I
- —
- Monthly cashflow
- —
- DSCR
- —
- Eligible?
- —
Short-term bridge; refi at stabilization.
Listing history 22 events
-
2026-06-19days on market $145,000 Active 48 DOM
-
2026-06-18days on market $145,000 Active 47 DOM
-
2026-06-17days on market $145,000 Active 46 DOM
-
2026-06-16days on market $145,000 Active 45 DOM
-
2026-06-15days on market $145,000 Active 44 DOM
-
2026-06-14days on market $145,000 Active 42 DOM
-
2026-06-13days on market $145,000 Active 41 DOM
-
2026-06-10days on market $145,000 Active 39 DOM
-
2026-06-09days on market $145,000 Active 38 DOM
-
2026-06-09price $145,000 Active 37 DOM
-
2026-06-08days on market $149,000 Active 37 DOM
-
2026-06-07days on market $149,000 Active 36 DOM
-
2026-06-05days on market $149,000 Active 33 DOM
-
2026-06-02days on market $149,000 Active 31 DOM
-
2026-06-01days on market $149,000 Active 30 DOM
-
2026-05-31days on market $149,000 Active 29 DOM
-
2026-05-30days on market $149,000 Active 28 DOM
-
2026-05-22price $149,000
-
2026-05-02$150,000 Active
-
2020-03-26soldstatus $53,150 343-char remark
Show marketing remark (343 chars)
First time home buyers and investors: Don't miss the opportunity to see this turn-key home nestled on a large, pristine, fenced in yard in Aberdeen. This 3 bed/ 2 bath home has updated flooring throughout (NO carpet), hardie plank exterior, new water heater and roof, and fresh paint. Schedule a showing and see the possibilities for yourself.
-
2020-03-26soldstatus $53,500
Show marketing remark (343 chars)
First time home buyers and investors: Don't miss the opportunity to see this turn-key home nestled on a large, pristine, fenced in yard in Aberdeen. This 3 bed/ 2 bath home has updated flooring throughout (NO carpet), hardie plank exterior, new water heater and roof, and fresh paint. Schedule a showing and see the possibilities for yourself.
-
2020-01-10$64,500 343-char remark
Show marketing remark (343 chars)
First time home buyers and investors: Don't miss the opportunity to see this turn-key home nestled on a large, pristine, fenced in yard in Aberdeen. This 3 bed/ 2 bath home has updated flooring throughout (NO carpet), hardie plank exterior, new water heater and roof, and fresh paint. Schedule a showing and see the possibilities for yourself.
ⓘ Source: listings_history table (triggers on properties + properties_extension) + one-shot
backfill from property_details.listing_events for pre-trigger history.
Climate risk First Street
- Flood 1/10 Low FEMA zone X (unshaded) · 0% chance over 30 yrs
- Wildfire 7/10 Severe
- Heat 8/10 Severe 7 d/yr ≥107°F today · 17 d/yr by 30 yrs out
- Wind 6/10 Major 67% chance of damaging wind over 30 yrs
- Air quality 1/10 Low 0 unhealthy d/yr today · 0 by 30 yrs out
Nearby sold comps map
Loading sold comps map…
Walkable amenities ~0.75 mi
Loading nearby amenities…
Taxation est. · year 1
- Rental income
- $21,478
- − Mortgage interest
- −$8,122
- − Property taxes
- −$2,175
- − Insurance
- −$725
- − Repairs & maintenance
- −$1,718
- − Management
- −$1,718
- − Depreciation
- −$4,218
- Taxable income
- $2,801
- Est. tax owed @ 24.0%
- −$672
- After-tax cash flow
- $4,271/yr
For passive investors: Depreciation is non-cash, so a rental often shows a tax loss while cash-flowing — sheltering income. Rental losses are passive: they offset passive income freely, and up to $25,000/yr can offset ordinary (W-2) income if you actively participate and your MAGI is under $100k (phasing out to $0 by $150k); unused losses carry forward. On sale, claimed depreciation is recaptured at up to 25%, and gains may owe capital-gains tax (a 1031 exchange can defer both). Figures are a year-1 estimate at your 24.0% rate — not tax advice; consult a CPA.
Schools (NCES district)
- District
- Moore County Schools
- NCES district ID
- 3703090
- Math proficiency
- 48% ▲ 5.00%
- Reading proficiency
- 54% ▲ 5.00%
- Median HH income
- $50,333
- Composite
- 43.63/100
- National rank
- #2967
- State rank
- #58 of 178 in NC
Livability — Pinebluff
- Score
- 67/100
- State rank
- #219
- US rank
- #10425
Category grades
Schools grade is shown separately in the Schools card above.
Census & demographics
- County
- Moore County · 75,247 people
- Metro
- Pinehurst-Southern Pines, NC
- Population (ZIP)
- 14,084
- Household income
- $77,418
- Rent vs Own
- Severe rent burden
- 132.0
Population outlook (Moore County) Hauer SSP2
- Today (2025)
- 106,902 people
- By 2030
- 113,134 · +5.8%
- By 2040
- 125,682 · +17.6%
- By 2050
- 137,811 · +28.9%
- By 2075
- 164,387 · +53.8%
- By 2100
- 175,595 · +64.3%
Race, ethnicity, and origin ACS 2023
- Neighborhood character
- Majority White (65%)
- Race & ethnicity
- White 65% Black 19% Two or more races 6% Hispanic / Latino 3% Asian 3% Native American 2%
- Common ancestry
- Slovak 4% Romanian 3% Iranian 3%
- Foreign-born
- 5% · Vietnam, Canada, Jamaica
- Languages at home
- 93% English-only · Spanish 4% Vietnamese 2% Tagalog/Filipino 1%
Political lean MEDSL · Moore
- 2024 margin
- Strong R (+29.5) · D 34.8% · R 64.3%
- 2008→2024 swing
- -8.1pp toward R · 2008: -21.4pp · 2024: -29.5pp
- All cycles
- 2024: R+29.5 2020: R+27.4 2016: R+29.6 2012: R+28.1 2008: R+21.4
Not yet ingested
- Civics
- —
Market trends
- HPI YoY
- ▼ -90.02%
- Current HPI
- 197.0027
- Rent YoY
- ▼ -3.10%
- Metro
- Pinehurst-Southern Pines, NC
- State GDP YoY
- ▲ 3.28%
- F500 in state
- 26
Industry mix (Fortune 500 HQ in NC)
| Industry | F500 HQs | Revenue |
|---|---|---|
| Financial Services | 2 | $213B |
|
||
| Retail | 2 | $95B |
|
||
| Industrial Conglomerate | 1 | $38B |
|
||
| Metals / Steel | 1 | $35B |
|
||
| Utilities | 1 | $30B |
|
||
| Industrial Machinery | 1 | $19B |
|
||
Price history
+131.0% since first listed5 events — show timeline
- 2026-05-22 Price Changed $149,000 Hive MLS
- 2026-05-02 Listed $150,000 Hive MLS
- 2020-03-26 Sold (Public Records) $53,500 Public Records
- 2020-03-26 Sold (MLS) $53,150 Hive MLS
- 2020-01-10 Listed $64,500 Hive MLS
Property tax history
+2.1%/yrLatest (2024): $234 · -4.4% YoY. Source: county tax records.
Cash-flow waterfall
monthlySold comps — $/sqft
last 12 mo · ≤1 miLoading sold comps…