852 Salem Ln · Greenacres, FL
Flood risk 1/10 · Minimal
- FEMA flood zone
- X (unshaded)
- Chance of flooding over 30 yrs
- 0.0%
- Est. flood insurance / yr
- $507 – $1,088
Fire risk 1/10 · Minimal
- Est. fire insurance / yr
- $947 – $1,759
Heat risk 9/10 · Severe
- Hot days now (above 106°F)
- 7 days/yr
- Hot days in 30 yrs
- 25 days/yr
Wind risk 10/10 · Severe
- Chance of severe wind over 30 yrs
- 99.0%
Air-quality risk 2/10 · Minimal
- Unhealthy air days now
- 0 days/yr
- Unhealthy air days in 30 yrs
- 2 days/yr
Risk factors via First Street. Map © Google.
Why this score? — see what drove the C- grade
The composite is a weighted blend of 9 inputs, each scored 0–100. Each bar is that input's sub-score; the figure is the points it added to the 100-point composite (weight × sub-score).
- Cash flow +18.9/30.0
- 1% rule +9.9/10.0
- ARV discount +7.5/15.0
- DSCR +5.9/10.0
- Schools +4.3/10.0
- Livability +3.5/5.0
- Condition / age +2.5/5.0
- Rent growth +2.4/5.0
- Appreciation +0.0/10.0
$135,000
🖨 Deal sheet 📄 Offer letter ✓ Due diligence
Listing remarks
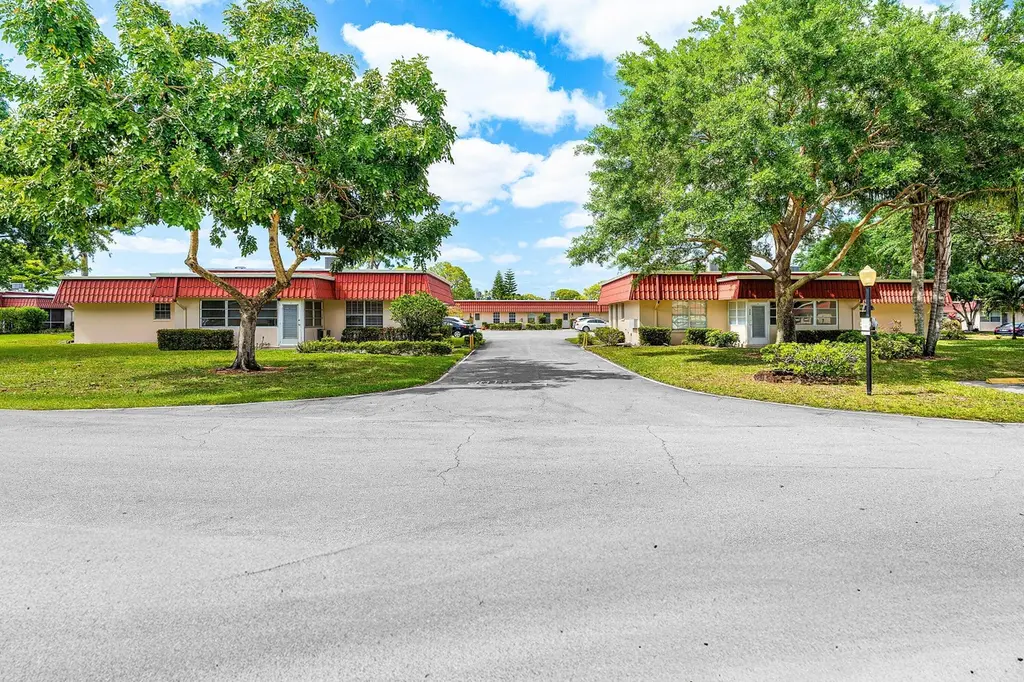
Covered Bridge is a active adult community with beautiful lakes and walking paths and bridges. Clubhouse offers activities & resort pool. This spacious condo, boasts 1024 sqft of living space, screened patio, full size washer and dryer, stainless steel appliances, ceiling fans, 2025 AC, 2026 exterior painting and NO popcorn ceilings! In addition to the spacious primary bedroom a "bedroom" sized flex room can be converted or used as an extra living room. Flex room has a closet and full window to outside. Add your personal touches and come enjoy this great community!
Key facts
- Resort pool
- Screened patio
- Clubhouse
Tags
Property features AI
Finance
- Other: Senior community; Pets allowed (pet restrictions possible)
- HOA & community: Has an association (Covered Bridge); Monthly association fee; Association amenities include clubhouse, pool, picnic area, and shuffleboard court; Association fee includes water, trash, cable TV, common areas, common real estate tax, and recreation facility
Exterior
- Parking: Assigned parking and guest parking (total 1 space)
- Utilities: Public water; Public sewer; Electricity available; Cable connected
- Home design: Condominium; One story; Resale property; Faces west
- Construction: Block/Concrete/CBS construction; Flat metal roof
- Exterior features: Paved road access; Not waterfront
Interior
- Kitchen: Electric range; Refrigerator
- Bedrooms: One main-level bedroom
- Flooring: Carpet; Tile
- Bathrooms: One full bathroom; One half bathroom
- Heating & cooling: Electric heating; Central air conditioning; Ceiling fan(s)
- Interior features: Electric range and refrigerator included; Unfurnished; Screened porch
- Laundry & utility: Laundry closet with washer hookup and electric dryer hookup located inside
Neighborhood map
What this means for you Summary
Snapshot
- This is a 1-bed/1.5-bath condo listed at $135k.
Deal economics
- At list price, monthly cash flow is $138 ($2k/yr) — positive.
- The deal already cash-flows at list — no discount required.
- Meets the 1% rule at list price ($2k rent vs $135k).
- Recommended offer: $127k (6.0% below list) — sets the bar for market timing.
Location & tenants
- Location reads 69/100 on livability (#490 in FL) — a middle-class / working-renter tenant base. Strengths: cost of living A+, housing A+, health & safety A; Watch: employment D, amenities F, commute F.
- Palm Beach (suburban): math 46% / reading 53% proficiency, ranked #34 of 73 in FL (top 47%) — families likely to look elsewhere, expect single-tenant / working-renter base with shorter leases.
- Zoned schools: Liberty Park Elementary School (math 25% / reading 38%, grade F, #1,841 of 2,144 statewide, top 86%, 845 students, 76% FRL); Okeeheelee Middle School (math 34% / reading 40%, grade F, #399 of 571 statewide, top 71%, 1,377 students, 68% FRL) — zoned schools average 72% FRL vs 52% district-wide (20 pts higher); higher-poverty schools than district average — tighter screening recommended.
- Zoned-school proficiency averages 34% at this address vs 50% district-wide (-15 pts) — the specific schools serving this property underperform the Palm Beach average; the district grade overstates school quality for this exact location.
- Market conditions: Rents soft (-0.4%/yr); 651 active listings in the ZIP; 40 comparable units currently listed for rent nearby; rentals at typical pace (median 22d on market — plan ~3-4 weeks tenant-placement turnaround); solid renter incomes; 3,974 units permitted in Palm Beach County in 2024 (1,012 in 5+ unit buildings).
Forward outlook
- Local home prices are declining (-3.0%/yr); year-one equity from $933 of loan paydown is wiped out by about $4k of value loss. Plan a longer hold.
- Palm Beach County population projected at +30% by 2050 — long-run rental-demand tailwind backs the buy-and-hold thesis.
Negotiation context
- It's been on market 62 days — a 6% lower offer ($127k) is reasonable based on typical stale-listing flexibility.
- 2 sale attempts since 9y ago with the ask held roughly flat each time — persistent listings suggest the price (not the market) is what's stuck; bring a comps-based counter.
Risks & watch-outs
- Watch-outs: HOA is 28% of rent.
- Climate carrying-cost: severe wind risk, 99% chance of damaging wind over 30y; extreme-heat days projected 7→25/yr by 2055 (HVAC capex compounding) — expect insurance premiums to compound above CPI over the hold.
Questions for the listing agent
- It's been on market 62 days. Have you received any prior offers? Is the seller open to a 6% concession, seller financing, or rate buy-down credit?
- What does the HOA fee cover, when was the last increase, and are there any pending special assessments or reserve-fund shortfalls?
- Any open or pending special assessments — roof, HVAC, plumbing, elevator, façade? What's the per-unit balance and payoff schedule, and is the seller paying it off at close or rolling it to the buyer?
- Why hasn't it sold? Are there any deal-killer items the seller is aware of (foundation, flood, title, zoning, code violations)?
- Is there a deadline driving the sale (1031 exchange, divorce, estate, relocation)? That informs how much negotiation room exists.
- Schools are D-rated, which usually means shorter tenancies and higher turnover. Who's the typical renter profile here, and what's been the actual vacancy rate?
- What's the average days-on-market for RENTAL listings here right now (not sales)? A rising rental-DOM trend means longer vacancies and softer asking-rent achievability than the comps imply.
- What's the recent tenant-quality profile in this submarket — average credit score on applications, eviction rate, late-payment / NSF rate, and stable-employment percentage? A property-management company in the area should have these aggregated.
- How much new apartment / multifamily construction is in the pipeline within 1–3 miles? Heavy new supply (>2% of stock underway) typically softens rents 12–24 months out; light construction supports rent growth.
Investment metrics
- 1% rule
- 1.49% ✓
- Cap rate
- 7.52%
- Cash-on-cash
- 4.37%
- DSCR
- 1.19
- GRM
- 5.6
CMA / ARV
No comps found within radius.
Projected returns pro-forma
-3.0% appreciation · 0.0% rent growth · sell at horizon
- IRR
- -14.4%
- Equity multiple
- 0.51×
- Total profit
- $-18,649
- Equity at exit
- $20,129
- IRR
- -15.5%
- Equity multiple
- 0.30×
- Total profit
- $-26,273
- Equity at exit
- $11,672
Cash invested: $37,800 (down + closing). Projections, not guarantees.
Landlord ↔ Tenant lean methodology
- Overall (STATE)
- 87 Strongly Landlord-Friendly
- State Florida
- 87 Strongly Landlord-Friendly · R+3
- County
- — inherits STATE
- City
- — inherits STATE
ZIP-level market 33467
- Rents YoY
- -0.4%
- Active inventory
- 651
- Price-to-rent
- 5.6×
Monthly cashflow live
- Estimated rent
- $2,006 high interval (Pro) →
- Mortgage (P&I)
- −$708
- Tax from tax record
- −$117 /mo · $1,404/yr
- Insurance
- −$56
- HOA
- −$566
- Vacancy / Maint / Mgmt
- −$421
- Net cashflow
- $138
Break-even live
UW: 25.0% down · 7.5% · 30yr · 1.5% tax · 5.0% vac · 8.0% maint · 8.0% mgmt
Financing live
Cash to close
- Down payment
- $33,750
- Closing costs
- $4,050
- Reserves months
- —
- Total cash needed
- —
Loan-product check · same deal, 3 products live
Conventional
25% down · 7.5% · 30yr
- Down + closing
- —
- Monthly P&I
- —
- Monthly cashflow
- —
- DSCR
- —
- Eligible?
- —
Personal DTI + credit; lowest rate.
DSCR
20% down · 8.5% · 30yr
- Down + closing
- —
- Monthly P&I
- —
- Monthly cashflow
- —
- DSCR
- —
- Eligible?
- —
No personal income docs; deal must DSCR.
Hard money
10% down · 12.0% · 12mo
- Down + closing
- —
- Monthly P&I
- —
- Monthly cashflow
- —
- DSCR
- —
- Eligible?
- —
Short-term bridge; refi at stabilization.
Rent comps 40 comps
| Address | Beds | Baths | Sqft | Rent | $/sqft | DOM | Units | Dist |
|---|---|---|---|---|---|---|---|---|
| 845 Salem Ln Lake Worth, FL | 2.0 | 2.0 | 1024 | $1,850 | $1.81 | 24d | 1 | 0.06mi |
| 192 Cape Cod Cir Lake Worth, FL | 1.0 | 1.5 | 902 | $1,850 | $2.05 | 24d | 1 | 0.31mi |
| 733 Nantucket Cir Lake Worth, FL | 2.0 | 2.0 | 941 | $2,500 | $2.66 | 24d | 1 | 0.35mi |
| 711 Laconia Cir Unit B Lake Worth, FL | 2.0 | 2.0 | 1088 | $2,300 | $2.11 | 24d | 1 | 0.35mi |
| 245 Down East Ln Unit B Lake Worth, FL | 2.0 | 2.0 | 941 | $1,900 | $2.02 | 24d | 1 | 0.37mi |
| 386 Bennington Ln Lake Worth, FL | 2.0 | 2.0 | 941 | $2,000 | $2.13 | 14d | 1 | 0.40mi |
| 7831 Willow Spring Dr #524 Lake Worth, FL | 2.0 | 2.0 | 1360 | $2,000 | $1.47 | 24d | 1 | 0.50mi |
| 3593 Birdie Dr #103 Lake Worth, FL | 1.0 | 1.5 | 824 | $1,600 | $1.94 | 24d | 1 | 0.50mi |
| 7844 Willow Spring Dr #1715 Lake Worth, FL | 2.0 | 2.0 | 1360 | $1,950 | $1.43 | 4d | 1 | 0.51mi |
| 7855 Willow Spring Dr #723 Lake Worth, FL | 2.0 | 2.0 | 1360 | $1,700 | $1.25 | 17d | 1 | 0.55mi |
| 7855 Willow Spring Dr #723 Lake Worth, FL | 2.0 | 2.0 | 1360 | $1,700 | $1.25 | 24d | 1 | 0.55mi |
| 3755 Via Poinciana #304 Lake Worth, FL | 2.0 | 2.0 | 1103 | $2,000 | $1.81 | 24d | 1 | 0.59mi |
| 3326 Arcara Way #108 Lake Worth, FL | 2.0 | 2.0 | 1222 | $1,825 | $1.49 | 16d | 1 | 0.59mi |
| 7879 Willow Spring Dr #923 Lake Worth, FL | 2.0 | 2.0 | 1360 | $1,800 | $1.32 | 24d | 1 | 0.60mi |
| 3661 Via Poinciana #616 Lake Worth, FL | 2.0 | 2.0 | 1103 | $2,000 | $1.81 | 22d | 1 | 0.63mi |
| 3661 Via Poinciana #616 Lake Worth, FL | 2.0 | 2.0 | 1103 | $2,000 | $1.81 | 13d | 1 | 0.63mi |
| 3286 Arcara Way #413 Lake Worth, FL | 2.0 | 2.0 | 1222 | $1,850 | $1.51 | 24d | 1 | 0.65mi |
| 3590 Via Poinciana #510 Lake Worth, FL | 1.0 | 1.5 | 849 | $1,600 | $1.88 | 24d | 1 | 0.72mi |
| 3810 Via Poinciana #404 Lake Worth, FL | 2.0 | 2.0 | 1114 | $1,900 | $1.71 | 7d | 1 | 0.73mi |
| 4373 Trevi Ct Lake Worth, FL | 2.0 | 1.5 | 1080 | $2,500 | $2.31 | 17d | 1 | 0.73mi |
| 3212 Strawflower Way Lake Worth, FL | 2.0 | 2.0 | 1017 | $2,000 | $1.97 | 17d | 2 | 0.77mi |
| 3212 Strawflower Way #207 Lake Worth, FL | 2.0 | 2.0 | 1017 | $1,850 | $1.82 | 24d | 1 | 0.77mi |
| 3212 Strawflower Way Greenacres, FL | 2.0 | 2.0 | 1017 | $2,200 | $2.16 | 10d | 1 | 0.77mi |
| 4070 Tivoli Ct #307 Lake Worth, FL | 2.0 | 2.0 | 939 | $1,750 | $1.86 | 20d | 1 | 0.77mi |
| 4070 Tivoli Ct #307 Lake Worth, FL | 2.0 | 2.0 | 939 | $1,675 | $1.78 | 5d | 1 | 0.77mi |
| 4363 Trevi Ct #203 Lake Worth, FL | 1.0 | 1.5 | 761 | $1,650 | $2.17 | 24d | 1 | 0.79mi |
| 4575 Lucerne Lakes Blvd W #104 Lake Worth, FL | 1.0 | 1.0 | 900 | $1,275 | $1.42 | 7d | 1 | 0.83mi |
| 4575 Lucerne Lakes Blvd W #104 Lake Worth, FL | 1.0 | 1.0 | 900 | $1,240 | $1.38 | 12d | 1 | 0.83mi |
| 4345 Trevi Ct #204 Lake Worth, FL | 2.0 | 2.0 | 1005 | $2,100 | $2.09 | 20d | 1 | 0.86mi |
| 3178 Via Poinciana #303 Lake Worth, FL | 2.0 | 2.0 | 1145 | $1,600 | $1.40 | 24d | 1 | 0.88mi |
| 7257 Golf Colony Ct #203 Lake Worth, FL | 2.0 | 2.0 | 790 | $1,950 | $2.47 | 7d | 1 | 0.88mi |
| 4640 Lucerne Lakes Blvd W Lake Worth, FL | 2.0 | 1.0–2.0 | 960 | $1,525 | $1.59 | 4d | 2 | 0.90mi |
| 7149 Golf Colony Ct #104 Lake Worth, FL | 2.0 | 2.0 | 790 | $2,300 | $2.91 | 24d | 1 | 0.90mi |
| 7149 Golf Colony Ct Lake Worth, FL | 2.0 | 2.0 | 823 | $2,098 | $2.55 | 12d | 2 | 0.91mi |
| 7149 Golf Colony Ct Lake Worth, FL | 2.0 | 2.0 | 823 | $2,075 | $2.52 | 2d | 3 | 0.91mi |
| 8300 Garden Catalina Cir Lake Worth, FL | 2.0 | 2.0 | 1097 | $2,595 | $2.37 | 24d | 1 | 0.91mi |
| 8300 Garden Catalina Cir Lake Worth, FL | 2.0 | 2.0 | 1269 | $2,965 | $2.34 | 16d | 1 | 0.91mi |
| 4120 Tivoli Ct #305 Lake Worth, FL | 1.0 | 1.0 | 704 | $1,750 | $2.49 | 24d | 1 | 0.92mi |
| 7101 Golf Colony Ct #102 Lake Worth, FL | 2.0 | 2.0 | 790 | $2,500 | $3.16 | 24d | 1 | 0.93mi |
| 7137 Golf Colony Ct #202 Lake Worth, FL | 2.0 | 2.0 | 735 | $1,995 | $2.71 | 14d | 1 | 0.94mi |
HOA detail condo
- Monthly dues
- $566 · $6,792/yr
- Likely covers
- pool
- Assessments
- None detected in remarks — confirm with the listing agent.
Listing history 16 events
-
2026-06-18days on market $135,000 Active 62 DOM
-
2026-06-17days on market $135,000 Active 61 DOM
-
2026-06-16days on market $135,000 Active 60 DOM
-
2026-06-15days on market $135,000 Active 59 DOM
-
2026-06-13days on market $135,000 Active 57 DOM
-
2026-06-09days on market $135,000 Active 53 DOM
-
2026-06-08days on market $135,000 Active 52 DOM
-
2026-06-07days on market $135,000 Active 51 DOM
-
2026-06-04days on market $135,000 Active 48 DOM
-
2026-06-03days on market $135,000 Active 47 DOM
-
2026-06-02days on market $135,000 Active 46 DOM
-
2026-06-01days on market $135,000 Active 45 DOM
-
2026-05-31days on market $135,000 Active 44 DOM
-
2026-04-17$135,000 Active
-
2017-11-17historical
-
2017-06-24$109,500 Active
ⓘ Source: listings_history table (triggers on properties + properties_extension) + one-shot
backfill from property_details.listing_events for pre-trigger history.
Tax reassessment forecast FL · Resets to sale price
- Current annual tax
- $1,404 · $117/mo
- Projected year-2 tax
- $1,404 · $117/mo
- Expected delta
- $0/yr ($0/mo · 0.0%)
ⓘ Screening estimate from a state-policy table — verify with the county assessor before closing.
Climate risk First Street
- Flood 1/10 Low FEMA zone X (unshaded) · 0% chance over 30 yrs
- Wildfire 1/10 Low
- Heat 9/10 Extreme 7 d/yr ≥106°F today · 25 d/yr by 30 yrs out
- Wind 10/10 Extreme 99% chance of damaging wind over 30 yrs
- Air quality 2/10 Low 0 unhealthy d/yr today · 2 by 30 yrs out
Nearby sold comps map
Loading sold comps map…
Walkable amenities ~0.75 mi
Loading nearby amenities…
Taxation est. · year 1
- Rental income
- $24,072
- − Mortgage interest
- −$7,562
- − Property taxes
- −$1,404
- − Insurance
- −$675
- − Repairs & maintenance
- −$1,926
- − Management
- −$1,926
- − HOA
- −$6,792
- − Depreciation
- −$3,927
- Taxable loss
- −$140
- Est. tax savings @ 24.0%
- +$34
- After-tax cash flow
- $1,684/yr
For passive investors: Depreciation is non-cash, so a rental often shows a tax loss while cash-flowing — sheltering income. Rental losses are passive: they offset passive income freely, and up to $25,000/yr can offset ordinary (W-2) income if you actively participate and your MAGI is under $100k (phasing out to $0 by $150k); unused losses carry forward. On sale, claimed depreciation is recaptured at up to 25%, and gains may owe capital-gains tax (a 1031 exchange can defer both). Figures are a year-1 estimate at your 24.0% rate — not tax advice; consult a CPA.
Schools (NCES district)
- District
- Palm Beach
- NCES district ID
- 1201500
- Math proficiency
- 46% ▼ -16.00%
- Reading proficiency
- 53% ▼ -4.00%
- Median HH income
- $53,943
- Composite
- 42.72/100
- National rank
- #3160
- State rank
- #34 of 73 in FL
Livability — Greenacres
- Score
- 69/100
- State rank
- #490
- US rank
- #9008
Category grades
Schools grade is shown separately in the Schools card above.
Census & demographics
- County
- Palm Beach County · 1,438,312 people
- City population
- 65,478
- Metro
- Miami-Fort Lauderdale-Pompano Beach, FL
- Population (ZIP)
- 58,411
- Household income
- $95,739
- Rent vs Own
- Severe rent burden
- 960.0
Population outlook (Palm Beach County) Hauer SSP2
- Today (2025)
- 1,637,487 people
- By 2030
- 1,743,255 · +6.5%
- By 2040
- 1,948,712 · +19.0%
- By 2050
- 2,132,979 · +30.3%
- By 2075
- 2,530,027 · +54.5%
- By 2100
- 2,706,979 · +65.3%
Race, ethnicity, and origin ACS 2023
- Neighborhood character
- Diverse neighborhood (Simpson 0.59)
- Race & ethnicity
- White 59% Hispanic / Latino 22% Two or more races 13% Black 10% Asian 4%
- Hispanic origin (detail)
- Mexican 2% Puerto Rican 4% Cuban 4% Dominican 2%
- Common ancestry
- Romanian 4% Scotch-Irish 3% Hispanic 3%
- Foreign-born
- 24% · Canada, Jamaica, Vietnam
- Languages at home
- 71% English-only · Spanish 17% French/Haitian/Cajun 5% Other Indo-European 3%
Political lean MEDSL · Palm Beach
- 2024 margin
- Toss-up / Even · D 50.0% · R 49.2%
- 2008→2024 swing
- -22.1pp toward R · 2008: 22.9pp · 2024: 0.8pp
- All cycles
- 2024: D+0.8 2020: D+12.8 2016: D+15.3 2012: D+17.0 2008: D+22.9
Not yet ingested
- Civics
- —
Market trends
- HPI YoY
- ▼ -288.94%
- Current HPI
- 343.7738
- Rent YoY
- ▼ -0.40%
- Metro
- Miami-Fort Lauderdale-Pompano Beach, FL
- State GDP YoY
- ▲ 3.28%
- F500 in state
- 36
Industry mix (Fortune 500 HQ in FL)
| Industry | F500 HQs | Revenue |
|---|---|---|
| Industrial Technology | 2 | $29B |
|
||
| Insurance | 2 | $17B |
|
||
| Retail | 1 | $60B |
|
||
| Technology Distribution | 1 | $58B |
|
||
| Homebuilding | 1 | $35B |
|
||
| Technology Manufacturing | 1 | $35B |
|
||
Price history
+23.3% since first listed3 events — show timeline
- 2026-04-17 Listed $135,000 Beaches MLS
- 2017-11-17 Listing Removed — Beaches MLS
- 2017-06-24 Listed $109,500 Beaches MLS
Property tax history
+5.6%/yrLatest (2025): $1,404 · +2.3% YoY. Source: county tax records.
Cash-flow waterfall
monthlySold comps — $/sqft
last 12 mo · ≤1 miLoading sold comps…