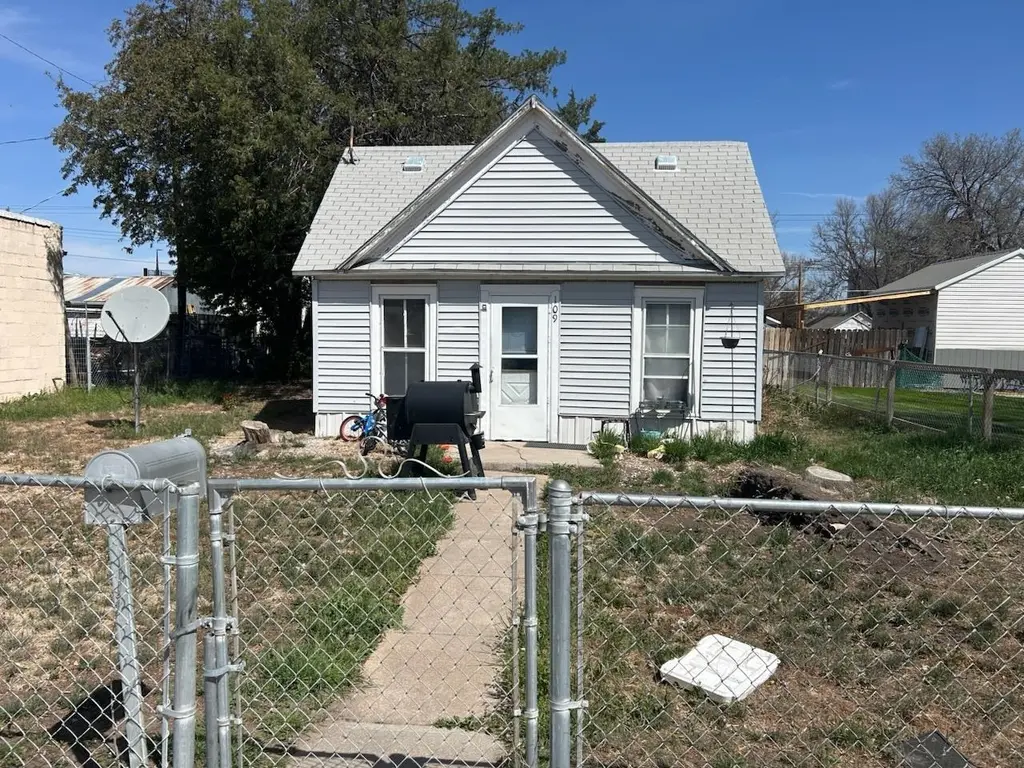
109 E 2nd St · Hershey, NE
Flood risk No data
- FEMA flood zone
- —
- Chance of flooding over 30 yrs
- —
- Est. flood insurance / yr
- —
Fire risk No data
- Est. fire insurance / yr
- —
Heat risk 3/10 · Minor
- Hot days now (above threshold)
- 7 days/yr
- Hot days in 30 yrs
- 18 days/yr
Wind risk No data
- Chance of severe wind over 30 yrs
- —
Air-quality risk 1/10 · Minimal
- Unhealthy air days now
- 0 days/yr
- Unhealthy air days in 30 yrs
- 0 days/yr
Risk factors via First Street. Map © Google.
Why this score? — see what drove the B- grade
The composite is a weighted blend of 9 inputs, each scored 0–100. Each bar is that input's sub-score; the figure is the points it added to the 100-point composite (weight × sub-score).
- Cash flow +29.5/30.0
- DSCR +10.0/10.0
- 1% rule +7.7/10.0
- ARV discount +5.9/15.0
- Schools +4.4/10.0
- Livability +3.6/5.0
- Rent growth +2.5/5.0
- Condition / age +2.5/5.0
- Appreciation +0.0/10.0
$65,000
🖨 Deal sheet 📄 Offer letter ✓ Due diligence
Listing remarks MLS
2 bed, 1 bath. Currently being rented. 24-hour notice for showings. Selling property as-is, where-is.
Key facts
- Garage
- Built 1890
- Listed 32 days
Neighborhood map
What this means for you Summary
Snapshot
- This is a 2-bed/1.0-bath single-family listed at $65k.
Deal economics
- At list price, monthly cash flow is $233 ($3k/yr) — positive.
- The deal already cash-flows at list — no discount required.
- Meets the 1% rule at list price ($827 rent vs $65k).
- Recommended offer: $63k (3.0% below list) — sets the bar for market timing.
Location & tenants
- Location reads 71/100 on livability (#190 in NE) — a middle-class / working-renter tenant base. Strengths: cost of living A+, housing A+, crime B; Watch: health & safety C-, amenities F, commute F.
- Hershey Public Schools (rural): math 48% / reading 51% proficiency, ranked #62 of 111 in NE (top 56%) — families likely to look elsewhere, expect single-tenant / working-renter base with shorter leases; only 16% free/reduced lunch — higher-income household profile.
- Market conditions: 6 active listings in the ZIP; 66 units permitted in Lincoln County in 2024 (0 in 5+ unit buildings).
Forward outlook
- Local home prices are declining (-3.0%/yr); year-one equity from $449 of loan paydown is wiped out by about $2k of value loss. Plan a longer hold.
- Lincoln County population projected at -11% by 2050 — secular population decline; favor cash flow + early exit over multi-decade hold.
- At projected returns (-3.0% appreciation + 3.0% rent growth), your $18k cash investment doubles in ~8 years — after that, you're playing with house money.
Negotiation context
- It's been on market 32 days — a 3% lower offer ($63k) is reasonable based on typical stale-listing flexibility.
- 2 sale attempts since 11y ago with the ask held roughly flat each time — persistent listings suggest the price (not the market) is what's stuck; bring a comps-based counter.
- Current owner paid $18k; list at $65k implies a 264% gain — meaningful room to come down on a strong offer.
Risks & watch-outs
- Watch-outs: built in 1890 — expect roof / HVAC / electrical / plumbing capex.
Questions for the listing agent
- It's been on market 32 days. Have you received any prior offers? Is the seller open to a 3% concession, seller financing, or rate buy-down credit?
- Built in 1890 — when were the roof, HVAC, electrical panel, plumbing, and water heater last replaced?
- Is there a deadline driving the sale (1031 exchange, divorce, estate, relocation)? That informs how much negotiation room exists.
- What's the average days-on-market for RENTAL listings here right now (not sales)? A rising rental-DOM trend means longer vacancies and softer asking-rent achievability than the comps imply.
- What's the recent tenant-quality profile in this submarket — average credit score on applications, eviction rate, late-payment / NSF rate, and stable-employment percentage? A property-management company in the area should have these aggregated.
- How much new for-sale + rental construction is in the pipeline within 1–3 miles? Heavy new supply typically softens prices + rents 12–24 months out; constrained supply supports both.
Investment metrics
- 1% rule
- 1.27% ✓
- Cap rate
- 10.59%
- Cash-on-cash
- 15.34%
- DSCR
- 1.68
- GRM
- 6.6
CMA / ARV
- ARV (median comp)
- $62,702
- List price
- $65,000
- Delta
- 3.66%
- Verdict
- FAIR
- Comps
- 5 within 1.0 mi
Projected returns pro-forma
-3.0% appreciation · 3.0% rent growth · sell at horizon
- IRR
- 6.0%
- Equity multiple
- 1.24×
- Total profit
- $4,280
- Equity at exit
- $9,692
- IRR
- 15.4%
- Equity multiple
- 2.25×
- Total profit
- $22,786
- Equity at exit
- $5,620
Cash invested: $18,200 (down + closing). Projections, not guarantees.
Landlord ↔ Tenant lean methodology
- Overall (STATE)
- 83 Strongly Landlord-Friendly
- State Nebraska
- 83 Strongly Landlord-Friendly · R+13
- County
- — inherits STATE
- City
- — inherits STATE
ZIP-level market 69143
- Home prices YoY
- -5.8%
- Active inventory
- 6
- Price-to-rent
- 6.6×
Monthly cashflow live
- Estimated rent
- $827 medium interval (Pro) →
- Mortgage (P&I)
- −$341
- Tax from tax record
- −$53 /mo · $630/yr
- Insurance
- −$27
- HOA
- −$0
- Vacancy / Maint / Mgmt
- −$174
- Net cashflow
- $233
Break-even live
UW: 25.0% down · 7.5% · 30yr · 1.5% tax · 5.0% vac · 8.0% maint · 8.0% mgmt
Financing live
Cash to close
- Down payment
- $16,250
- Closing costs
- $1,950
- Reserves months
- —
- Total cash needed
- —
Loan-product check · same deal, 3 products live
Conventional
25% down · 7.5% · 30yr
- Down + closing
- —
- Monthly P&I
- —
- Monthly cashflow
- —
- DSCR
- —
- Eligible?
- —
Personal DTI + credit; lowest rate.
DSCR
20% down · 8.5% · 30yr
- Down + closing
- —
- Monthly P&I
- —
- Monthly cashflow
- —
- DSCR
- —
- Eligible?
- —
No personal income docs; deal must DSCR.
Hard money
10% down · 12.0% · 12mo
- Down + closing
- —
- Monthly P&I
- —
- Monthly cashflow
- —
- DSCR
- —
- Eligible?
- —
Short-term bridge; refi at stabilization.
Listing history 5 events
-
2026-04-17$65,000 Active 101-char remark
Show marketing remark (101 chars)
2 bed, 1 bath. Currently being rented. 24-hour notice for showings. Selling property as-is, where-is.
-
2015-08-05soldstatus $17,875 66-char remark
Show marketing remark (66 chars)
Fixer Upper "Sold As Is", Detached Garage, Good Location
-
2015-08-05soldstatus $30,000
Show marketing remark (66 chars)
Fixer Upper "Sold As Is", Detached Garage, Good Location
-
2015-06-22$27,500 66-char remark
Show marketing remark (66 chars)
Fixer Upper "Sold As Is", Detached Garage, Good Location
-
2013-10-18soldstatus $65,295
ⓘ Source: listings_history table (triggers on properties + properties_extension) + one-shot
backfill from property_details.listing_events for pre-trigger history.
Tax reassessment forecast NE · Resets to sale price
- Current annual tax
- $630 · $53/mo
- Projected year-2 tax
- $1,124 · $94/mo
- Expected delta
- +$494/yr (+$41/mo · 78.5%)
ⓘ Screening estimate from a state-policy table — verify with the county assessor before closing.
Climate risk First Street
- Heat 3/10 Moderate
- Air quality 1/10 Low 0 unhealthy d/yr today · 0 by 30 yrs out
Nearby sold comps map
Loading sold comps map…
Walkable amenities ~0.75 mi
Loading nearby amenities…
Taxation est. · year 1
- Rental income
- $9,921
- − Mortgage interest
- −$3,641
- − Property taxes
- −$630
- − Insurance
- −$325
- − Repairs & maintenance
- −$794
- − Management
- −$794
- − Depreciation
- −$1,891
- Taxable income
- $1,846
- Est. tax owed @ 24.0%
- −$443
- After-tax cash flow
- $2,349/yr
For passive investors: Depreciation is non-cash, so a rental often shows a tax loss while cash-flowing — sheltering income. Rental losses are passive: they offset passive income freely, and up to $25,000/yr can offset ordinary (W-2) income if you actively participate and your MAGI is under $100k (phasing out to $0 by $150k); unused losses carry forward. On sale, claimed depreciation is recaptured at up to 25%, and gains may owe capital-gains tax (a 1031 exchange can defer both). Figures are a year-1 estimate at your 24.0% rate — not tax advice; consult a CPA.
Schools (NCES district)
- District
- Hershey Public Schools
- NCES district ID
- 3171820
- Math proficiency
- 48% ▼ -6.00%
- Reading proficiency
- 51% ▼ -1.00%
- Median HH income
- $62,363
- Composite
- 43.55/100
- National rank
- #2981
- State rank
- #62 of 111 in NE
Livability — Hershey
- Score
- 71/100
- State rank
- #190
- US rank
- #6730
Category grades
Schools grade is shown separately in the Schools card above.
Census & demographics
- Census place
- Hershey, NE
- Population (ZIP)
- 1,675
Population outlook (Lincoln County) Hauer SSP2
- Today (2025)
- 34,750 people
- By 2030
- 34,004 · -2.1%
- By 2040
- 32,310 · -7.0%
- By 2050
- 30,918 · -11.0%
- By 2075
- 29,245 · -15.8%
- By 2100
- 29,116 · -16.2%
Race, ethnicity, and origin ACS 2023
- Neighborhood character
- Predominantly White (92%)
- Race & ethnicity
- White 92% Two or more races 7% Hispanic / Latino 5%
- Common ancestry
- Romanian 6% Slovak 2% Italian 1%
- Foreign-born
- 0%
- Languages at home
- 98% English-only · Spanish 2%
Political lean MEDSL · Lincoln
- 2024 margin
- Solid R (+55.2) · D 21.8% · R 77.0% · Other 1.2%
- 2008→2024 swing
- -19.7pp toward R · 2008: -35.5pp · 2024: -55.2pp
- All cycles
- 2024: R+55.2 2020: R+54.6 2016: R+58.1 2012: R+40.6 2008: R+35.5
Not yet ingested
- Civics
- —
Market trends
- HPI YoY
- ▼ -13.71%
- Current HPI
- 221.4488
- Rent YoY
- —
- Metro
- —
- State GDP YoY
- ▲ 0.68%
- F500 in state
- 2
Industry mix (Fortune 500 HQ in NE)
| Industry | F500 HQs | Revenue |
|---|---|---|
| Conglomerate | 1 | $371B |
|
||
Price history
-0.5% since first listed5 events — show timeline
- 2026-04-17 Listed $65,000 LCBR
- 2015-08-05 Sold (Public Records) $30,000 Public Records
- 2015-08-05 Sold (MLS) $17,875 LCBR
- 2015-06-22 Listed $27,500 LCBR
- 2013-10-18 Sold (Public Records) $65,295 Public Records
Property tax history
+11.1%/yrLatest (2025): $630 · +35.5% YoY. Source: county tax records.
Cash-flow waterfall
monthlySold comps — $/sqft
last 12 mo · ≤1 miLoading sold comps…