 🏗️ New Construction
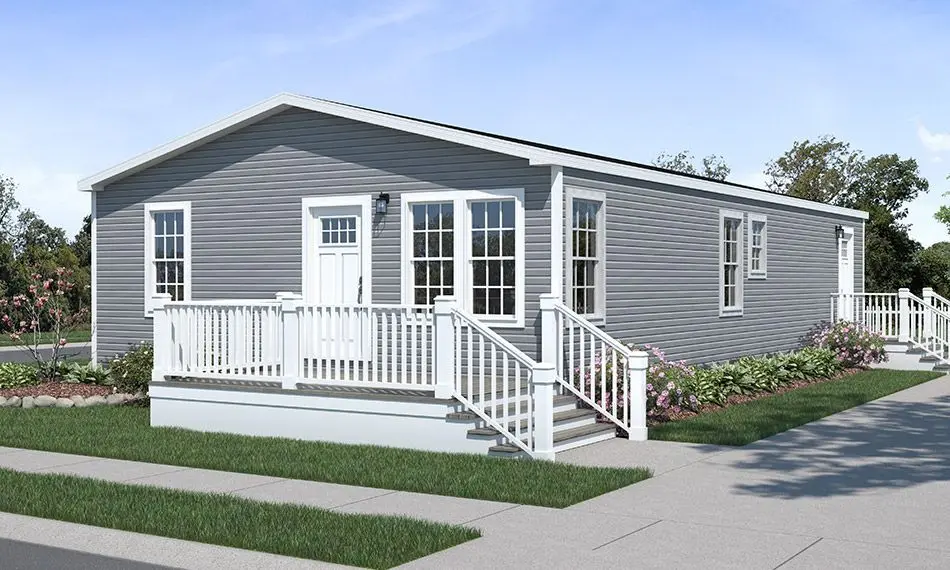
Carlyle Plan · St. John Fisher College, NY
Flood risk 1/10 · Minimal
- FEMA flood zone
- X (unshaded)
- Chance of flooding over 30 yrs
- 0.0%
- Est. flood insurance / yr
- $507 – $1,088
Fire risk 1/10 · Minimal
- Est. fire insurance / yr
- $691 – $1,283
Heat risk 2/10 · Minimal
- Hot days now (above 95°F)
- 7 days/yr
- Hot days in 30 yrs
- 15 days/yr
Wind risk 1/10 · Minimal
- Chance of severe wind over 30 yrs
- —
Air-quality risk 2/10 · Minimal
- Unhealthy air days now
- 1 days/yr
- Unhealthy air days in 30 yrs
- 2 days/yr
Risk factors via First Street. Map © Google.
Why this score? — see what drove the B- grade
The composite is a weighted blend of 9 inputs, each scored 0–100. Each bar is that input's sub-score; the figure is the points it added to the 100-point composite (weight × sub-score).
- Cash flow +30.0/30.0
- DSCR +10.0/10.0
- 1% rule +8.5/10.0
- ARV discount +7.5/15.0
- Schools +6.8/10.0
- Rent growth +2.5/5.0
- Livability +2.5/5.0
- Condition / age +1.0/5.0
- Appreciation +0.0/10.0
$125,900
🖨 Deal sheet 📄 Offer letter ✓ Due diligence
Key facts
- Listed 553 days
Neighborhood map
What this means for you Summary
Snapshot
- This is a 3-bed/2.0-bath manufactured listed at $126k. Condition is rated poor.
Deal economics
- At list price, monthly cash flow is $477 ($6k/yr) — positive.
- The deal already cash-flows at list — no discount required.
- Meets the 1% rule at list price ($2k rent vs $126k).
- Recommended offer: $111k (12.0% below list) — sets the bar for market timing.
- Cap rate 10.8% vs local median 16.6% in St. John Fisher College — below-typical yield; the buyer is paying a premium for something (appreciation thesis, condition, location) that the cap rate doesn't capture.
Location & tenants
- Location reads: area grade B — affects rentability + tenant quality, not the cash-flow math above.
- Penfield Central School District (suburban): math 77% / reading 79% proficiency, ranked #67 of 590 in NY (top 11%) — strong family-tenant draw, lease renewals of 3-5y typical; only 11% free/reduced lunch — higher-income household profile.
- Market conditions: 63 active listings in the ZIP; 11 comparable units currently listed for rent nearby; rentals leasing fast (median 3d on market — plan ~1-2 weeks tenant-placement turnaround); 1,169 units permitted in Monroe County in 2024 (591 in 5+ unit buildings).
Forward outlook
- Local home prices are declining (-3.0%/yr); year-one equity from $870 of loan paydown is wiped out by about $4k of value loss. Plan a longer hold.
- Monroe County population projected to shrink 6% by 2050 — rents likely to lag national; underwrite the cash flow, not the appreciation.
- At projected returns (-3.0% appreciation + 3.0% rent growth), your $35k cash investment doubles in ~8 years — after that, you're playing with house money.
Negotiation context
- It's been on market 553 days — a 12% lower offer ($111k) is reasonable based on typical stale-listing flexibility.
Questions for the listing agent
- It's been on market 553 days. Have you received any prior offers? Is the seller open to a 12% concession, seller financing, or rate buy-down credit?
- Have any recent inspections been done? Can we get a copy of the seller's disclosures and any deferred-maintenance estimates?
- Why hasn't it sold? Are there any deal-killer items the seller is aware of (foundation, flood, title, zoning, code violations)?
- Is there a deadline driving the sale (1031 exchange, divorce, estate, relocation)? That informs how much negotiation room exists.
- What's the average days-on-market for RENTAL listings here right now (not sales)? A rising rental-DOM trend means longer vacancies and softer asking-rent achievability than the comps imply.
- What's the recent tenant-quality profile in this submarket — average credit score on applications, eviction rate, late-payment / NSF rate, and stable-employment percentage? A property-management company in the area should have these aggregated.
- How much new for-sale + rental construction is in the pipeline within 1–3 miles? Heavy new supply typically softens prices + rents 12–24 months out; constrained supply supports both.
Investment metrics
- 1% rule
- 1.35% ✓
- Cap rate
- 10.84%
- Cash-on-cash
- 16.24%
- DSCR
- 1.72
- GRM
- 6.2
CMA / ARV
No comps found within radius.
Projected returns pro-forma
-3.0% appreciation · 3.0% rent growth · sell at horizon
- IRR
- 7.3%
- Equity multiple
- 1.28×
- Total profit
- $10,013
- Equity at exit
- $18,772
- IRR
- 16.6%
- Equity multiple
- 2.36×
- Total profit
- $47,954
- Equity at exit
- $10,886
Cash invested: $35,252 (down + closing). Projections, not guarantees.
Landlord ↔ Tenant lean methodology
- Overall (STATE)
- 15 Strongly Tenant-Friendly
- State New York
- 15 Strongly Tenant-Friendly · D+10
- County
- — inherits STATE
- City
- — inherits STATE
ZIP-level market 14625
- Home prices YoY
- -15.3%
- Active inventory
- 63
- Price-to-rent
- 6.2×
Monthly cashflow live
- Estimated rent
- $1,705 high interval (Pro) →
- Mortgage (P&I)
- −$660
- Tax est. 1.5%
- −$157 /mo · $1,888/yr
- Insurance
- −$52
- HOA
- −$0
- Vacancy / Maint / Mgmt
- −$358
- Net cashflow
- $477
Break-even live
UW: 25.0% down · 7.5% · 30yr · 1.5% tax · 5.0% vac · 8.0% maint · 8.0% mgmt
Financing live
Cash to close
- Down payment
- $31,475
- Closing costs
- $3,777
- Reserves months
- —
- Total cash needed
- —
Loan-product check · same deal, 3 products live
Conventional
25% down · 7.5% · 30yr
- Down + closing
- —
- Monthly P&I
- —
- Monthly cashflow
- —
- DSCR
- —
- Eligible?
- —
Personal DTI + credit; lowest rate.
DSCR
20% down · 8.5% · 30yr
- Down + closing
- —
- Monthly P&I
- —
- Monthly cashflow
- —
- DSCR
- —
- Eligible?
- —
No personal income docs; deal must DSCR.
Hard money
10% down · 12.0% · 12mo
- Down + closing
- —
- Monthly P&I
- —
- Monthly cashflow
- —
- DSCR
- —
- Eligible?
- —
Short-term bridge; refi at stabilization.
Rent comps 11 comps
| Address | Beds | Baths | Sqft | Rent | $/sqft | DOM | Units | Dist |
|---|---|---|---|---|---|---|---|---|
| 3540 East Ave Rochester, NY | 1.0–2.0 | 1.0–2.5 | 1261 | $4,123 | $3.27 | 2d | 10 | 0.50mi |
| 3765 East Ave Rochester, NY | 2.0 | 1.5 | 1826 | $2,900 | $1.59 | 2d | 1 | 0.72mi |
| 278 Penn Ln Rochester, NY | 2.0 | 2.0 | 1184 | $2,100 | $1.77 | 3d | 1 | 1.10mi |
| 18 Brook Hill Ln Rochester, NY | 1.0–2.0 | 1.0–1.5 | 841 | $1,915 | $2.28 | 2d | 1 | 1.14mi |
| 234 W Commercial St Unit 2 East Rochester, NY | 2.0 | 1.0 | 640 | $1,100 | $1.72 | 43d | 1 | 1.22mi |
| 214 Magnolia Ave East Rochester, NY | 3.0 | 1.0 | 1200 | $1,600 | $1.33 | 23d | 1 | 1.35mi |
| 709 Garfield St East Rochester, NY | 2.0 | 1.0 | 2915 | $1,300 | $0.45 | 2d | 1 | 1.35mi |
| 508 1/2 Garfield St East Rochester, NY | 3.0 | 1.0 | — | $1,700 | — | 2d | 1 | 1.35mi |
| 218 1/2 Magnolia Ave East Rochester, NY | 3.0 | 1.5 | 1200 | $1,400 | $1.17 | 43d | 1 | 1.36mi |
| 126 West Ave Unit UPPER East Rochester, NY | 2.0 | 1.0 | 820 | $1,500 | $1.83 | 19d | 1 | 1.41mi |
| 108 W Filbert St Unit 2 East Rochester, NY | 2.0 | 1.0 | 1100 | $1,525 | $1.39 | 2d | 1 | 1.49mi |
Listing history 14 events
-
2026-06-18days on market $125,900 Active 553 DOM
-
2026-06-17days on market $125,900 Active 552 DOM
-
2026-06-16days on market $125,900 Active 551 DOM
-
2026-06-15days on market $125,900 Active 550 DOM
-
2026-06-13days on market $125,900 Active 548 DOM
-
2026-06-10days on market $125,900 Active 545 DOM
-
2026-06-09days on market $125,900 Active 544 DOM
-
2026-06-09days on market $125,900 Active 543 DOM
-
2026-06-07days on market $125,900 Active 542 DOM
-
2026-06-03days on market $125,900 Active 538 DOM
-
2026-06-03days on market $125,900 Active 537 DOM
-
2026-06-01days on market $125,900 Active 536 DOM
-
2026-05-31days on market $125,900 Active 535 DOM
-
2024-12-13$125,900 Active
ⓘ Source: listings_history table (triggers on properties + properties_extension) + one-shot
backfill from property_details.listing_events for pre-trigger history.
Climate risk First Street
- Flood 1/10 Low FEMA zone X (unshaded) · 0% chance over 30 yrs
- Wildfire 1/10 Low
- Heat 2/10 Low 7 d/yr ≥95°F today · 15 d/yr by 30 yrs out
- Wind 1/10 Low
- Air quality 2/10 Low 1 unhealthy d/yr today · 2 by 30 yrs out
Nearby sold comps map
Loading sold comps map…
Walkable amenities ~0.75 mi
Loading nearby amenities…
Taxation est. · year 1
- Rental income
- $20,464
- − Mortgage interest
- −$7,052
- − Property taxes
- −$1,888
- − Insurance
- −$630
- − Repairs & maintenance
- −$1,637
- − Management
- −$1,637
- − Depreciation
- −$3,663
- Taxable income
- $3,957
- Est. tax owed @ 24.0%
- −$950
- After-tax cash flow
- $4,776/yr
For passive investors: Depreciation is non-cash, so a rental often shows a tax loss while cash-flowing — sheltering income. Rental losses are passive: they offset passive income freely, and up to $25,000/yr can offset ordinary (W-2) income if you actively participate and your MAGI is under $100k (phasing out to $0 by $150k); unused losses carry forward. On sale, claimed depreciation is recaptured at up to 25%, and gains may owe capital-gains tax (a 1031 exchange can defer both). Figures are a year-1 estimate at your 24.0% rate — not tax advice; consult a CPA.
Condition & rehab AI · 2 photos
This manufactured home requires extensive repairs, including new siding and roof, and routine maintenance such as repainting. Significant updates would substantially increase its resale and rental value.
Repairs flagged
- Major siding — Significant wear and tear
- Major roof — No visible roof condition
Value-add opportunities
- Both new siding — Enhances curb appeal and value
- Both new roof — Improves structural integrity and value
- Both paint — Fresh paint improves curb appeal and value
Renovation cost estimate screening
| Repair item | Severity | Est. cost |
|---|---|---|
| siding · Significant wear and tear | Major | $15,000–50,000 |
| roof · No visible roof condition | Major | $15,000–50,000 |
| Total estimated repair cost · 2 items | $30,000–100,000 |
Value-add ROI direction
- Both new siding — Enhances curb appeal and value ↑
- Both new roof — Improves structural integrity and value ↑
- Both paint — Fresh paint improves curb appeal and value ↑
ⓘ Cost ranges are severity-bucket heuristics (US national rule-of-thumb). Get contractor quotes + a written scope before underwriting a rehab budget.
Schools (NCES district)
- District
- Penfield Central School District
- NCES district ID
- 3622710
- Math proficiency
- 77% ▼ -3.00%
- Reading proficiency
- 79% ▲ 10.00%
- Median HH income
- $74,802
- Composite
- 68.37/100
- National rank
- #347
- State rank
- #67 of 590 in NY
Livability — St. John Fisher College
No livability data for this city. (Only ~50 U.S. cities are tracked.)
Census & demographics
- Population (ZIP)
- 10,667
Population outlook (Monroe County) Hauer SSP2
- Today (2025)
- 759,460 people
- By 2030
- 757,154 · -0.3%
- By 2040
- 740,644 · -2.5%
- By 2050
- 714,443 · -5.9%
- By 2075
- 645,883 · -15.0%
- By 2100
- 547,084 · -28.0%
Race, ethnicity, and origin ACS 2023
- Neighborhood character
- Predominantly White (85%)
- Race & ethnicity
- White 85% Two or more races 10% Hispanic / Latino 6% Black 1% Asian 1%
- Hispanic origin (detail)
- Puerto Rican 1% Dominican 1%
- Common ancestry
- Romanian 7% Subsaharan African 3% Iranian 2%
- Foreign-born
- 7% · Canada, China
- Languages at home
- 92% English-only · Russian/Polish/Slavic 3% Spanish 2% Other Indo-European 2%
Political lean MEDSL · Monroe
- 2024 margin
- D (+19.1) · D 59.5% · R 40.5%
- 2008→2024 swing
- +1.4pp toward D · 2008: 17.7pp · 2024: 19.1pp
- All cycles
- 2024: D+19.1 2020: D+21.0 2016: D+14.1 2012: D+17.4 2008: D+17.7
Not yet ingested
- Civics
- —
Market trends
- HPI YoY
- ▼ -49.69%
- Current HPI
- 275.9721
- Rent YoY
- —
- Metro
- —
- State GDP YoY
- ▲ 2.60%
- F500 in state
- 92
Industry mix (Fortune 500 HQ in NY)
| Industry | F500 HQs | Revenue |
|---|---|---|
| Financial Services | 10 | $950B |
|
||
| Consumer Goods | 9 | $162B |
|
||
| Insurance | 4 | $225B |
|
||
| Telecommunications | 2 | $144B |
|
||
| Pharmaceuticals | 2 | $112B |
|
||
| Media / Entertainment | 2 | $69B |
|
||
Price history
1 event — show timeline
- 2024-12-13 Listed $125,900 Zillow
Cash-flow waterfall
monthlySold comps — $/sqft
last 12 mo · ≤1 miLoading sold comps…