215 Mcclellan Ave · Cookeville, TN
Flood risk 1/10 · Minimal
- FEMA flood zone
- X (unshaded)
- Chance of flooding over 30 yrs
- 0.0%
- Est. flood insurance / yr
- $473 – $860
Fire risk 1/10 · Minimal
- Est. fire insurance / yr
- $949 – $1,763
Heat risk 5/10 · Moderate
- Hot days now (above 103°F)
- 7 days/yr
- Hot days in 30 yrs
- 20 days/yr
Wind risk 3/10 · Minor
- Chance of severe wind over 30 yrs
- 7.0%
Air-quality risk 2/10 · Minimal
- Unhealthy air days now
- 0 days/yr
- Unhealthy air days in 30 yrs
- 1 days/yr
Risk factors via First Street. Map © Google.
Why this score? — see what drove the B grade
The composite is a weighted blend of 9 inputs, each scored 0–100. Each bar is that input's sub-score; the figure is the points it added to the 100-point composite (weight × sub-score).
- Cash flow +29.6/30.0
- ARV discount +15.0/15.0
- DSCR +10.0/10.0
- 1% rule +7.5/10.0
- Livability +3.8/5.0
- Schools +2.6/10.0
- Condition / age +2.5/5.0
- Rent growth +2.1/5.0
- Appreciation +0.0/10.0
$144,900
🖨 Deal sheet (PDF) 📄 Offer letter ✓ Due diligence
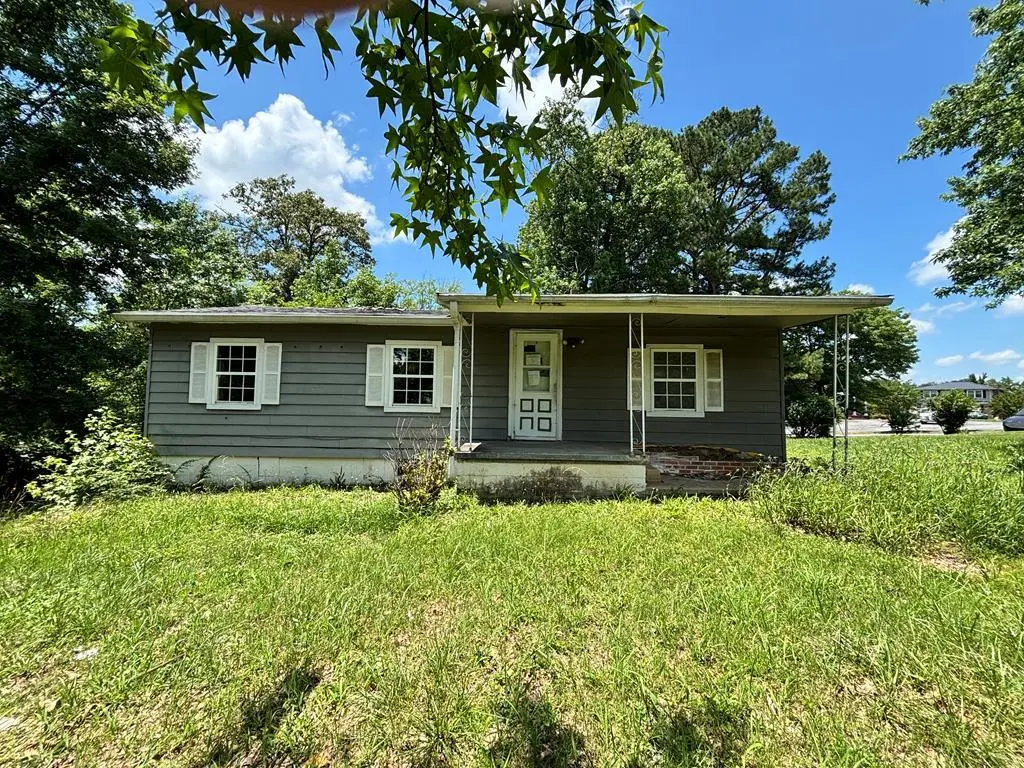
Listing remarks
Excellent investment opportunity in the heart of Cookeville! Situated on a beautiful lot within Cookeville city limits, this property offers incredible potential for investors, flippers, or buyers looking to renovate and make it their own. With a desirable and convenient location, the possibilities are endless! Whether you are looking for your next renovation project or an opportunity to create value with a short term or long term investment, this property offers a rare chance to transform a home in a sought-after location. Property is sold AS IS.
Key facts
- Beautiful lot
- Convenient location
- Renovation project
Tags
Property features AI
Exterior
- Utilities: Public water; Public sewer; Electric service with circuit breakers
- Home design: Single-family residence; Two levels; Site-built construction
- Construction: Block and vinyl siding exterior; Composition/shingle roof
- Exterior features: Covered porch; Paved road access; Lot approximately 23,320 sq ft (110' x 212' irr)
Interior
- Flooring: Vinyl flooring; Carpet flooring
- Bathrooms: 2 full bathrooms
- Heating & cooling: Radiant floor heating; Has heating; Has cooling
- Interior features: Double pane windows; No fireplace; Unfinished basement
- Laundry & utility: Laundry on main level
Neighborhood map
What this means for you Summary
Snapshot
- This is a 4-bed/2.0-bath single-family listed at $145k.
Deal economics
- At list price, monthly cash flow is $523 ($6k/yr) — positive.
- The deal already cash-flows at list — no discount required.
- Meets the 1% rule at list price ($2k rent vs $145k).
- Cap rate 10.6% vs local median 3.1% in Cookeville — top-decile yield for the area; either an underpriced asset or a hidden risk that comps aren't pricing in. Stress-test before assuming the spread holds.
Location & tenants
- Location reads 76/100 on livability (#11 in TN, #3,551 nationally) — a middle-class / working-renter tenant base. Strengths: amenities A+, cost of living A+, health & safety A+; Watch: schools D-, commute F, employment F.
- Putnam County (town): math 32% / reading 31% proficiency, ranked #49 of 139 in TN (top 35%) — families likely to look elsewhere, expect single-tenant / working-renter base with shorter leases.
- Market conditions: Rents soft (-1.4%/yr); 285 active listings in the ZIP; 6 comparable units currently listed for rent nearby; rentals lingering (median 46d on market — plan ~5-8 weeks vacancy on turnover, expect pricing pressure); 100% of comp listings sitting > 30 days — soft ceiling on asking rent; 700 units permitted in Putnam County in 2024 (48 in 5+ unit buildings).
- This rent runs 42% of the median local income ($52k/yr) — at the standard rent-burdened threshold; future hikes will face affordability resistance.
Forward outlook
- Local home prices are declining (-3.0%/yr); year-one equity from $1k of loan paydown is wiped out by about $4k of value loss. Plan a longer hold.
- Putnam County population projected at +16% by 2050 — long-run rental-demand tailwind backs the buy-and-hold thesis.
Negotiation context
- Only 6 days on market — expect competitive offers; lowballing is unlikely to land.
Risks & watch-outs
- Climate carrying-cost: extreme-heat days projected 7→20/yr by 2055 (HVAC capex compounding) — expect insurance premiums to compound above CPI over the hold.
Questions for the listing agent
- Built in 1962 — when were the roof, HVAC, electrical panel, plumbing, and water heater last replaced?
- Is there a deadline driving the sale (1031 exchange, divorce, estate, relocation)? That informs how much negotiation room exists.
- Schools are D-rated, which usually means shorter tenancies and higher turnover. Who's the typical renter profile here, and what's been the actual vacancy rate?
- What's the average days-on-market for RENTAL listings here right now (not sales)? A rising rental-DOM trend means longer vacancies and softer asking-rent achievability than the comps imply.
- What's the recent tenant-quality profile in this submarket — average credit score on applications, eviction rate, late-payment / NSF rate, and stable-employment percentage? A property-management company in the area should have these aggregated.
- How much new for-sale + rental construction is in the pipeline within 1–3 miles? Heavy new supply typically softens prices + rents 12–24 months out; constrained supply supports both.
Investment metrics
- 1% rule
- 1.25% ✓
- Cap rate
- 10.62%
- Cash-on-cash
- 15.46%
- DSCR
- 1.69
- GRM
- 6.7
CMA / ARV
- ARV (on-the-fly)
- $254,720
- Comps found
- 12
Show comp detail 12 sales within ~0.75 mi
| Address | Dist | Beds/Ba | Sqft | Sold | Price | $/sf | Match |
|---|---|---|---|---|---|---|---|
| 804 Clay Ave | 0.27mi | 3/2.5 (-1) | 1,341 (+5%) | 10mo | $304,000 | $227 | 64 |
| 517 Presley Ln | 0.49mi | 3/2.0 (-1) | 1,266 (-1%) | 11mo | $256,500 | $203 | 61 |
| 769 Robinson Rd | 0.35mi | 4/1.0 | 1,402 (+10%) | 7mo | $226,000 | $161 | 58 |
| 609 N Franklin Ave | 0.52mi | 3/2.0 (-1) | 1,280 (0%) | 17mo | $241,000 | $188 | 56 |
| 436 Chestnut Ave | 0.46mi | 3/1.0 (-1) | 1,224 (-4%) | 10mo | $158,000 | $129 | 54 |
| 300 Freedom Ave | 0.54mi | 3/2.0 (-1) | 1,236 (-3%) | 13mo | $246,000 | $199 | 53 |
| 523 Spruce Ave | 0.43mi | 3/2.0 (-1) | 1,395 (+9%) | 10mo | $295,000 | $211 | 51 |
| 491 6th St W | 0.45mi | 4/2.5 | 1,200 (-6%) | 19mo | $190,000 | $158 | 51 |
| 346 W 4th St | 0.45mi | 3/2.0 (-1) | 1,365 (+7%) | 16mo | $310,000 | $227 | 50 |
| 217 Farley Ave | 0.30mi | 3/2.0 (-1) | 1,104 (-14%) | 14mo | $228,000 | $207 | 46 |
| 460 W Stevens St | 0.55mi | 3/1.0 (-1) | 1,428 (+12%) | 7mo | $245,000 | $172 | 40 |
| 420 W 7th St | 0.52mi | 3/1.0 (-1) | 1,102 (-14%) | 18mo | $155,000 | $141 | 29 |
Match score weights: distance 35% · size 25% · config 20% · recency 20%. Top-matched comps best support the ARV.
Projected returns pro-forma
-3.0% appreciation · 0.0% rent growth · sell at horizon
- IRR
- 3.0%
- Equity multiple
- 1.11×
- Total profit
- $4,485
- Equity at exit
- $21,605
- IRR
- 9.6%
- Equity multiple
- 1.65×
- Total profit
- $26,173
- Equity at exit
- $12,528
Cash invested: $40,572 (down + closing). Projections, not guarantees.
Landlord ↔ Tenant lean methodology
- Overall (STATE)
- 87 Strongly Landlord-Friendly
- State Tennessee
- 87 Strongly Landlord-Friendly · R+13
- County
- — inherits STATE
- City
- — inherits STATE
ZIP-level market 38501
- Home prices YoY
- -24.2%
- Rents YoY
- -1.4%
- Active inventory
- 285
- Price-to-rent
- 6.7×
Monthly cashflow live
- Estimated rent
- $1,808 high interval (Pro) →
- Mortgage (P&I)
- −$760
- Tax from tax record
- −$85 /mo · $1,025/yr
- Insurance
- −$60
- HOA
- −$0
- Vacancy / Maint / Mgmt
- −$380
- Net cashflow
- $523
Break-even live
Sensitivity live
| Price | -10% $605 | -5% $564 | +0% $523 | +5% $482 | +10% $441 |
|---|---|---|---|---|---|
| Rent | -10% $380 | -5% $451 | +0% $523 | +5% $594 | +10% $666 |
| Rate | -1.0pp $596 | -0.5pp $560 | base $523 | +0.5pp $485 | +1.0pp $447 |
UW: 25.0% down · 7.5% · 30yr · 1.5% tax · 5.0% vac · 8.0% maint · 8.0% mgmt
Financing live
Cash to close
- Down payment
- $36,225
- Closing costs
- $4,347
- Reserves months
- —
- Total cash needed
- —
Loan-product check · same deal, 3 products live
Conventional
25% down · 7.5% · 30yr
- Down + closing
- —
- Monthly P&I
- —
- Monthly cashflow
- —
- DSCR
- —
- Eligible?
- —
Personal DTI + credit; lowest rate.
DSCR
20% down · 8.5% · 30yr
- Down + closing
- —
- Monthly P&I
- —
- Monthly cashflow
- —
- DSCR
- —
- Eligible?
- —
No personal income docs; deal must DSCR.
Hard money
10% down · 12.0% · 12mo
- Down + closing
- —
- Monthly P&I
- —
- Monthly cashflow
- —
- DSCR
- —
- Eligible?
- —
Short-term bridge; refi at stabilization.
Rent comps 6 comps
| Address | Beds | Baths | Sqft | Rent | $/sqft | DOM | Units | Dist |
|---|---|---|---|---|---|---|---|---|
| 49 Stout St Apt B Cookeville, TN | 3.0 | 1.5 | 1039 | $1,195 | $1.15 | 46d | 1 | 1.10mi |
| 158 King St Cookeville, TN | 3.0 | 1.0 | 1250 | $1,450 | $1.16 | 46d | 1 | 1.21mi |
| 1445 W Broad St Cookeville, TN | 2.0–3.0 | 2.0 | 1157 | $1,650 | $1.43 | 46d | 2 | 1.26mi |
| 325 Petite Dr Cookeville, TN | 3.0 | 1.5 | 1548 | $1,800 | $1.16 | 46d | 1 | 1.34mi |
| 1405 Brook Hill Dr Cookeville, TN | 3.0 | 2.0 | 1377 | $2,000 | $1.45 | 46d | 1 | 1.38mi |
| 237 N Maple Ave Cookeville, TN | 3.0 | 2.0 | 1500 | $1,900 | $1.27 | 46d | 1 | 1.47mi |
Listing history 9 events
-
2026-06-22days on market $144,900 Active 6 DOM
-
2026-06-19days on market $144,900 Active 4 DOM
-
2026-06-18days on market $144,900 Active 3 DOM
-
2026-06-17days on market $144,900 Active 2 DOM
-
2026-06-15days on market $144,900 Active 1 DOM
-
2026-06-15days on market $144,900 Active 5 DOM
-
2026-06-14days on market $144,900 Active 3 DOM
-
2026-06-13remarks 553-char remark
-
2026-06-13$144,900 Active 2 DOM
ⓘ Source: listings_history table (triggers on properties + properties_extension) + one-shot
backfill from property_details.listing_events for pre-trigger history.
Tax reassessment forecast TN · Resets to sale price
- Current annual tax
- $1,025 · $85/mo
- Projected year-2 tax
- $1,029 · $86/mo
- Expected delta
- +$4/yr ($0/mo · 0.4%)
ⓘ Screening estimate from a state-policy table — verify with the county assessor before closing.
Climate risk First Street
- Flood 1/10 Low FEMA zone X (unshaded) · 0% chance over 30 yrs
- Wildfire 1/10 Low
- Heat 5/10 Major 7 d/yr ≥103°F today · 20 d/yr by 30 yrs out
- Wind 3/10 Moderate 7% chance of damaging wind over 30 yrs
- Air quality 2/10 Low 0 unhealthy d/yr today · 1 by 30 yrs out
Nearby sold comps map
Loading sold comps map…
Walkable amenities ~0.75 mi
Loading nearby amenities…
Taxation est. · year 1
- Rental income
- $21,698
- − Mortgage interest
- −$8,117
- − Property taxes
- −$1,025
- − Insurance
- −$724
- − Repairs & maintenance
- −$1,736
- − Management
- −$1,736
- − Depreciation
- −$4,215
- Taxable income
- $4,145
- Est. tax owed @ 24.0%
- −$995
- After-tax cash flow
- $5,279/yr
For passive investors: Depreciation is non-cash, so a rental often shows a tax loss while cash-flowing — sheltering income. Rental losses are passive: they offset passive income freely, and up to $25,000/yr can offset ordinary (W-2) income if you actively participate and your MAGI is under $100k (phasing out to $0 by $150k); unused losses carry forward. On sale, claimed depreciation is recaptured at up to 25%, and gains may owe capital-gains tax (a 1031 exchange can defer both). Figures are a year-1 estimate at your 24.0% rate — not tax advice; consult a CPA.
Schools (NCES district)
- District
- Putnam County
- NCES district ID
- 4703480
- Math proficiency
- 32% ▼ -6.00%
- Reading proficiency
- 31% ▼ -5.00%
- Median HH income
- $35,738
- Composite
- 26.09/100
- National rank
- #7291
- State rank
- #49 of 139 in TN
Livability — Cookeville
- Score
- 76/100
- State rank
- #11
- US rank
- #3551
Category grades
Schools grade is shown separately in the Schools card above.
Census & demographics
- Census place
- Cookeville, TN
- County
- Putnam County · 72,571 people
- City population
- 72,571
- Metro
- Cookeville, TN
- Population (ZIP)
- 42,471
- Household income
- $52,145
- Rent vs Own
- Severe rent burden
- 2410.0
Population outlook (Putnam County) Hauer SSP2
- Today (2025)
- 80,122 people
- By 2030
- 82,798 · +3.3%
- By 2040
- 87,913 · +9.7%
- By 2050
- 92,659 · +15.6%
- By 2075
- 104,965 · +31.0%
- By 2100
- 113,256 · +41.4%
Race, ethnicity, and origin ACS 2023
- Neighborhood character
- Predominantly White (82%)
- Race & ethnicity
- White 82% Hispanic / Latino 9% Two or more races 6% Black 4% Asian 1%
- Hispanic origin (detail)
- Mexican 4%
- Common ancestry
- Serbian 2% Slovak 2% Lithuanian 2%
- Foreign-born
- 6% · Canada
- Languages at home
- 92% English-only · Spanish 5% Other Indo-European 1% French/Haitian/Cajun 1%
Political lean MEDSL · Putnam
- 2024 margin
- Solid R (+47.4) · D 25.7% · R 73.1% · Other 1.1%
- 2008→2024 swing
- -20.5pp toward R · 2008: -26.9pp · 2024: -47.4pp
- All cycles
- 2024: R+47.4 2020: R+43.4 2016: R+45.0 2012: R+37.1 2008: R+26.9
Not yet ingested
- Civics
- —
Market trends
- HPI YoY
- ▼ -91.19%
- Current HPI
- 285.6959
- Rent YoY
- ▼ -1.45%
- Metro
- Cookeville, TN
- State GDP YoY
- ▲ 2.78%
- F500 in state
- 22
Industry mix (Fortune 500 HQ in TN)
| Industry | F500 HQs | Revenue |
|---|---|---|
| Healthcare | 3 | $91B |
|
||
| Retail | 3 | $72B |
|
||
| Transportation / Logistics | 1 | $88B |
|
||
| Paper / Packaging | 1 | $19B |
|
||
| Insurance | 1 | $13B |
|
||
| Energy | 1 | $12B |
|
||
Price history
1 event — show timeline
- 2026-06-11 Listed $144,900 UCMLS
Property tax history
+7.1%/yrLatest (2025): $1,025 · +2.0% YoY. Source: county tax records.
Cash-flow waterfall
monthlySold comps — $/sqft
last 12 mo · ≤1 miLoading sold comps…