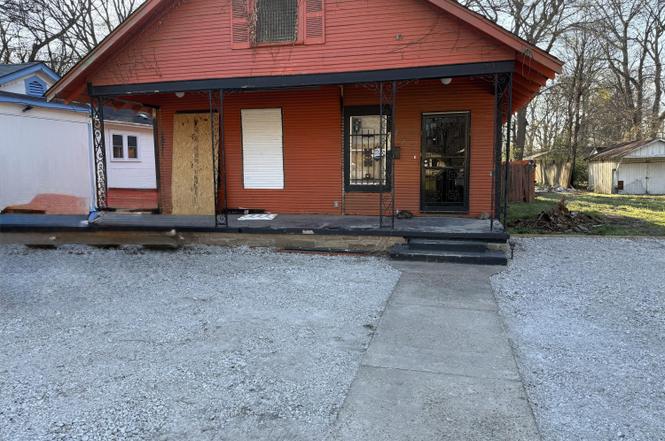
427 S Eureka St · Greenville, MS
Flood risk 1/10 · Minimal
- FEMA flood zone
- X
- Chance of flooding over 30 yrs
- 0.0%
- Est. flood insurance / yr
- $507 – $1,088
Fire risk 1/10 · Minimal
- Est. fire insurance / yr
- $1,241 – $2,305
Heat risk 7/10 · Major
- Hot days now (above 111°F)
- 7 days/yr
- Hot days in 30 yrs
- 21 days/yr
Wind risk 6/10 · Moderate
- Chance of severe wind over 30 yrs
- 37.0%
Air-quality risk 1/10 · Minimal
- Unhealthy air days now
- 0 days/yr
- Unhealthy air days in 30 yrs
- 0 days/yr
Risk factors via First Street. Map © Google.
Why this score? — see what drove the C+ grade
The composite is a weighted blend of 9 inputs, each scored 0–100. Each bar is that input's sub-score; the figure is the points it added to the 100-point composite (weight × sub-score).
- Cash flow +30.0/30.0
- DSCR +10.0/10.0
- 1% rule +8.3/10.0
- ARV discount +7.5/15.0
- Livability +2.9/5.0
- Rent growth +2.5/5.0
- Condition / age +2.5/5.0
- Schools +0.5/10.0
- Appreciation +0.0/10.0
$60,000
🖨 Deal sheet 📄 Offer letter ✓ Due diligence
Listing remarks MLS
Investment Opportunity - Cash Only This property is a prime investment opportunity with tons of potential. Sold as-is, no repairs or warranties will be made. Ideal for investors or cash buyers looking for their next project. Don't miss out! More pictures will be uploaded.
Key facts
- New appliances
- Newly installed tub
- New roof
Tags
Property features AI
Finance
- Other: Property located at 427 S Eureka St, Greenville, MS 38701
- Financial info: Tax information not included per instructions
- HOA & community: HOA information not provided
Exterior
- Parking: Driveway; 1-car carport
- Security: Security details not provided
- Utilities: Public water; Public sewer; Electricity connected; Natural gas connected; Water available
- Home design: Single-family house; One story; Raised foundation
- Construction: Siding construction
- Exterior features: Asphalt roof; Lot approximately 0.23 acre
Interior
- Kitchen: Free-standing refrigerator
- Bedrooms: 3 bedrooms
- Flooring: Flooring details not provided
- Bathrooms: 1 full bathroom
- Heating & cooling: Natural gas heating; Wall/window air conditioning units
- Interior features: Living room fireplace
- Laundry & utility: Washer/dryer info not provided
Neighborhood map
What this means for you Summary
Snapshot
- This is a 3-bed/1.0-bath single-family listed at $60k.
Deal economics
- At list price, monthly cash flow is $253 ($3k/yr) — positive.
- The deal already cash-flows at list — no discount required.
- Meets the 1% rule at list price ($799 rent vs $60k).
- Recommended offer: $55k (9.0% below list) — sets the bar for market timing.
- Cap rate 11.3% vs local median 4.5% in Greenville — top-decile yield for the area; either an underpriced asset or a hidden risk that comps aren't pricing in. Stress-test before assuming the spread holds.
Location & tenants
- Location reads 57/100 on livability (#284 in MS) — a working-class tenant base; expect higher turnover. Strengths: cost of living A+, housing A; Watch: schools F, amenities F, commute F.
- Greenville Public Schools (town): math 4% / reading 11% proficiency, ranked #126 of 130 in MS (top 97%) — low school quality limits family demand, transient renter base, plan for 1-2y turnover; 93% free/reduced lunch — lower-income household profile, screen leases tightly.
- Market conditions: 128 active listings in the ZIP; 1 comparable units currently listed for rent nearby; 10 units permitted in Washington County in 2024 (0 in 5+ unit buildings).
Forward outlook
- Local home prices are declining (-3.0%/yr); year-one equity from $415 of loan paydown is wiped out by about $2k of value loss. Plan a longer hold.
- Washington County population projected at -36% by 2050 — secular population decline; favor cash flow + early exit over multi-decade hold.
- At projected returns (-3.0% appreciation + 3.0% rent growth), your $17k cash investment doubles in ~7 years — after that, you're playing with house money.
Negotiation context
- It's been on market 105 days — a 9% lower offer ($55k) is reasonable based on typical stale-listing flexibility.
- 2 sale attempts; this cycle's ask has dropped $9k (13%) from the opening price — seller is motivated, your offer sets the floor, not the list.
- Current owner paid $32k; list at $60k implies a 88% gain — meaningful room to come down on a strong offer.
Risks & watch-outs
- Watch-outs: built in 1920 — expect roof / HVAC / electrical / plumbing capex.
- Climate carrying-cost: major wind risk, 37% chance of damaging wind over 30y; extreme-heat days projected 7→21/yr by 2055 (HVAC capex compounding) — expect insurance premiums to compound above CPI over the hold.
Questions for the listing agent
- It's been on market 105 days. Have you received any prior offers? Is the seller open to a 9% concession, seller financing, or rate buy-down credit?
- Built in 1920 — when were the roof, HVAC, electrical panel, plumbing, and water heater last replaced?
- Why hasn't it sold? Are there any deal-killer items the seller is aware of (foundation, flood, title, zoning, code violations)?
- Is there a deadline driving the sale (1031 exchange, divorce, estate, relocation)? That informs how much negotiation room exists.
- Schools are F-rated, which usually means shorter tenancies and higher turnover. Who's the typical renter profile here, and what's been the actual vacancy rate?
- What's the average days-on-market for RENTAL listings here right now (not sales)? A rising rental-DOM trend means longer vacancies and softer asking-rent achievability than the comps imply.
- What's the recent tenant-quality profile in this submarket — average credit score on applications, eviction rate, late-payment / NSF rate, and stable-employment percentage? A property-management company in the area should have these aggregated.
- How much new for-sale + rental construction is in the pipeline within 1–3 miles? Heavy new supply typically softens prices + rents 12–24 months out; constrained supply supports both.
Investment metrics
- 1% rule
- 1.33% ✓
- Cap rate
- 11.35%
- Cash-on-cash
- 18.05%
- DSCR
- 1.80
- GRM
- 6.3
CMA / ARV
- ARV (on-the-fly)
- $20,928
- Comps found
- 4
Show comp detail 4 sales within ~0.75 mi
| Address | Dist | Beds/Ba | Sqft | Sold | Price | $/sf | Match |
|---|---|---|---|---|---|---|---|
| 522 Inez St | 0.20mi | 3/1.0 | 1,358 (+4%) | 10mo | $13,500 | $10 | 76 |
| 423 Cedar St | 0.07mi | 3/2.0 | 1,435 (+10%) | 4mo | $22,900 | $16 | 74 |
| 437 2nd St | 0.37mi | 3/1.0 | 1,340 (+2%) | 12mo | $2,900 | $2 | 69 |
| 220 Hughes | 0.62mi | 3/2.0 | 1,452 (+11%) | 21mo | $27,000 | $19 | 31 |
Match score weights: distance 35% · size 25% · config 20% · recency 20%. Top-matched comps best support the ARV.
Projected returns pro-forma
-3.0% appreciation · 3.0% rent growth · sell at horizon
- IRR
- 9.6%
- Equity multiple
- 1.38×
- Total profit
- $6,361
- Equity at exit
- $8,946
- IRR
- 18.7%
- Equity multiple
- 2.56×
- Total profit
- $26,221
- Equity at exit
- $5,188
Cash invested: $16,800 (down + closing). Projections, not guarantees.
Landlord ↔ Tenant lean methodology
- Overall (STATE)
- 90 Strongly Landlord-Friendly
- State Mississippi
- 90 Strongly Landlord-Friendly · R+11
- County
- — inherits STATE
- City
- — inherits STATE
ZIP-level market 38701
- Active inventory
- 128
- Price-to-rent
- 6.3×
Monthly cashflow live
- Estimated rent
- $799 medium interval (Pro) →
- Mortgage (P&I)
- −$315
- Tax from tax record
- −$39 /mo · $467/yr
- Insurance
- −$25
- HOA
- −$0
- Vacancy / Maint / Mgmt
- −$168
- Net cashflow
- $253
Break-even live
UW: 25.0% down · 7.5% · 30yr · 1.5% tax · 5.0% vac · 8.0% maint · 8.0% mgmt
Financing live
Cash to close
- Down payment
- $15,000
- Closing costs
- $1,800
- Reserves months
- —
- Total cash needed
- —
Loan-product check · same deal, 3 products live
Conventional
25% down · 7.5% · 30yr
- Down + closing
- —
- Monthly P&I
- —
- Monthly cashflow
- —
- DSCR
- —
- Eligible?
- —
Personal DTI + credit; lowest rate.
DSCR
20% down · 8.5% · 30yr
- Down + closing
- —
- Monthly P&I
- —
- Monthly cashflow
- —
- DSCR
- —
- Eligible?
- —
No personal income docs; deal must DSCR.
Hard money
10% down · 12.0% · 12mo
- Down + closing
- —
- Monthly P&I
- —
- Monthly cashflow
- —
- DSCR
- —
- Eligible?
- —
Short-term bridge; refi at stabilization.
Rent comps 1 comps
| Address | Beds | Baths | Sqft | Rent | $/sqft | DOM | Units | Dist |
|---|---|---|---|---|---|---|---|---|
| 614 Fairview Ave Unit 7 Greenville, MS | 2.0 | 1.0 | 950 | $799 | $0.84 | 43d | 1 | 0.30mi |
Listing history 19 events
-
2026-06-18days on market $60,000 Active 105 DOM
-
2026-06-17days on market $60,000 Active 104 DOM
-
2026-06-16days on market $60,000 Active 103 DOM
-
2026-06-15days on market $60,000 Active 102 DOM
-
2026-06-13days on market $60,000 Active 100 DOM
-
2026-06-12days on market $60,000 Active 99 DOM
-
2026-06-09days on market $60,000 Active 96 DOM
-
2026-06-08days on market $60,000 Active 95 DOM
-
2026-06-07days on market $60,000 Active 94 DOM
-
2026-06-04days on market $60,000 Active 90 DOM
-
2026-06-02days on market $60,000 Active 89 DOM
-
2026-06-01days on market $60,000 Active 88 DOM
-
2026-05-31days on market $60,000 Active 87 DOM
-
2026-04-09price $60,000
-
2026-03-05$69,000 Active
-
2025-11-04soldstatus Closed 273-char remark
Show marketing remark (273 chars)
Investment Opportunity - Cash Only This property is a prime investment opportunity with tons of potential. Sold as-is, no repairs or warranties will be made. Ideal for investors or cash buyers looking for their next project. Don't miss out! More pictures will be uploaded.
-
2025-10-21status Pending 273-char remark
Show marketing remark (273 chars)
Investment Opportunity - Cash Only This property is a prime investment opportunity with tons of potential. Sold as-is, no repairs or warranties will be made. Ideal for investors or cash buyers looking for their next project. Don't miss out! More pictures will be uploaded.
-
2025-06-21$25,000 Active 273-char remark
Show marketing remark (273 chars)
Investment Opportunity - Cash Only This property is a prime investment opportunity with tons of potential. Sold as-is, no repairs or warranties will be made. Ideal for investors or cash buyers looking for their next project. Don't miss out! More pictures will be uploaded.
-
2021-03-25soldstatus $31,950
ⓘ Source: listings_history table (triggers on properties + properties_extension) + one-shot
backfill from property_details.listing_events for pre-trigger history.
Tax reassessment forecast MS · Resets to sale price
- Current annual tax
- $467 · $39/mo
- Projected year-2 tax
- $474 · $40/mo
- Expected delta
- +$7/yr (+$1/mo · 1.6%)
ⓘ Screening estimate from a state-policy table — verify with the county assessor before closing.
Climate risk First Street
- Flood 1/10 Low FEMA zone X · 0% chance over 30 yrs
- Wildfire 1/10 Low
- Heat 7/10 Severe 7 d/yr ≥111°F today · 21 d/yr by 30 yrs out
- Wind 6/10 Major 37% chance of damaging wind over 30 yrs
- Air quality 1/10 Low 0 unhealthy d/yr today · 0 by 30 yrs out
Nearby sold comps map
Loading sold comps map…
Walkable amenities ~0.75 mi
Loading nearby amenities…
Taxation est. · year 1
- Rental income
- $9,588
- − Mortgage interest
- −$3,361
- − Property taxes
- −$467
- − Insurance
- −$300
- − Repairs & maintenance
- −$767
- − Management
- −$767
- − Depreciation
- −$1,745
- Taxable income
- $2,181
- Est. tax owed @ 24.0%
- −$523
- After-tax cash flow
- $2,509/yr
For passive investors: Depreciation is non-cash, so a rental often shows a tax loss while cash-flowing — sheltering income. Rental losses are passive: they offset passive income freely, and up to $25,000/yr can offset ordinary (W-2) income if you actively participate and your MAGI is under $100k (phasing out to $0 by $150k); unused losses carry forward. On sale, claimed depreciation is recaptured at up to 25%, and gains may owe capital-gains tax (a 1031 exchange can defer both). Figures are a year-1 estimate at your 24.0% rate — not tax advice; consult a CPA.
Schools (NCES district)
- District
- Greenville Public Schools
- NCES district ID
- 2801620
- Math proficiency
- 4% ▼ -20.00%
- Reading proficiency
- 11% ▼ -12.00%
- Median HH income
- $26,432
- Composite
- 5.27/100
- National rank
- #10035
- State rank
- #126 of 130 in MS
Livability — Greenville
- Score
- 57/100
- State rank
- #284
- US rank
- #21778
Category grades
Schools grade is shown separately in the Schools card above.
Census & demographics
- Census place
- Greenville, MS
- Population (ZIP)
- 21,260
Population outlook (Washington County) Hauer SSP2
- Today (2025)
- 41,424 people
- By 2030
- 38,061 · -8.1%
- By 2040
- 31,752 · -23.3%
- By 2050
- 26,394 · -36.3%
- By 2075
- 17,180 · -58.5%
- By 2100
- 12,936 · -68.8%
Race, ethnicity, and origin ACS 2023
- Neighborhood character
- Predominantly Black (73%)
- Race & ethnicity
- Black 73% White 24% Asian 2%
- Common ancestry
- Lithuanian 1%
- Foreign-born
- 1%
- Languages at home
- 96% English-only · Spanish 1% Other Indo-European 1%
Political lean MEDSL · Washington
- 2024 margin
- Solid D (+35.0) · D 67.0% · R 32.0% · Other 1.1%
- 2008→2024 swing
- +0.2pp no change · 2008: 34.7pp · 2024: 35.0pp
- All cycles
- 2024: D+35.0 2020: D+40.0 2016: D+36.4 2012: D+42.7 2008: D+34.7
Not yet ingested
- Civics
- —
Market trends
- HPI YoY
- ▼ -102.75%
- Current HPI
- 52.6126
- Rent YoY
- —
- Metro
- —
- State GDP YoY
- —
- F500 in state
- 0
Price history
+87.8% since first listed6 events — show timeline
- 2026-04-09 Price Changed $60,000 MLSU
- 2026-03-05 Listed $69,000 MLSU
- 2025-11-04 Sold (MLS) — MLSU
- 2025-10-21 Pending — MLSU
- 2025-06-21 Listed $25,000 MLSU
- 2021-03-25 Sold (Public Records) $31,950 Public Records
Property tax history
+6.8%/yrLatest (2025): $467 · +4.0% YoY. Source: county tax records.
Cash-flow waterfall
monthlySold comps — $/sqft
last 12 mo · ≤1 miLoading sold comps…