 🏷️ Likely Rental
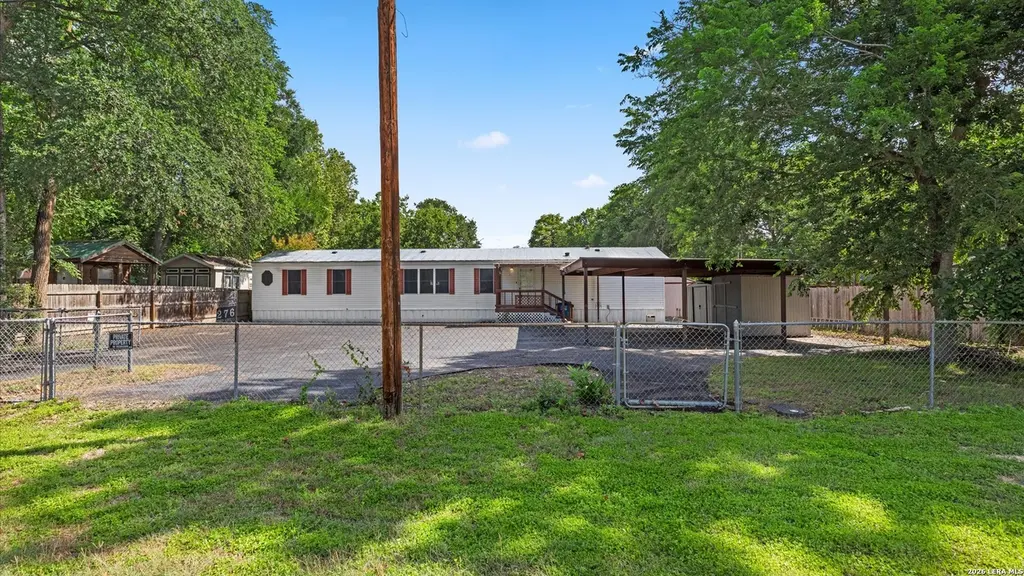
276 Riverview Ter · Seguin, TX
Flood risk 1/10 · Minimal
- FEMA flood zone
- X (shaded)
- Chance of flooding over 30 yrs
- 0.0%
- Est. flood insurance / yr
- $507 – $1,088
Fire risk 4/10 · Minor
- Est. fire insurance / yr
- $1,222 – $2,270
Heat risk 8/10 · Major
- Hot days now (above 108°F)
- 6 days/yr
- Hot days in 30 yrs
- 19 days/yr
Wind risk 8/10 · Major
- Chance of severe wind over 30 yrs
- 80.0%
Air-quality risk 1/10 · Minimal
- Unhealthy air days now
- 0 days/yr
- Unhealthy air days in 30 yrs
- 0 days/yr
Risk factors via First Street. Map © Google.
Why this score? — see what drove the C- grade
The composite is a weighted blend of 9 inputs, each scored 0–100. Each bar is that input's sub-score; the figure is the points it added to the 100-point composite (weight × sub-score).
- Cash flow +17.7/30.0
- ARV discount +15.0/15.0
- DSCR +5.5/10.0
- 1% rule +5.0/10.0
- Livability +3.3/5.0
- Rent growth +3.0/5.0
- Condition / age +2.5/5.0
- Schools +2.4/10.0
- Appreciation +0.0/10.0
$165,000
🖨 Deal sheet 📄 Offer letter ✓ Due diligence
Listing remarks MLS
Check out this spacious 3-bedroom, 2-bath single-wide manufactured home in Seguin! Offering 1,700 square feet of comfortable living space, this home features an open layout, a large backyard perfect for relaxing or entertaining, and a 2-car carport for convenient covered parking. This property also includes a 250 sq efficiency you can rent out for additional income (has a current tenant ask for details * * ) Enjoy the added extra of full river access, giving you the perfect spot for fishing, kayaking, or simply unwinding by the water.
Key facts
- Large backyard
- 250 sq efficiency
- Full river access
Tags
Property features AI
Finance
- Other: Possession at closing/funding; For sale
- HOA & community: Subdivision: FORSHAGE
Exterior
- Utilities: Water system; Septic; Co-op water
- Home design: Single-family home (pre-owned); Approximately 28 years old
- Construction: Vinyl exterior; Composition roof; Other foundation (see remarks)
- Exterior features: Chain link fence; Waterfront access
Interior
- Kitchen: Kitchen (14 x 8); Stove/Range; Walk-in pantry
- Bedrooms: Master bedroom with walk-in closet and full bath (split floorplan); Bedroom 2 (8 x 14); Bedroom 3 (9 x 17); Master bedroom dimensions 12 x 12
- Flooring: Carpeting; Vinyl floors
- Bathrooms: 2 full bathrooms; Master bath with double vanity and garden tub (8 x 17)
- Heating & cooling: Central heating (electric); Central air conditioning (1 unit)
- Interior features: Ceiling fans; Smoke alarm; Electric water heater; Private garbage service; Open floor plan; Separate dining room; Walk-in pantry; Utility room inside; Laundry room; Washer and dryer connections; Some window coverings remain; 1 living area
- Laundry & utility: Washer connection; Dryer connection; Utility room inside; Laundry room
Neighborhood map
What this means for you Summary
Snapshot
- This is a 3-bed/2.0-bath manufactured listed at $165k.
Deal economics
- At list price, monthly cash flow is $133 ($2k/yr) — positive.
- The deal already cash-flows at list — no discount required.
- Meets the 1% rule at list price ($2k rent vs $165k).
- Recommended offer: $160k (3.0% below list) — sets the bar for market timing.
- Cap rate 7.3% vs local median 3.7% in Seguin — top-decile yield for the area; either an underpriced asset or a hidden risk that comps aren't pricing in. Stress-test before assuming the spread holds.
Location & tenants
- Location reads 66/100 on livability (#592 in TX) — a middle-class / working-renter tenant base. Strengths: cost of living A+, housing A+; Watch: employment D, schools F, amenities F.
- Seguin ISD (town): math 26% / reading 30% proficiency, ranked #663 of 826 in TX (top 80%) — low school quality limits family demand, transient renter base, plan for 1-2y turnover; 63% free/reduced lunch — lower-income household profile, screen leases tightly.
- Market conditions: Rents rising (+2.0%/yr); 1342 active listings in the ZIP; 8 comparable units currently listed for rent nearby; rentals at typical pace (median 24d on market — plan ~3-4 weeks tenant-placement turnaround); 2,064 units permitted in Guadalupe County in 2024 (133 in 5+ unit buildings).
Forward outlook
- Local home prices are declining (-3.0%/yr); year-one equity from $1k of loan paydown is wiped out by about $5k of value loss. Plan a longer hold.
- Guadalupe County population projected at +61% by 2050 — long-run rental-demand tailwind backs the buy-and-hold thesis.
Negotiation context
- It's been on market 34 days — a 3% lower offer ($160k) is reasonable based on typical stale-listing flexibility.
- 6 sale attempts since 13y ago with the ask held roughly flat each time — persistent listings suggest the price (not the market) is what's stuck; bring a comps-based counter.
Risks & watch-outs
- Climate carrying-cost: severe wind risk, 80% chance of damaging wind over 30y; extreme-heat days projected 6→19/yr by 2055 (HVAC capex compounding) — expect insurance premiums to compound above CPI over the hold.
Questions for the listing agent
- It's been on market 34 days. Have you received any prior offers? Is the seller open to a 3% concession, seller financing, or rate buy-down credit?
- Is there a deadline driving the sale (1031 exchange, divorce, estate, relocation)? That informs how much negotiation room exists.
- Schools are F-rated, which usually means shorter tenancies and higher turnover. Who's the typical renter profile here, and what's been the actual vacancy rate?
- What's the average days-on-market for RENTAL listings here right now (not sales)? A rising rental-DOM trend means longer vacancies and softer asking-rent achievability than the comps imply.
- What's the recent tenant-quality profile in this submarket — average credit score on applications, eviction rate, late-payment / NSF rate, and stable-employment percentage? A property-management company in the area should have these aggregated.
- How much new for-sale + rental construction is in the pipeline within 1–3 miles? Heavy new supply typically softens prices + rents 12–24 months out; constrained supply supports both.
Investment metrics
- 1% rule
- 1.00% ✓
- Cap rate
- 7.26%
- Cash-on-cash
- 3.44%
- DSCR
- 1.15
- GRM
- 8.3
CMA / ARV
- ARV (median comp)
- $289,057
- List price
- $165,000
- Delta
- -42.92%
- Verdict
- UNDERPRICED
- Comps
- 20 within 1.0 mi
Projected returns pro-forma
-3.0% appreciation · 2.04% rent growth · sell at horizon
- IRR
- -12.0%
- Equity multiple
- 0.57×
- Total profit
- $-19,836
- Equity at exit
- $24,602
- IRR
- -4.3%
- Equity multiple
- 0.73×
- Total profit
- $-12,596
- Equity at exit
- $14,266
Cash invested: $46,200 (down + closing). Projections, not guarantees.
Landlord ↔ Tenant lean methodology
- Overall (STATE)
- 87 Strongly Landlord-Friendly
- State Texas
- 87 Strongly Landlord-Friendly · R+5
- County
- — inherits STATE
- City
- — inherits STATE
ZIP-level market 78155
- Rents YoY
- 2.0%
- Active inventory
- 1342
- Price-to-rent
- 8.3×
Monthly cashflow live
- Estimated rent
- $1,658 high interval (Pro) →
- Mortgage (P&I)
- −$865
- Tax from tax record
- −$243 /mo · $2,918/yr
- Insurance
- −$69
- HOA
- −$0
- Vacancy / Maint / Mgmt
- −$348
- Net cashflow
- $133
Break-even live
UW: 25.0% down · 7.5% · 30yr · 1.5% tax · 5.0% vac · 8.0% maint · 8.0% mgmt
Financing live
Cash to close
- Down payment
- $41,250
- Closing costs
- $4,950
- Reserves months
- —
- Total cash needed
- —
Loan-product check · same deal, 3 products live
Conventional
25% down · 7.5% · 30yr
- Down + closing
- —
- Monthly P&I
- —
- Monthly cashflow
- —
- DSCR
- —
- Eligible?
- —
Personal DTI + credit; lowest rate.
DSCR
20% down · 8.5% · 30yr
- Down + closing
- —
- Monthly P&I
- —
- Monthly cashflow
- —
- DSCR
- —
- Eligible?
- —
No personal income docs; deal must DSCR.
Hard money
10% down · 12.0% · 12mo
- Down + closing
- —
- Monthly P&I
- —
- Monthly cashflow
- —
- DSCR
- —
- Eligible?
- —
Short-term bridge; refi at stabilization.
Rent comps 8 comps
| Address | Beds | Baths | Sqft | Rent | $/sqft | DOM | Units | Dist |
|---|---|---|---|---|---|---|---|---|
| 311 Meadow Lake Dr Seguin, TX | 3.0 | 2.0 | 1064 | $1,400 | $1.32 | 14d | 1 | 0.13mi |
| 365 Forshage Blvd Seguin, TX | 2.0 | 1.0 | 1050 | $1,550 | $1.48 | 23d | 1 | 0.23mi |
| 882 Buerger Ln Seguin, TX | 3.0 | 2.0 | 1389 | $1,600 | $1.15 | 43d | 1 | 0.35mi |
| 1512 Doncaster Dr Seguin, TX | 3.0 | 2.0 | 1314 | $1,695 | $1.29 | 43d | 1 | 1.03mi |
| 1439 Barnes Dr Seguin, TX | 3.0 | 1.0–2.0 | 801 | $1,465 | $1.83 | 1d | 43 | 1.17mi |
| 745 Harry Miller Pass Seguin, TX | 1.0–3.0 | 1.0–2.5 | 1063 | $1,950 | $1.83 | 1d | 40 | 1.25mi |
| 313 Nagel St Seguin, TX | 3.0 | 2.0 | 1010 | $1,400 | $1.39 | 4d | 1 | 1.35mi |
| 210 Cottage St Seguin, TX | 3.0 | 3.0 | 1750 | $1,999 | $1.14 | 43d | 1 | 1.46mi |
Listing history 23 events
-
2026-06-18days on market $165,000 Active 34 DOM
-
2026-06-17days on market $165,000 Active 33 DOM
-
2026-06-16days on market $165,000 Active 32 DOM
-
2026-06-13days on market $165,000 Active 29 DOM
-
2026-06-09days on market $165,000 Active 25 DOM
-
2026-06-08days on market $165,000 Active 24 DOM
-
2026-06-07days on market $165,000 Active 23 DOM
-
2026-06-04days on market $165,000 Active 20 DOM
-
2026-06-03days on market $165,000 Active 19 DOM
-
2026-06-02days on market $165,000 Active 18 DOM
-
2026-06-01days on market $165,000 Active 17 DOM
-
2026-05-31days on market $165,000 Active 16 DOM
-
2026-05-15$165,000 New 538-char remark
-
2026-05-14$165,000 Active 542-char remark
Show marketing remark (542 chars)
Check out this spacious 3-bedroom, 2-bath single-wide manufactured home in Seguin! Offering 1,700 square feet of comfortable living space, this home features an open layout, a large backyard perfect for relaxing or entertaining, and a 2-car carport for convenient covered parking. This property also includes a 250 sq efficiency you can rent out for additional income (has a current tenant ask for details * * ) Enjoy the added extra of full river access, giving you the perfect spot for fishing, kayaking, or simply unwinding by the water.
-
2019-10-22soldstatus
-
2019-10-03status Pending
-
2019-10-01status Active
-
2019-09-28historical Active Take Backups
-
2019-09-10price $119,000
-
2019-08-15$135,000 Active
-
2017-02-12$119,900
-
2013-05-10soldstatus $70,000
-
2013-04-04$82,500
ⓘ Source: listings_history table (triggers on properties + properties_extension) + one-shot
backfill from property_details.listing_events for pre-trigger history.
Tax reassessment forecast TX · Resets to sale price
- Current annual tax
- $2,918 · $243/mo
- Projected year-2 tax
- $3,020 · $252/mo
- Expected delta
- +$101/yr (+$8/mo · 3.5%)
ⓘ Screening estimate from a state-policy table — verify with the county assessor before closing.
Climate risk First Street
- Flood 1/10 Low FEMA zone X (shaded) · 0% chance over 30 yrs
- Wildfire 4/10 Moderate
- Heat 8/10 Severe 6 d/yr ≥108°F today · 19 d/yr by 30 yrs out
- Wind 8/10 Severe 80% chance of damaging wind over 30 yrs
- Air quality 1/10 Low 0 unhealthy d/yr today · 0 by 30 yrs out
Nearby sold comps map
Loading sold comps map…
Walkable amenities ~0.75 mi
Loading nearby amenities…
Taxation est. · year 1
- Rental income
- $19,894
- − Mortgage interest
- −$9,243
- − Property taxes
- −$2,918
- − Insurance
- −$825
- − Repairs & maintenance
- −$1,592
- − Management
- −$1,592
- − Depreciation
- −$4,800
- Taxable loss
- −$1,074
- Est. tax savings @ 24.0%
- +$258
- After-tax cash flow
- $1,848/yr
For passive investors: Depreciation is non-cash, so a rental often shows a tax loss while cash-flowing — sheltering income. Rental losses are passive: they offset passive income freely, and up to $25,000/yr can offset ordinary (W-2) income if you actively participate and your MAGI is under $100k (phasing out to $0 by $150k); unused losses carry forward. On sale, claimed depreciation is recaptured at up to 25%, and gains may owe capital-gains tax (a 1031 exchange can defer both). Figures are a year-1 estimate at your 24.0% rate — not tax advice; consult a CPA.
Schools (NCES district)
- District
- Seguin ISD
- NCES district ID
- 4839690
- Math proficiency
- 26% ▼ -8.00%
- Reading proficiency
- 30% ▼ -5.00%
- Median HH income
- $46,210
- Composite
- 24.17/100
- National rank
- #7738
- State rank
- #663 of 826 in TX
Livability — Seguin
- Score
- 66/100
- State rank
- #592
- US rank
- #11298
Category grades
Schools grade is shown separately in the Schools card above.
Census & demographics
- County
- Guadalupe County · 147,291 people
- City population
- 55,600
- Metro
- San Antonio-New Braunfels, TX
- Population (ZIP)
- 55,600
- Household income
- $71,039
- Rent vs Own
- Severe rent burden
- 1053.0
Population outlook (Guadalupe County) Hauer SSP2
- Today (2025)
- 196,854 people
- By 2030
- 220,210 · +11.9%
- By 2040
- 268,004 · +36.1%
- By 2050
- 316,333 · +60.7%
- By 2075
- 434,747 · +120.8%
- By 2100
- 520,447 · +164.4%
Race, ethnicity, and origin ACS 2023
- Neighborhood character
- Diverse neighborhood (Simpson 0.58)
- Race & ethnicity
- Hispanic / Latino 49% White 43% Two or more races 26% Black 5%
- Hispanic origin (detail)
- Mexican 41%
- Common ancestry
- Lithuanian 2% Slovak 1% Romanian 1%
- Foreign-born
- 8% · Canada
- Languages at home
- 74% English-only · Spanish 24% German/W. Germanic 1%
Political lean MEDSL · Guadalupe
- 2024 margin
- Strong R (+29.5) · D 34.8% · R 64.3%
- 2008→2024 swing
- +1.5pp toward D · 2008: -31.0pp · 2024: -29.5pp
- All cycles
- 2024: R+29.5 2020: R+24.2 2016: R+31.8 2012: R+35.1 2008: R+31.0
Not yet ingested
- Civics
- —
Market trends
- HPI YoY
- ▼ -147.43%
- Current HPI
- 160.5435
- Rent YoY
- ▲ 2.04%
- Metro
- San Antonio-New Braunfels, TX
- State GDP YoY
- ▲ 3.95%
- F500 in state
- 110
Industry mix (Fortune 500 HQ in TX)
| Industry | F500 HQs | Revenue |
|---|---|---|
| Energy | 16 | $1,198B |
|
||
| Technology | 5 | $198B |
|
||
| Engineering / Construction | 4 | $72B |
|
||
| Energy Services | 3 | $60B |
|
||
| Utilities | 3 | $41B |
|
||
| Healthcare | 2 | $330B |
|
||
Price history
+100.0% since first listed11 events — show timeline
- 2026-05-15 Listed $165,000 LERA
- 2026-05-14 Listed $165,000 CTXMLS
- 2019-10-22 Sold (Public Records) — Public Records
- 2019-10-03 Pending — CTXMLS
- 2019-10-01 Relisted — CTXMLS
- 2019-09-28 Contingent — CTXMLS
- 2019-09-10 Price Changed $119,000 CTXMLS
- 2019-08-15 Listed $135,000 CTXMLS
- 2017-02-12 Listed $119,900 CTXMLS
- 2013-05-10 Sold (MLS) — CTXMLS
- 2013-04-04 Listed $82,500 CTXMLS
Property tax history
+14.4%/yrLatest (2026): $2,918 · +9.4% YoY. Source: county tax records.
Cash-flow waterfall
monthlySold comps — $/sqft
last 12 mo · ≤1 miLoading sold comps…