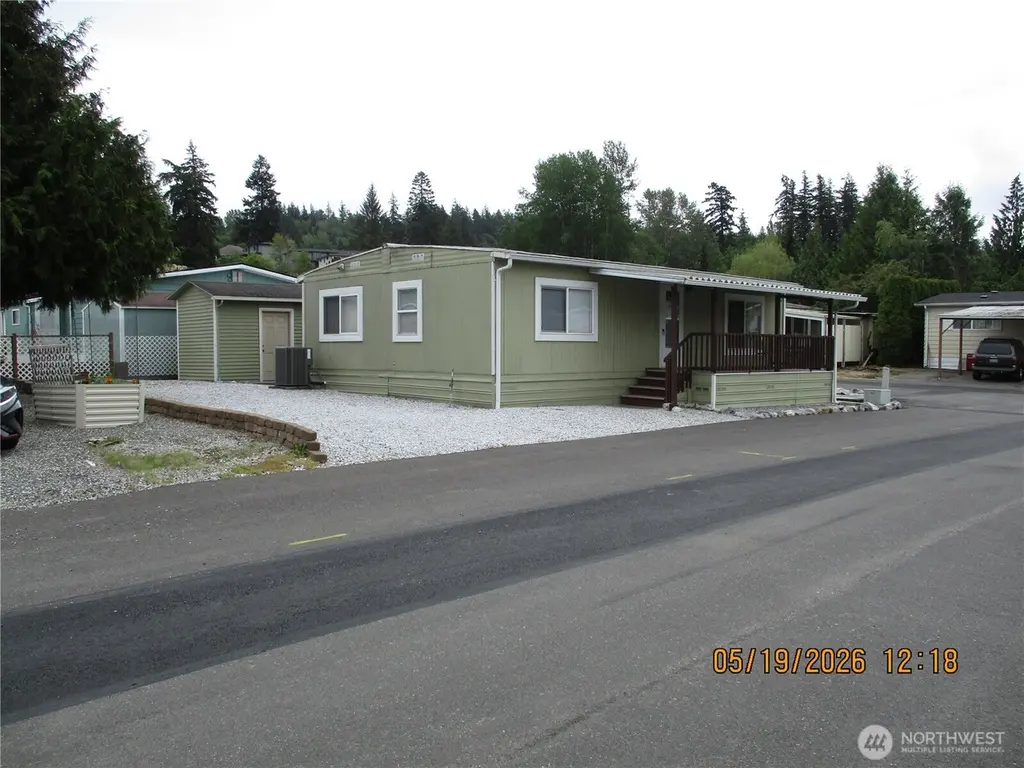
1200 Lincoln St #424 · Bellingham, WA
Flood risk 1/10 · Minimal
- FEMA flood zone
- X (unshaded)
- Chance of flooding over 30 yrs
- 0.0%
- Est. flood insurance / yr
- $507 – $1,088
Fire risk 1/10 · Minimal
- Est. fire insurance / yr
- $604 – $1,122
Heat risk 3/10 · Minor
- Hot days now (above 83°F)
- 7 days/yr
- Hot days in 30 yrs
- 17 days/yr
Wind risk 1/10 · Minimal
- Chance of severe wind over 30 yrs
- —
Air-quality risk 6/10 · Moderate
- Unhealthy air days now
- 9 days/yr
- Unhealthy air days in 30 yrs
- 10 days/yr
Risk factors via First Street. Map © Google.
Why this score? — see what drove the B grade
The composite is a weighted blend of 9 inputs, each scored 0–100. Each bar is that input's sub-score; the figure is the points it added to the 100-point composite (weight × sub-score).
- Cash flow +30.0/30.0
- 1% rule +10.0/10.0
- DSCR +10.0/10.0
- ARV discount +7.5/15.0
- Schools +4.8/10.0
- Livability +4.0/5.0
- Rent growth +3.3/5.0
- Condition / age +2.5/5.0
- Appreciation +0.0/10.0
$60,000
🖨 Deal sheet (PDF) 📄 Offer letter ✓ Due diligence
Listing remarks
Well kept 2 BR, 1 Bath doublewide in Lakeway Estates. Updated mobile home in very good condition with many upgrades. Large covered porch to relax and enjoy your day. Park approval required for new owners. Most residents are over 55 years old. 20% are allowed to be under 55. Rentals are allowed. This mobile home has air-conditioning for the hot summer days. Roof is 9 years old.
Key facts
- Updated mobile home
- Large covered porch
- Roof is 9 years old
Tags
Property features AI
Finance
- Other: Calculated building area 864 square feet; Structure type: Manufactured house, double wide; Levels: One
- Financial info: Listing terms: Cash or Conventional; Land lease amount applicable
- HOA & community: Located in Lakeway Estates manufactured home park; Park approved for sale; Senior community with senior exemption; Clubhouse, high-speed internet available, RV parking in park; Approximately 218 homes in the park; Land lease
Exterior
- Parking: Carport (storage located at carport)
- Utilities: Electric energy source; Community water (Lakeway Estates); Sewer via Lakeway Estates; Power by PSE; Cable connected (Comcast); Internet connected (Xfinity)
- Home design: Manufactured double-wide (Redman Flamingo); One level; Very good condition; Slab foundation
- Construction: Metal skirting; Composition roof; Metal/vinyl construction
- Exterior features: Metal/vinyl exterior; Corner lot; Paved lot; Patio/porch/deck; Has view
Interior
- Kitchen: Stove/Range; Refrigerator; Dishwasher; Kitchen with eating space
- Bedrooms: 2 bedrooms
- Flooring: Laminate; Carpet
- Bathrooms: 1 full bathroom with bathtub
- Heating & cooling: Forced air heating; Heat pump for heating and cooling
- Interior features: Water heater (electric, located exterior); Double pane windows; Bath off primary; Patio/porch/deck
- Laundry & utility: Washer; Dryer
Neighborhood map
What this means for you Summary
Snapshot
- This is a 2-bed/1.5-bath manufactured listed at $60k.
Deal economics
- At list price, monthly cash flow is $1k ($15k/yr) — positive.
- The deal already cash-flows at list — no discount required.
- Meets the 1% rule at list price ($2k rent vs $60k).
- Recommended offer: $59k (1.5% below list) — sets the bar for market timing.
- Cap rate 31.8% vs local median 2.0% in Bellingham — top-decile yield for the area; either an underpriced asset or a hidden risk that comps aren't pricing in. Stress-test before assuming the spread holds.
Location & tenants
- Location reads 80/100 on livability (#102 in WA, #1,947 nationally) — a professional / high-income tenant draw. Strengths: amenities A+, commute A+, health & safety A+; Watch: crime F, cost of living F.
- Bellingham School District (urban): math 47% / reading 63% proficiency, ranked #106 of 291 in WA (top 36%) — acceptable for families but not a draw, mixed tenant base, ~2y average lease.
- Market conditions: Rents rising (+3.4%/yr); 270 active listings in the ZIP; 40 comparable units currently listed for rent nearby; rentals at typical pace (median 22d on market — plan ~3-4 weeks tenant-placement turnaround); solid renter incomes; 1,190 units permitted in Whatcom County in 2024 (327 in 5+ unit buildings).
Forward outlook
- Local home prices are declining (-3.0%/yr); year-one equity from $415 of loan paydown is wiped out by about $2k of value loss. Plan a longer hold.
- Whatcom County population projected at +28% by 2050 — long-run rental-demand tailwind backs the buy-and-hold thesis.
- At projected returns (-3.0% appreciation + 3.4% rent growth), your $17k cash investment doubles in ~2 years — after that, you're playing with house money.
Negotiation context
- It's been on market 21 days — a 2% lower offer ($59k) is reasonable based on typical stale-listing flexibility.
- 3 sale attempts since 13y ago with the ask held roughly flat each time — persistent listings suggest the price (not the market) is what's stuck; bring a comps-based counter.
- Current owner paid $34k; list at $60k implies a 76% gain — meaningful room to come down on a strong offer.
Questions for the listing agent
- Built in 1974 — when were the roof, HVAC, electrical panel, plumbing, and water heater last replaced?
- Is there a deadline driving the sale (1031 exchange, divorce, estate, relocation)? That informs how much negotiation room exists.
- Schools are B-rated — typically a magnet for longer-tenancy family renters. What's the average tenant stay here, and is there a school-zone premium baked into asking?
- Crime grade is F in this area — have there been break-ins, vandalism, or insurance claims at this property in the last 3 years? What carrier currently insures it and at what premium?
- What's the average days-on-market for RENTAL listings here right now (not sales)? A rising rental-DOM trend means longer vacancies and softer asking-rent achievability than the comps imply.
- What's the recent tenant-quality profile in this submarket — average credit score on applications, eviction rate, late-payment / NSF rate, and stable-employment percentage? A property-management company in the area should have these aggregated.
- How much new for-sale + rental construction is in the pipeline within 1–3 miles? Heavy new supply typically softens prices + rents 12–24 months out; constrained supply supports both.
Investment metrics
- 1% rule
- 3.45% ✓
- Cap rate
- 31.84%
- Cash-on-cash
- 91.24%
- DSCR
- 5.06
- GRM
- 2.4
CMA / ARV
- ARV (on-the-fly)
- $27,648
- Comps found
- 8
Show comp detail 8 sales within ~0.75 mi
| Address | Dist | Beds/Ba | Sqft | Sold | Price | $/sf | Match |
|---|---|---|---|---|---|---|---|
| 1200 Lincoln St #410 | 0.10mi | 2/1.0 | 840 (-3%) | 11mo | $25,500 | $30 | 80 |
| 1200 Lincoln St #292 | 0.05mi | 2/1.0 | 936 (+8%) | 4mo | $30,000 | $32 | 78 |
| 1200 Lincoln St #253 | 0.16mi | 2/1.0 | 840 (-3%) | 11mo | $30,000 | $36 | 77 |
| 1200 Lincoln St #195 | 0.10mi | 2/1.0 | 840 (-3%) | 20mo | $25,000 | $30 | 72 |
| 1200 Lincoln St #124 | 0.24mi | 2/1.5 | 912 (+6%) | 13mo | $62,500 | $69 | 68 |
| 1200 Lincoln St #242 | 0.19mi | 2/2.0 | 924 (+7%) | 13mo | $8,000 | $9 | 67 |
| 1200 Lincoln St #306 | 0.06mi | 2/2.0 | 960 (+11%) | 20mo | $37,500 | $39 | 60 |
| 1200 Lincoln St #402 | 0.16mi | 2/1.0 | 763 (-12%) | 13mo | $19,000 | $25 | 60 |
Match score weights: distance 35% · size 25% · config 20% · recency 20%. Top-matched comps best support the ARV.
Projected returns pro-forma
-3.0% appreciation · 3.38% rent growth · sell at horizon
- IRR
- 92.4%
- Equity multiple
- 5.31×
- Total profit
- $72,425
- Equity at exit
- $8,946
- IRR
- 95.3%
- Equity multiple
- 11.18×
- Total profit
- $171,099
- Equity at exit
- $5,188
Cash invested: $16,800 (down + closing). Projections, not guarantees.
Landlord ↔ Tenant lean methodology
- Overall (STATE)
- 28 Tenant-Leaning
- State Washington
- 28 Tenant-Leaning · D+8
- County
- — inherits STATE
- City
- — inherits STATE
ZIP-level market 98229
- Rents YoY
- 3.4%
- Active inventory
- 270
- Price-to-rent
- 2.4×
Monthly cashflow live
- Estimated rent
- $2,071 high interval (Pro) →
- Mortgage (P&I)
- −$315
- Tax from tax record
- −$19 /mo · $227/yr
- Insurance
- −$25
- HOA
- −$0
- Vacancy / Maint / Mgmt
- −$435
- Net cashflow
- $1,277
Break-even live
Sensitivity live
| Price | -10% $1,311 | -5% $1,294 | +0% $1,277 | +5% $1,260 | +10% $1,243 |
|---|---|---|---|---|---|
| Rent | -10% $1,114 | -5% $1,196 | +0% $1,277 | +5% $1,359 | +10% $1,441 |
| Rate | -1.0pp $1,308 | -0.5pp $1,293 | base $1,277 | +0.5pp $1,262 | +1.0pp $1,246 |
UW: 25.0% down · 7.5% · 30yr · 1.5% tax · 5.0% vac · 8.0% maint · 8.0% mgmt
Financing live
Cash to close
- Down payment
- $15,000
- Closing costs
- $1,800
- Reserves months
- —
- Total cash needed
- —
Loan-product check · same deal, 3 products live
Conventional
25% down · 7.5% · 30yr
- Down + closing
- —
- Monthly P&I
- —
- Monthly cashflow
- —
- DSCR
- —
- Eligible?
- —
Personal DTI + credit; lowest rate.
DSCR
20% down · 8.5% · 30yr
- Down + closing
- —
- Monthly P&I
- —
- Monthly cashflow
- —
- DSCR
- —
- Eligible?
- —
No personal income docs; deal must DSCR.
Hard money
10% down · 12.0% · 12mo
- Down + closing
- —
- Monthly P&I
- —
- Monthly cashflow
- —
- DSCR
- —
- Eligible?
- —
Short-term bridge; refi at stabilization.
Rent comps 40 comps
| Address | Beds | Baths | Sqft | Rent | $/sqft | DOM | Units | Dist |
|---|---|---|---|---|---|---|---|---|
| 1743 E Maple St Bellingham, WA | 1.0–3.0 | 1.0–2.0 | 910 | $2,108 | $2.32 | 14d | 12 | 0.17mi |
| 208 N Samish Way Bellingham, WA | 2.0 | 1.0–2.0 | 875 | $2,769 | $3.16 | 14d | 8 | 0.26mi |
| 3613 Consolidation Ave Bellingham, WA | 3.0 | 2.0 | 1017 | $2,378 | $2.34 | 14d | 8 | 0.30mi |
| 1015 Otis St Bellingham, WA | 1.0 | 1.0 | 525 | $1,150 | $2.19 | 21d | 1 | 0.31mi |
| 1212 Nevada St Unit 1 Bellingham, WA | 2.0 | 1.0 | 975 | $1,750 | $1.79 | 21d | 1 | 0.36mi |
| 935 Otis St Bellingham, WA | 3.0 | 2.0 | 1000 | $2,500 | $2.50 | 21d | 1 | 0.36mi |
| 1223 E Laurel St Unit 1223 Bellingham, WA | 2.0 | 1.0 | 800 | $2,150 | $2.69 | 21d | 1 | 0.37mi |
| 3966 Byron Ave Unit 105 Bellingham, WA | 2.0 | 2.0 | 995 | $1,650 | $1.66 | 21d | 1 | 0.47mi |
| 3966 Byron Ave Bellingham, WA | 1.0 | 1.0 | 711 | $1,450 | $2.04 | 21d | 1 | 0.47mi |
| 3805 Elwood Ave Bellingham, WA | 4.0 | 1.0–2.5 | 1213 | $2,418 | $1.99 | 14d | 49 | 0.55mi |
| 1211 Jersey St Bellingham, WA | 3.0 | 1.0 | 871 | $2,411 | $2.77 | 14d | 12 | 0.56mi |
| 230 32nd St Unit 250-106 (ADA) Bellingham, WA | 2.0 | 1.0 | 738 | $1,725 | $2.34 | 14d | 1 | 0.60mi |
| 800 Liberty St Unit 17 Bellingham, WA | 2.0 | 1.0 | 950 | $1,795 | $1.89 | 21d | 1 | 0.61mi |
| 1024 Billy Frank Jr St #301 Bellingham, WA | 2.0 | 1.0 | 740 | $2,300 | $3.11 | 21d | 1 | 0.62mi |
| 1338 Puget St Unit 1 Bellingham, WA | 2.0 | 1.0 | 801 | $1,800 | $2.25 | 14d | 1 | 0.63mi |
| 1213 Billy Frank Jr. St Unit 2 Bellingham, WA | 2.0 | 1.0 | 719 | $1,750 | $2.43 | 21d | 1 | 0.63mi |
| 1010 Billy Frank Jr St Bellingham, WA | 2.0 | 1.0 | 850 | $1,765 | $2.08 | 14d | 11 | 0.64mi |
| 1113 Billy Frank Jr. St Unit 3 Bellingham, WA | 2.0 | 1.0 | 900 | $1,795 | $1.99 | 21d | 1 | 0.64mi |
| 1316 High St Bellingham, WA | 3.0 | 1.0–2.0 | 909 | $2,410 | $2.65 | 21d | 5 | 0.67mi |
| 1471 Moore St Bellingham, WA | 2.0–3.0 | 2.0 | 860 | $1,675 | $1.95 | 21d | 6 | 0.68mi |
| 921 High St #7 Bellingham, WA | 1.0 | 1.0 | 734 | $2,300 | $3.13 | 21d | 1 | 0.75mi |
| 1205 N Garden St Bellingham, WA | 2.0–4.0 | 1.0–1.5 | 830 | $2,150 | $2.59 | 21d | 9 | 0.77mi |
| 1117 N Garden St Bellingham, WA | 3.0–4.0 | 2.0 | 1100 | $2,233 | $2.03 | 14d | 3 | 0.77mi |
| 421 E Maple St Bellingham, WA | 1.0 | 1.0 | 875 | $900 | $1.03 | 21d | 2 | 0.77mi |
| 819 High St #102 Bellingham, WA | 1.0 | 1.0 | 616 | $1,800 | $2.92 | 21d | 1 | 0.81mi |
| 1100 N Forest St Bellingham, WA | 1.0 | 1.0 | 600 | $1,650 | $2.75 | 21d | 1 | 0.81mi |
| 1111 N Forest St Bellingham, WA | 3.0 | 1.0–1.5 | 770 | $2,375 | $3.08 | 14d | 4 | 0.84mi |
| 487 31st St Bellingham, WA | 1.0–2.0 | 1.0 | 697 | $1,890 | $2.71 | 21d | 33 | 0.85mi |
| 508 E Ivy St Apt 101 Bellingham, WA | 2.0 | 1.0 | 704 | $1,795 | $2.55 | 21d | 1 | 0.85mi |
| 508 E Ivy St Unit 104 Bellingham, WA | 2.0 | 1.0 | 704 | $1,850 | $2.63 | 21d | 1 | 0.85mi |
| 524 32nd St Bellingham, WA | 3.0 | 2.0 | 1100 | $2,480 | $2.25 | 21d | 3 | 0.89mi |
| 202 E Holly St Bellingham, WA | 1.0 | 1.0 | 397 | $1,650 | $4.15 | 21d | 9 | 0.93mi |
| 1745 James St Unit 1745-A Bellingham, WA | 2.0 | 1.0 | 728 | $1,950 | $2.68 | 14d | 1 | 0.98mi |
| 112 E Maple St Bellingham, WA | 1.0 | 1.0 | 555 | $1,725 | $3.11 | 14d | 1 | 0.98mi |
| 112 E Maple St Bellingham, WA | 1.0 | 1.0 | 602 | $1,712 | $2.84 | 21d | 2 | 0.99mi |
| 1015 Railroad Ave #303 Bellingham, WA | 1.0 | 1.0 | 640 | $1,800 | $2.81 | 14d | 1 | 0.99mi |
| 705 32nd St Bellingham, WA | 3.0 | 1.0–2.0 | 792 | $2,095 | $2.65 | 21d | 23 | 0.99mi |
| 711 Astor St Bellingham, WA | 1.0 | 1.0 | 660 | $2,075 | $3.14 | 21d | 1 | 1.44mi |
| 2506 Douglas Ave Bellingham, WA | 2.0 | 1.0 | 880 | $1,875 | $2.13 | 14d | 2 | 1.46mi |
| 2305 Douglas Ave Bellingham, WA | 1.0–4.0 | 1.0–4.0 | 1089 | $2,222 | $2.04 | 14d | 16 | 1.46mi |
Listing history 26 events
-
2026-06-18days on market $60,000 Active 21 DOM
-
2026-06-17days on market $60,000 Active 20 DOM
-
2026-06-16days on market $60,000 Active 19 DOM
-
2026-06-15days on market $60,000 Active 18 DOM
-
2026-06-14days on market $60,000 Active 16 DOM
-
2026-06-13days on market $60,000 Active 15 DOM
-
2026-06-10days on market $60,000 Active 13 DOM
-
2026-06-09days on market $60,000 Active 12 DOM
-
2026-06-08days on market $60,000 Active 11 DOM
-
2026-06-07days on market $60,000 Active 10 DOM
-
2026-06-05days on market $60,000 Active 7 DOM
-
2026-06-03days on market $60,000 Active 6 DOM
-
2026-06-02days on market $60,000 Active 5 DOM
-
2026-06-01days on market $60,000 Active 4 DOM
-
2026-05-31days on market $60,000 Active 3 DOM
-
2026-05-30days on market $60,000 Active 2 DOM
-
2026-05-21$60,000 Active
-
2014-02-03historical
-
2014-01-31soldstatus $34,000 Sold
-
2014-01-28status Pending
-
2014-01-16status Pending Inspection
-
2014-01-14price $36,000
-
2014-01-14$38,000 Active
-
2013-11-14soldstatus $29,000 Sold
-
2013-10-16status Pending
-
2013-10-02$29,950 Active
ⓘ Source: listings_history table (triggers on properties + properties_extension) + one-shot
backfill from property_details.listing_events for pre-trigger history.
Tax reassessment forecast WA · Resets to sale price
- Current annual tax
- $227 · $19/mo
- Projected year-2 tax
- $588 · $49/mo
- Expected delta
- +$361/yr (+$30/mo · 159.0%)
ⓘ Screening estimate from a state-policy table — verify with the county assessor before closing.
Climate risk First Street
- Flood 1/10 Low FEMA zone X (unshaded) · 0% chance over 30 yrs
- Wildfire 1/10 Low
- Heat 3/10 Moderate 7 d/yr ≥83°F today · 17 d/yr by 30 yrs out
- Wind 1/10 Low
- Air quality 6/10 Major 9 unhealthy d/yr today · 10 by 30 yrs out
Nearby sold comps map
Loading sold comps map…
Walkable amenities ~0.75 mi
Loading nearby amenities…
Taxation est. · year 1
- Rental income
- $24,850
- − Mortgage interest
- −$3,361
- − Property taxes
- −$227
- − Insurance
- −$300
- − Repairs & maintenance
- −$1,988
- − Management
- −$1,988
- − Depreciation
- −$1,745
- Taxable income
- $15,240
- Est. tax owed @ 24.0%
- −$3,658
- After-tax cash flow
- $11,671/yr
For passive investors: Depreciation is non-cash, so a rental often shows a tax loss while cash-flowing — sheltering income. Rental losses are passive: they offset passive income freely, and up to $25,000/yr can offset ordinary (W-2) income if you actively participate and your MAGI is under $100k (phasing out to $0 by $150k); unused losses carry forward. On sale, claimed depreciation is recaptured at up to 25%, and gains may owe capital-gains tax (a 1031 exchange can defer both). Figures are a year-1 estimate at your 24.0% rate — not tax advice; consult a CPA.
Schools (NCES district)
- District
- Bellingham School District
- NCES district ID
- 5300420
- Math proficiency
- 47% ▼ -6.00%
- Reading proficiency
- 63% ▼ -1.00%
- Median HH income
- $47,678
- Composite
- 48.49/100
- National rank
- #4632
- State rank
- #106 of 291 in WA
Livability — Bellingham
- Score
- 80/100
- State rank
- #102
- US rank
- #1947
Category grades
Schools grade is shown separately in the Schools card above.
Census & demographics
- Census place
- Bellingham, WA
- County
- Whatcom County · 209,776 people
- City population
- 130,296
- Metro
- Bellingham, WA
- Population (ZIP)
- 33,298
- Household income
- $90,945
- Rent vs Own
- Severe rent burden
- 1040.0
Population outlook (Whatcom County) Hauer SSP2
- Today (2025)
- 240,408 people
- By 2030
- 254,667 · +5.9%
- By 2040
- 281,365 · +17.0%
- By 2050
- 307,592 · +27.9%
- By 2075
- 375,576 · +56.2%
- By 2100
- 421,637 · +75.4%
Race, ethnicity, and origin ACS 2023
- Neighborhood character
- Predominantly White (77%)
- Race & ethnicity
- White 77% Two or more races 13% Hispanic / Latino 10% Asian 3%
- Hispanic origin (detail)
- Mexican 8%
- Common ancestry
- Portuguese 6% Italian 4% Slovak 4%
- Foreign-born
- 8% · Canada, China, Vietnam
- Languages at home
- 88% English-only · Spanish 7% Chinese 1% German/W. Germanic 1%
Political lean MEDSL · Whatcom
- 2024 margin
- Strong D (+24.9) · D 60.8% · R 35.9% · Other 3.3%
- 2008→2024 swing
- +6.9pp toward D · 2008: 18.0pp · 2024: 24.9pp
- All cycles
- 2024: D+24.9 2020: D+23.9 2016: D+17.7 2012: D+12.1 2008: D+18.0
Not yet ingested
- Civics
- —
Market trends
- HPI YoY
- ▼ -652.00%
- Current HPI
- 413.1478
- Rent YoY
- ▲ 3.38%
- Metro
- Bellingham, WA
- State GDP YoY
- ▲ 4.65%
- F500 in state
- 22
Industry mix (Fortune 500 HQ in WA)
| Industry | F500 HQs | Revenue |
|---|---|---|
| Retail | 2 | $269B |
|
||
| Technology / Retail | 1 | $638B |
|
||
| Technology | 1 | $245B |
|
||
| Telecommunications | 1 | $38B |
|
||
| Food / Beverage | 1 | $36B |
|
||
| Automotive / Trucks | 1 | $34B |
|
||
Price history
+100.3% since first listed10 events — show timeline
- 2026-05-21 Listed $60,000 NWMLS as Distributed by MLS Grid
- 2014-02-03 Delisted — NWMLS as Distributed by MLS Grid
- 2014-01-31 Sold (MLS) $34,000 NWMLS as Distributed by MLS Grid
- 2014-01-28 Pending — NWMLS as Distributed by MLS Grid
- 2014-01-16 Pending — NWMLS as Distributed by MLS Grid
- 2014-01-14 Price Changed $36,000 NWMLS as Distributed by MLS Grid
- 2014-01-14 Listed $38,000 NWMLS as Distributed by MLS Grid
- 2013-11-14 Sold (MLS) $29,000 NWMLS as Distributed by MLS Grid
- 2013-10-16 Pending — NWMLS as Distributed by MLS Grid
- 2013-10-02 Listed $29,950 NWMLS as Distributed by MLS Grid
Property tax history
-0.3%/yrLatest (2016): $227 · -3.3% YoY. Source: county tax records.
Cash-flow waterfall
monthlySold comps — $/sqft
last 12 mo · ≤1 miLoading sold comps…