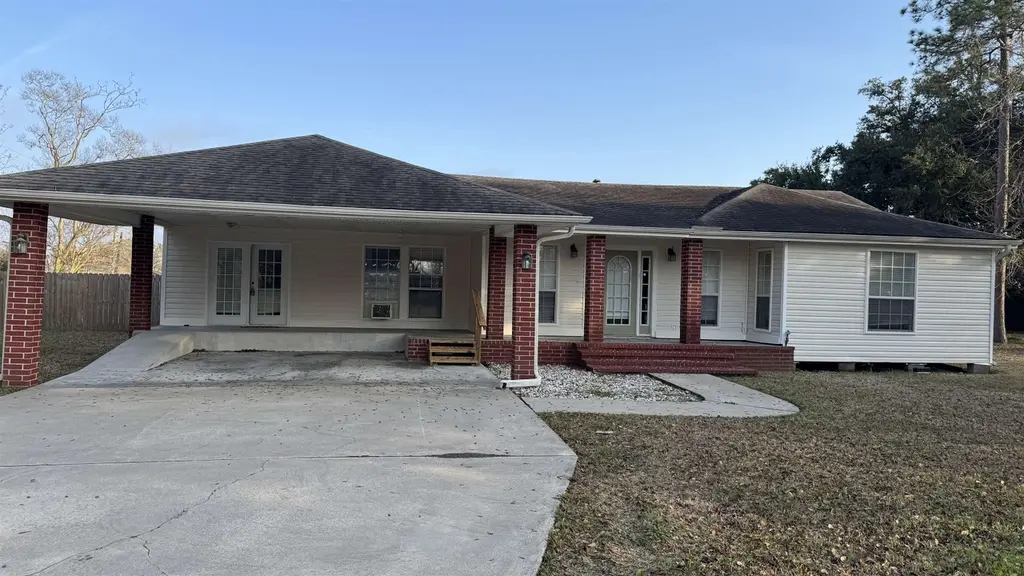
2527 Merriman St · Port Neches, TX
Flood risk 7/10 · Major
- FEMA flood zone
- X
- Chance of flooding over 30 yrs
- 0.74%
- Est. flood insurance / yr
- $507 – $1,088
Fire risk 1/10 · Minimal
- Est. fire insurance / yr
- $1,222 – $2,270
Heat risk 9/10 · Severe
- Hot days now (above 110°F)
- 7 days/yr
- Hot days in 30 yrs
- 24 days/yr
Wind risk 9/10 · Severe
- Chance of severe wind over 30 yrs
- 99.0%
Air-quality risk 2/10 · Minimal
- Unhealthy air days now
- 1 days/yr
- Unhealthy air days in 30 yrs
- 1 days/yr
Risk factors via First Street. Map © Google.
Why this score? — see what drove the D- grade
The composite is a weighted blend of 9 inputs, each scored 0–100. Each bar is that input's sub-score; the figure is the points it added to the 100-point composite (weight × sub-score).
- ARV discount +15.0/15.0
- Cash flow +7.1/30.0
- Schools +3.9/10.0
- Livability +3.8/5.0
- 1% rule +3.2/10.0
- Rent growth +2.5/5.0
- Condition / age +2.5/5.0
- DSCR +1.3/10.0
- Appreciation +0.0/10.0
$229,900
🖨 Deal sheet (PDF) 📄 Offer letter ✓ Due diligence
Listing remarks MLS
Lovely old country home on large lot in Port Neches with Port Neches/Groves Schools. Floor plan has open concept with separate bedroom floor plan, breakfast area, breakfast bar, refrigerator, gas stove, dishwasher stay with home, covered front porch & wood deck in the back with privacy fenced back lawn & storage shed. Home is Handicap Accessible on front porch, back deck & also Master bath.
Key facts
- Open concept
- Large lot
- Gas stove
Tags
Neighborhood map
What this means for you Summary
Snapshot
- This is a 3-bed/2.0-bath single-family listed at $230k.
Deal economics
- At list price, monthly cash flow is $-393 ($-5k/yr) — negative.
- To cash-flow at today's rent, offer at most $160k (30.2% below list).
- To meet the 1% rule (rent ≥ 1% of price), the offer needs to be $189k (17.6% below list).
- Recommended offer: $160k (30.2% below list) — sets the bar for cash-flow.
Location & tenants
- Location reads 75/100 on livability (#139 in TX, #3,996 nationally) — a middle-class / working-renter tenant base. Strengths: employment A+, cost of living A+, housing A+; Watch: amenities F, commute F.
- Port Neches-Groves ISD (suburban): math 42% / reading 47% proficiency, ranked #260 of 826 in TX (top 32%) — families likely to look elsewhere, expect single-tenant / working-renter base with shorter leases.
- Market conditions: 96 active listings in the ZIP; 3 comparable units currently listed for rent nearby; rentals at typical pace (median 16d on market — plan ~3-4 weeks tenant-placement turnaround); 343 units permitted in Jefferson County in 2024 (0 in 5+ unit buildings).
Forward outlook
- Local home prices are declining (-3.0%/yr); year-one equity from $2k of loan paydown is wiped out by about $7k of value loss. Plan a longer hold.
Negotiation context
- It's been on market 96 days — a 9% lower offer ($209k) is reasonable based on typical stale-listing flexibility.
- 3 sale attempts since 7y ago; this cycle's ask has dropped $19k (8%) from the opening price — seller is motivated, your offer sets the floor, not the list.
Risks & watch-outs
- Watch-outs: property tax is 2.7% of price; flood insurance adds $66/mo.
- Climate carrying-cost: major flood risk; severe wind risk, 99% chance of damaging wind over 30y; extreme-heat days projected 7→24/yr by 2055 (HVAC capex compounding) — expect insurance premiums to compound above CPI over the hold.
Questions for the listing agent
- What do current leases actually rent for vs. the listed asking? Can we see a recent rent roll and the last 12 months of T-12 income?
- It's been on market 96 days. Have you received any prior offers? Is the seller open to a 30% concession, seller financing, or rate buy-down credit?
- Built in 1978 — when were the roof, HVAC, electrical panel, plumbing, and water heater last replaced?
- Property tax is high relative to price — has the assessment been appealed recently, and will the sale trigger a re-assessment?
- What's the actual annual flood-insurance premium (NFIP or private), and is the property in a SFHA with mandatory coverage?
- Why hasn't it sold? Are there any deal-killer items the seller is aware of (foundation, flood, title, zoning, code violations)?
- Is there a deadline driving the sale (1031 exchange, divorce, estate, relocation)? That informs how much negotiation room exists.
- Schools are B-rated — typically a magnet for longer-tenancy family renters. What's the average tenant stay here, and is there a school-zone premium baked into asking?
- The area grade is low — what's the realistic commute time and amenity access for the typical tenant pool here? Any planned neighborhood developments (good or bad) we should know about?
- What's the average days-on-market for RENTAL listings here right now (not sales)? A rising rental-DOM trend means longer vacancies and softer asking-rent achievability than the comps imply.
- What's the recent tenant-quality profile in this submarket — average credit score on applications, eviction rate, late-payment / NSF rate, and stable-employment percentage? A property-management company in the area should have these aggregated.
- How much new for-sale + rental construction is in the pipeline within 1–3 miles? Heavy new supply typically softens prices + rents 12–24 months out; constrained supply supports both.
Investment metrics
- 1% rule
- 0.82% ✗
- Cap rate
- 4.59%
- Cash-on-cash
- -6.09%
- DSCR
- 0.73
- GRM
- 10.1
CMA / ARV
- ARV (median comp)
- $311,252
- List price
- $229,900
- Delta
- -26.14%
- Verdict
- UNDERPRICED
- Comps
- 20 within 1.0 mi
Show comp detail 10 sales within ~0.75 mi
| Address | Dist | Beds/Ba | Sqft | Sold | Price | $/sf | Match |
|---|---|---|---|---|---|---|---|
| 509 Barbara Ct | 0.29mi | 3/2.0 | 1,647 (+0%) | 11mo | $239,000 | $145 | 77 |
| 2414 Merriman St | 0.17mi | 3/2.0 | 1,689 (+3%) | 14mo | $204,900 | $121 | 75 |
| 2325 Patricia Ln | 0.32mi | 3/2.0 | 1,749 (+7%) | 11mo | $319,000 | $182 | 64 |
| 3148 Galewood Ln | 0.59mi | 3/2.0 | 1,600 (-2%) | 10mo | $269,900 | $169 | 61 |
| 2705 15th Street St | 0.60mi | 2/2.0 (-1) | 1,754 (+7%) | 1mo | $260,000 | $148 | 55 |
| 845 Goodwin Ave | 0.39mi | 3/2.0 | 1,476 (-10%) | 13mo | $199,000 | $135 | 55 |
| 749 Eveningview Ln | 0.51mi | 3/2.0 | 1,505 (-8%) | 12mo | $270,000 | $179 | 52 |
| 2626 Staton Ln | 0.51mi | 3/2.0 | 1,800 (+10%) | 12mo | $221,499 | $123 | 50 |
| 3153 Merriman St | 0.53mi | 3/2.0 | 1,447 (-12%) | 10mo | $239,900 | $166 | 47 |
| 3152 Sandalwood Dr | 0.54mi | 2/2.0 (-1) | 1,418 (-14%) | 1mo | $199,900 | $141 | 47 |
Match score weights: distance 35% · size 25% · config 20% · recency 20%. Top-matched comps best support the ARV.
Projected returns pro-forma
-3.0% appreciation · 3.0% rent growth · sell at horizon
- IRR
- -28.9%
- Equity multiple
- 0.04×
- Total profit
- $-62,096
- Equity at exit
- $34,279
- IRR
- -28.3%
- Equity multiple
- -0.33×
- Total profit
- $-85,468
- Equity at exit
- $19,878
Cash invested: $64,372 (down + closing). Projections, not guarantees.
Landlord ↔ Tenant lean methodology
- Overall (STATE)
- 87 Strongly Landlord-Friendly
- State Texas
- 87 Strongly Landlord-Friendly · R+5
- County
- — inherits STATE
- City
- — inherits STATE
ZIP-level market 77651
- Active inventory
- 96
- Price-to-rent
- 10.1×
Monthly cashflow live
- Estimated rent
- $1,894 medium interval (Pro) →
- Mortgage (P&I)
- −$1,206
- Tax from tax record
- −$522 /mo · $6,260/yr
- Insurance
- −$96
- Flood insurance flood zone
- −$66 /mo · $798/yr
- HOA
- −$0
- Vacancy / Maint / Mgmt
- −$398
- Net cashflow
- $-393
Break-even live
Sensitivity live
| Price | -10% $-263 | -5% $-328 | +0% $-393 | +5% $-458 | +10% $-524 |
|---|---|---|---|---|---|
| Rent | -10% $-543 | -5% $-468 | +0% $-393 | +5% $-319 | +10% $-244 |
| Rate | -1.0pp $-278 | -0.5pp $-335 | base $-393 | +0.5pp $-453 | +1.0pp $-514 |
UW: 25.0% down · 7.5% · 30yr · 1.5% tax · 5.0% vac · 8.0% maint · 8.0% mgmt
Financing live
Cash to close
- Down payment
- $57,475
- Closing costs
- $6,897
- Reserves months
- —
- Total cash needed
- —
Loan-product check · same deal, 3 products live
Conventional
25% down · 7.5% · 30yr
- Down + closing
- —
- Monthly P&I
- —
- Monthly cashflow
- —
- DSCR
- —
- Eligible?
- —
Personal DTI + credit; lowest rate.
DSCR
20% down · 8.5% · 30yr
- Down + closing
- —
- Monthly P&I
- —
- Monthly cashflow
- —
- DSCR
- —
- Eligible?
- —
No personal income docs; deal must DSCR.
Hard money
10% down · 12.0% · 12mo
- Down + closing
- —
- Monthly P&I
- —
- Monthly cashflow
- —
- DSCR
- —
- Eligible?
- —
Short-term bridge; refi at stabilization.
Rent comps 3 comps
| Address | Beds | Baths | Sqft | Rent | $/sqft | DOM | Units | Dist |
|---|---|---|---|---|---|---|---|---|
| 3148 Sandalwood Dr Port Neches, TX | 3.0 | 2.0 | 1724 | $2,100 | $1.22 | 23d | 1 | 0.50mi |
| 304 Avenue E Nederland, TX | 3.0 | 2.0 | 1511 | $1,900 | $1.26 | 15d | 1 | 1.25mi |
| 1107 S 16th St Unit 1 Nederland, TX | 2.0 | 1.0 | 1395 | $1,250 | $0.90 | 15d | 1 | 1.38mi |
Listing history 25 events
-
2026-06-21days on market $229,900 Active 96 DOM
-
2026-06-18days on market $229,900 Active 93 DOM
-
2026-06-17days on market $229,900 Active 92 DOM
-
2026-06-16days on market $229,900 Active 91 DOM
-
2026-06-15days on market $229,900 Active 90 DOM
-
2026-06-14pricedays on market $229,900 Active 88 DOM
-
2026-06-10days on market $249,000 Active 85 DOM
-
2026-06-09days on market $249,000 Active 84 DOM
-
2026-06-08days on market $249,000 Active 83 DOM
-
2026-06-07days on market $249,000 Active 82 DOM
-
2026-06-03days on market $249,000 Active 78 DOM
-
2026-06-02days on market $249,000 Active 77 DOM
-
2026-06-01days on market $249,000 Active 76 DOM
-
2026-05-31days on market $249,000 Active 75 DOM
-
2026-05-30days on market $249,000 Active 74 DOM
-
2026-03-17$249,000 Active 411-char remark
Show marketing remark (411 chars)
Lovely old country home on large lot in Port Neches with Port Neches/Groves Schools. Floor plan has open concept with separate bedroom floor plan, breakfast area, breakfast bar, refrigerator, gas stove, dishwasher stay with home, covered front porch & wood deck in the back with privacy fenced back lawn & storage shed. Home is Handicap Accessible on front porch, back deck & also Master bath.
-
2023-05-13historical
-
2023-04-13status Pending
-
2023-01-31$195,000 Active
-
2022-11-14soldstatus
-
2022-03-24soldstatus
-
2019-11-26soldstatus
-
2019-11-26soldstatus
-
2019-01-02$154,900
-
2015-09-23soldstatus
ⓘ Source: listings_history table (triggers on properties + properties_extension) + one-shot
backfill from property_details.listing_events for pre-trigger history.
Tax reassessment forecast TX · Resets to sale price
- Current annual tax
- $6,260 · $522/mo
- Projected year-2 tax
- $6,260 · $522/mo
- Expected delta
- $0/yr ($0/mo · 0.0%)
ⓘ Screening estimate from a state-policy table — verify with the county assessor before closing.
Climate risk First Street
- Flood 7/10 Severe FEMA zone X · 74% chance over 30 yrs
- Wildfire 1/10 Low
- Heat 9/10 Extreme 7 d/yr ≥110°F today · 24 d/yr by 30 yrs out
- Wind 9/10 Extreme 99% chance of damaging wind over 30 yrs
- Air quality 2/10 Low 1 unhealthy d/yr today · 1 by 30 yrs out
Nearby sold comps map
Loading sold comps map…
Walkable amenities ~0.75 mi
Loading nearby amenities…
Taxation est. · year 1
- Rental income
- $22,726
- − Mortgage interest
- −$12,878
- − Property taxes
- −$6,260
- − Insurance
- −$1,947
- − Repairs & maintenance
- −$1,818
- − Management
- −$1,818
- − Depreciation
- −$6,688
- Taxable loss
- −$8,683
- Est. tax savings @ 24.0%
- +$2,084
- After-tax cash flow
- $-2,637/yr
For passive investors: Depreciation is non-cash, so a rental often shows a tax loss while cash-flowing — sheltering income. Rental losses are passive: they offset passive income freely, and up to $25,000/yr can offset ordinary (W-2) income if you actively participate and your MAGI is under $100k (phasing out to $0 by $150k); unused losses carry forward. On sale, claimed depreciation is recaptured at up to 25%, and gains may owe capital-gains tax (a 1031 exchange can defer both). Figures are a year-1 estimate at your 24.0% rate — not tax advice; consult a CPA.
Schools (NCES district)
- District
- Port Neches-Groves ISD
- NCES district ID
- 4835430
- Math proficiency
- 42% ▼ -13.00%
- Reading proficiency
- 47% ▼ -5.00%
- Median HH income
- $54,661
- Composite
- 38.65/100
- National rank
- #4152
- State rank
- #260 of 826 in TX
Livability — Port Neches
- Score
- 75/100
- State rank
- #139
- US rank
- #3996
Category grades
Schools grade is shown separately in the Schools card above.
Census & demographics
- Census place
- Port Neches, TX
- Population (ZIP)
- 13,627
Population outlook (Jefferson County) Hauer SSP2
- Today (2025)
- 259,015 people
- By 2030
- 260,685 · +0.6%
- By 2040
- 263,309 · +1.7%
- By 2050
- 265,237 · +2.4%
- By 2075
- 270,193 · +4.3%
- By 2100
- 255,628 · -1.3%
Race, ethnicity, and origin ACS 2023
- Neighborhood character
- Predominantly White (84%)
- Race & ethnicity
- White 84% Hispanic / Latino 9% Two or more races 9% Asian 2%
- Hispanic origin (detail)
- Mexican 8%
- Common ancestry
- Lithuanian 15% Romanian 2% Italian 1%
- Foreign-born
- 5% · Canada
- Languages at home
- 92% English-only · Spanish 4% Vietnamese 2% Other Indo-European 1%
Political lean MEDSL · Jefferson
- 2024 margin
- Lean R (+8.9) · D 45.1% · R 54.0%
- 2008→2024 swing
- -11.1pp toward R · 2008: 2.2pp · 2024: -8.9pp
- All cycles
- 2024: R+8.9 2020: R+1.6 2016: R+0.5 2012: D+1.6 2008: D+2.2
Not yet ingested
- Civics
- —
Market trends
- HPI YoY
- ▼ -187.68%
- Current HPI
- 186.228
- Rent YoY
- —
- Metro
- —
- State GDP YoY
- ▲ 3.95%
- F500 in state
- 110
Industry mix (Fortune 500 HQ in TX)
| Industry | F500 HQs | Revenue |
|---|---|---|
| Energy | 16 | $1,198B |
|
||
| Technology | 5 | $198B |
|
||
| Engineering / Construction | 4 | $72B |
|
||
| Energy Services | 3 | $60B |
|
||
| Utilities | 3 | $41B |
|
||
| Healthcare | 2 | $330B |
|
||
Price history
+60.7% since first listed10 events — show timeline
- 2026-03-17 Listed $249,000 BBOR
- 2023-05-13 Delisted — BBOR
- 2023-04-13 Pending — BBOR
- 2023-01-31 Listed $195,000 BBOR
- 2022-11-14 Sold (Public Records) — Public Records
- 2022-03-24 Sold (Public Records) — Public Records
- 2019-11-26 Sold (Public Records) — Public Records
- 2019-11-26 Sold (MLS) — PNPANBOR
- 2019-01-02 Listed $154,900 PNPANBOR
- 2015-09-23 Sold (Public Records) — Public Records
Property tax history
+5.2%/yrLatest (2025): $6,260 · +13.7% YoY. Source: county tax records.
Cash-flow waterfall
monthlySold comps — $/sqft
last 12 mo · ≤1 miLoading sold comps…