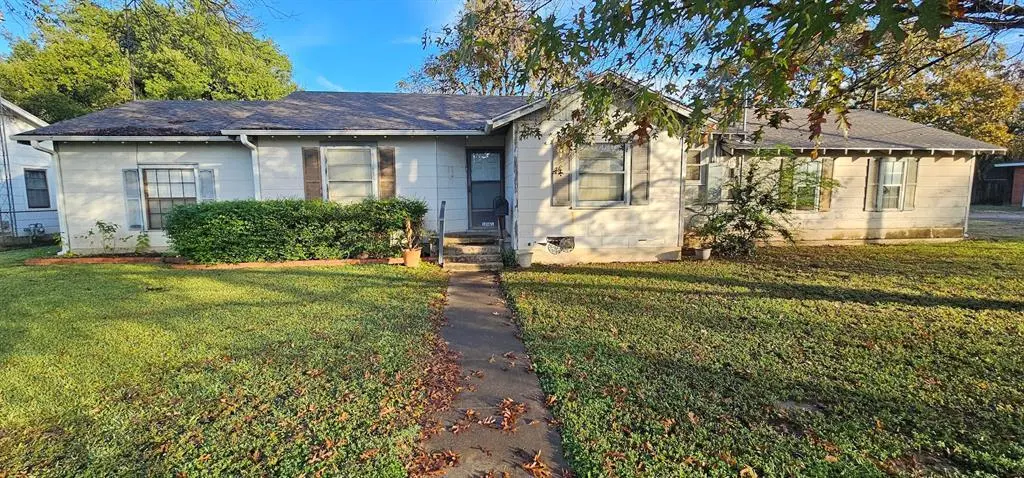
1061 E Walnut St · Hillsboro, TX
Flood risk 1/10 · Minimal
- FEMA flood zone
- X (unshaded)
- Chance of flooding over 30 yrs
- 0.0%
- Est. flood insurance / yr
- $507 – $1,088
Fire risk 4/10 · Minor
- Est. fire insurance / yr
- $1,222 – $2,270
Heat risk 7/10 · Major
- Hot days now (above 108°F)
- 7 days/yr
- Hot days in 30 yrs
- 23 days/yr
Wind risk 6/10 · Moderate
- Chance of severe wind over 30 yrs
- 27.0%
Air-quality risk 2/10 · Minimal
- Unhealthy air days now
- 1 days/yr
- Unhealthy air days in 30 yrs
- 1 days/yr
Risk factors via First Street. Map © Google.
Why this score? — see what drove the B- grade
The composite is a weighted blend of 9 inputs, each scored 0–100. Each bar is that input's sub-score; the figure is the points it added to the 100-point composite (weight × sub-score).
- Cash flow +24.7/30.0
- ARV discount +15.0/15.0
- DSCR +8.0/10.0
- 1% rule +6.3/10.0
- Schools +3.5/10.0
- Livability +3.2/5.0
- Rent growth +2.5/5.0
- Condition / age +2.5/5.0
- Appreciation +0.0/10.0
$130,000
🖨 Deal sheet (PDF) 📄 Offer letter ✓ Due diligence
Listing remarks MLS
This 2 bedroom 1 bath home is situated on a corner lot in a well-established neighborhood. Features include 2 living areas, updated shower enclosure with sliding doors, updated wood laminate flooring in living areas, kitchen, and bathroom, original wood floors in bedrooms, and roof replaced 2018. Additional highlights include built in bar in dining area, built in cabinets in den, fenced backyard, separate laundry room, gas range, one mini split, and fireplace. The attached 2 car garage offers plenty of storage and a spacious workshop area, with a separate entrance to backyard. The den could easily be converted into an additional bedroom. Full of character and charm, this must-see property offers the perfect opportunity to personalize your ideal home!
Key facts
- Corner lot
- 7,318 sq ft lot
- 2 garage spots
Tags
Neighborhood map
What this means for you Summary
Snapshot
- This is a 2-bed/2.0-bath single-family listed at $130k.
Deal economics
- At list price, monthly cash flow is $271 ($3k/yr) — positive.
- The deal already cash-flows at list — no discount required.
- Meets the 1% rule at list price ($1k rent vs $130k).
- Recommended offer: $114k (12.0% below list) — sets the bar for market timing.
- Cap rate 8.8% vs local median 3.6% in Hillsboro — top-decile yield for the area; either an underpriced asset or a hidden risk that comps aren't pricing in. Stress-test before assuming the spread holds.
Location & tenants
- Location reads 64/100 on livability (#803 in TX) — a middle-class / working-renter tenant base. Strengths: cost of living A+, housing A+, crime B+; Watch: amenities F, commute F, employment D-.
- Hillsboro ISD (town): math 46% / reading 39% proficiency, ranked #370 of 826 in TX (top 45%) — families likely to look elsewhere, expect single-tenant / working-renter base with shorter leases; 71% free/reduced lunch — lower-income household profile, screen leases tightly.
- Zoned schools: Hillsboro Int (math 43% / reading 35%, grade F, #690 of 1,662 statewide, top 42%, 429 students, 81% FRL); Hillsboro J H (math 47% / reading 40%, grade D, #530 of 1,662 statewide, top 32%, 272 students, 72% FRL); Hillsboro H S (math 52% / reading 47%, grade D, #509 of 1,632 statewide, top 34%, 604 students, 78% FRL).
- Market conditions: 158 active listings in the ZIP; 3 comparable units currently listed for rent nearby; rentals lingering (median 45d on market — plan ~5-8 weeks vacancy on turnover, expect pricing pressure); 67% of comp listings sitting > 30 days — soft ceiling on asking rent; 65 units permitted in Hill County in 2024 (0 in 5+ unit buildings).
Forward outlook
- Local home prices are declining (-3.0%/yr); year-one equity from $899 of loan paydown is wiped out by about $4k of value loss. Plan a longer hold.
- Hill County population projected at -12% by 2050 — secular population decline; favor cash flow + early exit over multi-decade hold.
Negotiation context
- It's been on market 196 days — a 12% lower offer ($114k) is reasonable based on typical stale-listing flexibility.
Risks & watch-outs
- Climate carrying-cost: major wind risk, 27% chance of damaging wind over 30y; extreme-heat days projected 7→23/yr by 2055 (HVAC capex compounding) — expect insurance premiums to compound above CPI over the hold.
Questions for the listing agent
- It's been on market 196 days. Have you received any prior offers? Is the seller open to a 12% concession, seller financing, or rate buy-down credit?
- Built in 1969 — when were the roof, HVAC, electrical panel, plumbing, and water heater last replaced?
- Why hasn't it sold? Are there any deal-killer items the seller is aware of (foundation, flood, title, zoning, code violations)?
- Is there a deadline driving the sale (1031 exchange, divorce, estate, relocation)? That informs how much negotiation room exists.
- Schools are F-rated, which usually means shorter tenancies and higher turnover. Who's the typical renter profile here, and what's been the actual vacancy rate?
- What's the average days-on-market for RENTAL listings here right now (not sales)? A rising rental-DOM trend means longer vacancies and softer asking-rent achievability than the comps imply.
- What's the recent tenant-quality profile in this submarket — average credit score on applications, eviction rate, late-payment / NSF rate, and stable-employment percentage? A property-management company in the area should have these aggregated.
- How much new for-sale + rental construction is in the pipeline within 1–3 miles? Heavy new supply typically softens prices + rents 12–24 months out; constrained supply supports both.
Investment metrics
- 1% rule
- 1.13% ✓
- Cap rate
- 8.79%
- Cash-on-cash
- 8.94%
- DSCR
- 1.40
- GRM
- 7.4
CMA / ARV
- ARV (median comp)
- $176,808
- List price
- $130,000
- Delta
- -26.47%
- Verdict
- UNDERPRICED
- Comps
- 20 within 1.0 mi
Show comp detail 12 sales within ~0.75 mi
| Address | Dist | Beds/Ba | Sqft | Sold | Price | $/sf | Match |
|---|---|---|---|---|---|---|---|
| 1020 Park Dr | 0.15mi | 2/1.0 | 1,290 (-0%) | 11mo | $168,000 | $130 | 79 |
| 1016 E Elm St | 0.19mi | 2/1.5 | 1,368 (+6%) | 12mo | $190,000 | $139 | 69 |
| 1019 E Walnut St | 0.14mi | 3/2.0 (+1) | 1,486 (+15%) | 1mo | $251,750 | $169 | 63 |
| 1050 E Walnut St | 0.08mi | 2/2.0 | 1,480 (+14%) | 13mo | $170,000 | $115 | 62 |
| 812 E Walnut St | 0.50mi | 3/2.0 (+1) | 1,274 (-2%) | 9mo | $185,000 | $145 | 61 |
| 1027 Park Dr | 0.12mi | 2/1.0 | 1,456 (+12%) | 11mo | $215,000 | $148 | 61 |
| 913 E Elm St | 0.40mi | 3/2.0 (+1) | 1,232 (-5%) | 12mo | $264,900 | $215 | 58 |
| 700 Park Dr | 0.64mi | 3/2.0 (+1) | 1,350 (+4%) | 8mo | $269,999 | $200 | 52 |
| 75 Delmore Dr | 0.66mi | 3/2.0 (+1) | 1,341 (+4%) | 11mo | $269,000 | $201 | 50 |
| 713 E Franklin St | 0.63mi | 2/1.0 | 1,160 (-10%) | 2mo | $180,000 | $155 | 47 |
| 705 E Elm St | 0.64mi | 2/2.0 | 1,489 (+15%) | 10mo | $80,000 | $54 | 37 |
| 424 Stoneridge Dr | 0.68mi | 3/2.0 (+1) | 1,456 (+12%) | 8mo | $255,000 | $175 | 36 |
Match score weights: distance 35% · size 25% · config 20% · recency 20%. Top-matched comps best support the ARV.
Projected returns pro-forma
-3.0% appreciation · 3.0% rent growth · sell at horizon
- IRR
- -2.8%
- Equity multiple
- 0.90×
- Total profit
- $-3,785
- Equity at exit
- $19,383
- IRR
- 6.9%
- Equity multiple
- 1.52×
- Total profit
- $19,004
- Equity at exit
- $11,240
Cash invested: $36,400 (down + closing). Projections, not guarantees.
Landlord ↔ Tenant lean methodology
- Overall (STATE)
- 87 Strongly Landlord-Friendly
- State Texas
- 87 Strongly Landlord-Friendly · R+5
- County
- — inherits STATE
- City
- — inherits STATE
ZIP-level market 76645
- Home prices YoY
- -33.5%
- Active inventory
- 158
- Price-to-rent
- 7.4×
Monthly cashflow live
- Estimated rent
- $1,470 medium interval (Pro) →
- Mortgage (P&I)
- −$682
- Tax from tax record
- −$155 /mo · $1,854/yr
- Insurance
- −$54
- HOA
- −$0
- Vacancy / Maint / Mgmt
- −$309
- Net cashflow
- $271
Break-even live
Sensitivity live
| Price | -10% $345 | -5% $308 | +0% $271 | +5% $234 | +10% $197 |
|---|---|---|---|---|---|
| Rent | -10% $155 | -5% $213 | +0% $271 | +5% $329 | +10% $387 |
| Rate | -1.0pp $337 | -0.5pp $304 | base $271 | +0.5pp $237 | +1.0pp $203 |
UW: 25.0% down · 7.5% · 30yr · 1.5% tax · 5.0% vac · 8.0% maint · 8.0% mgmt
Financing live
Cash to close
- Down payment
- $32,500
- Closing costs
- $3,900
- Reserves months
- —
- Total cash needed
- —
Loan-product check · same deal, 3 products live
Conventional
25% down · 7.5% · 30yr
- Down + closing
- —
- Monthly P&I
- —
- Monthly cashflow
- —
- DSCR
- —
- Eligible?
- —
Personal DTI + credit; lowest rate.
DSCR
20% down · 8.5% · 30yr
- Down + closing
- —
- Monthly P&I
- —
- Monthly cashflow
- —
- DSCR
- —
- Eligible?
- —
No personal income docs; deal must DSCR.
Hard money
10% down · 12.0% · 12mo
- Down + closing
- —
- Monthly P&I
- —
- Monthly cashflow
- —
- DSCR
- —
- Eligible?
- —
Short-term bridge; refi at stabilization.
Rent comps 3 comps
| Address | Beds | Baths | Sqft | Rent | $/sqft | DOM | Units | Dist |
|---|---|---|---|---|---|---|---|---|
| 411 Bond St Hillsboro, TX | 2.0 | 1.0 | 1342 | $1,300 | $0.97 | 22d | 1 | 0.58mi |
| 216 Brazos St Hillsboro, TX | 3.0 | 2.0 | 1266 | $2,200 | $1.74 | 45d | 1 | 1.21mi |
| 208 N Church St Hillsboro, TX | 2.0 | 1.0–1.5 | 875 | $865 | $0.99 | 45d | 2 | 1.33mi |
Listing history 14 events
-
2026-06-10statusdays on market $130,000 Pending 196 DOM
-
2026-06-08days on market $130,000 Active Option Contract 195 DOM
-
2026-06-08days on market $130,000 Active Option Contract 194 DOM
-
2026-06-07statusdays on market $130,000 Active Option Contract 193 DOM
-
2026-06-03days on market $130,000 Active 190 DOM
-
2026-06-02days on market $130,000 Active 189 DOM
-
2026-06-02price $130,000 Active 188 DOM
-
2026-06-01days on market $135,000 Active 188 DOM
-
2026-05-31days on market $135,000 Active 187 DOM
-
2026-05-09price $135,000 771-char remark
Show marketing remark (771 chars)
This 2 bedroom 1 bath home is situated on a corner lot in a well-established neighborhood. Features include 2 living areas, updated shower enclosure with sliding doors, updated wood laminate flooring in living areas, kitchen, and bathroom, original wood floors in bedrooms, and roof replaced 2018. Additional highlights include built in bar in dining area, built in cabinets in den, fenced backyard, separate laundry room, gas range, one mini split, and fireplace. The attached 2 car garage offers plenty of storage and a spacious workshop area, with a separate entrance to backyard. The den could easily be converted into an additional bedroom. Full of character and charm, this must-see property offers the perfect opportunity to personalize your ideal home!
-
2026-03-03price $140,000 771-char remark
Show marketing remark (771 chars)
This 2 bedroom 1 bath home is situated on a corner lot in a well-established neighborhood. Features include 2 living areas, updated shower enclosure with sliding doors, updated wood laminate flooring in living areas, kitchen, and bathroom, original wood floors in bedrooms, and roof replaced 2018. Additional highlights include built in bar in dining area, built in cabinets in den, fenced backyard, separate laundry room, gas range, one mini split, and fireplace. The attached 2 car garage offers plenty of storage and a spacious workshop area, with a separate entrance to backyard. The den could easily be converted into an additional bedroom. Full of character and charm, this must-see property offers the perfect opportunity to personalize your ideal home!
-
2026-02-06price $145,000 771-char remark
Show marketing remark (771 chars)
This 2 bedroom 1 bath home is situated on a corner lot in a well-established neighborhood. Features include 2 living areas, updated shower enclosure with sliding doors, updated wood laminate flooring in living areas, kitchen, and bathroom, original wood floors in bedrooms, and roof replaced 2018. Additional highlights include built in bar in dining area, built in cabinets in den, fenced backyard, separate laundry room, gas range, one mini split, and fireplace. The attached 2 car garage offers plenty of storage and a spacious workshop area, with a separate entrance to backyard. The den could easily be converted into an additional bedroom. Full of character and charm, this must-see property offers the perfect opportunity to personalize your ideal home!
-
2025-11-24$150,000 Active 771-char remark
Show marketing remark (771 chars)
This 2 bedroom 1 bath home is situated on a corner lot in a well-established neighborhood. Features include 2 living areas, updated shower enclosure with sliding doors, updated wood laminate flooring in living areas, kitchen, and bathroom, original wood floors in bedrooms, and roof replaced 2018. Additional highlights include built in bar in dining area, built in cabinets in den, fenced backyard, separate laundry room, gas range, one mini split, and fireplace. The attached 2 car garage offers plenty of storage and a spacious workshop area, with a separate entrance to backyard. The den could easily be converted into an additional bedroom. Full of character and charm, this must-see property offers the perfect opportunity to personalize your ideal home!
-
2000-01-03soldstatus
ⓘ Source: listings_history table (triggers on properties + properties_extension) + one-shot
backfill from property_details.listing_events for pre-trigger history.
Tax reassessment forecast TX · Resets to sale price
- Current annual tax
- $1,854 · $155/mo
- Projected year-2 tax
- $2,379 · $198/mo
- Expected delta
- +$525/yr (+$44/mo · 28.3%)
ⓘ Screening estimate from a state-policy table — verify with the county assessor before closing.
Climate risk First Street
- Flood 1/10 Low FEMA zone X (unshaded) · 0% chance over 30 yrs
- Wildfire 4/10 Moderate
- Heat 7/10 Severe 7 d/yr ≥108°F today · 23 d/yr by 30 yrs out
- Wind 6/10 Major 27% chance of damaging wind over 30 yrs
- Air quality 2/10 Low 1 unhealthy d/yr today · 1 by 30 yrs out
Nearby sold comps map
Loading sold comps map…
Walkable amenities ~0.75 mi
Loading nearby amenities…
Taxation est. · year 1
- Rental income
- $17,643
- − Mortgage interest
- −$7,282
- − Property taxes
- −$1,854
- − Insurance
- −$650
- − Repairs & maintenance
- −$1,411
- − Management
- −$1,411
- − Depreciation
- −$3,782
- Taxable income
- $1,252
- Est. tax owed @ 24.0%
- −$300
- After-tax cash flow
- $2,952/yr
For passive investors: Depreciation is non-cash, so a rental often shows a tax loss while cash-flowing — sheltering income. Rental losses are passive: they offset passive income freely, and up to $25,000/yr can offset ordinary (W-2) income if you actively participate and your MAGI is under $100k (phasing out to $0 by $150k); unused losses carry forward. On sale, claimed depreciation is recaptured at up to 25%, and gains may owe capital-gains tax (a 1031 exchange can defer both). Figures are a year-1 estimate at your 24.0% rate — not tax advice; consult a CPA.
Schools (NCES district)
- District
- Hillsboro ISD
- NCES district ID
- 4823280
- Math proficiency
- 46% ▲ 4.00%
- Reading proficiency
- 39% ▲ 2.00%
- Median HH income
- $34,483
- Composite
- 35.12/100
- National rank
- #5016
- State rank
- #370 of 826 in TX
Livability — Hillsboro
- Score
- 64/100
- State rank
- #803
- US rank
- #14657
Category grades
Schools grade is shown separately in the Schools card above.
Census & demographics
- Census place
- Hillsboro, TX
- City population
- 11,321
- Population (ZIP)
- 11,321
Population outlook (Hill County) Hauer SSP2
- Today (2025)
- 34,013 people
- By 2030
- 33,289 · -2.1%
- By 2040
- 31,688 · -6.8%
- By 2050
- 30,100 · -11.5%
- By 2075
- 26,818 · -21.2%
- By 2100
- 22,918 · -32.6%
Race, ethnicity, and origin ACS 2023
- Neighborhood character
- Diverse neighborhood (Simpson 0.60)
- Race & ethnicity
- White 52% Hispanic / Latino 34% Black 10% Two or more races 8% Native American 1%
- Hispanic origin (detail)
- Mexican 32%
- Common ancestry
- Slovak 1% Lithuanian 1% Serbian 1%
- Foreign-born
- 11% · Canada
- Languages at home
- 73% English-only · Spanish 26%
Political lean MEDSL · Hill
- 2024 margin
- Solid R (+64.4) · D 17.5% · R 81.8%
- 2008→2024 swing
- -23.0pp toward R · 2008: -41.4pp · 2024: -64.4pp
- All cycles
- 2024: R+64.4 2020: R+60.7 2016: R+58.4 2012: R+53.0 2008: R+41.4
Not yet ingested
- Civics
- —
Market trends
- HPI YoY
- ▼ -124.83%
- Current HPI
- 248.3182
- Rent YoY
- —
- Metro
- —
- State GDP YoY
- ▲ 3.95%
- F500 in state
- 110
Industry mix (Fortune 500 HQ in TX)
| Industry | F500 HQs | Revenue |
|---|---|---|
| Energy | 16 | $1,198B |
|
||
| Technology | 5 | $198B |
|
||
| Engineering / Construction | 4 | $72B |
|
||
| Energy Services | 3 | $60B |
|
||
| Utilities | 3 | $41B |
|
||
| Healthcare | 2 | $330B |
|
||
Price history
-10.0% since first listed5 events — show timeline
- 2026-05-09 Price Changed $135,000 NTREIS
- 2026-03-03 Price Changed $140,000 NTREIS
- 2026-02-06 Price Changed $145,000 NTREIS
- 2025-11-24 Listed $150,000 NTREIS
- 2000-01-03 Sold (Public Records) — Public Records
Property tax history
+4.8%/yrLatest (2025): $1,854 · +13.8% YoY. Source: county tax records.
Cash-flow waterfall
monthlySold comps — $/sqft
last 12 mo · ≤1 miLoading sold comps…