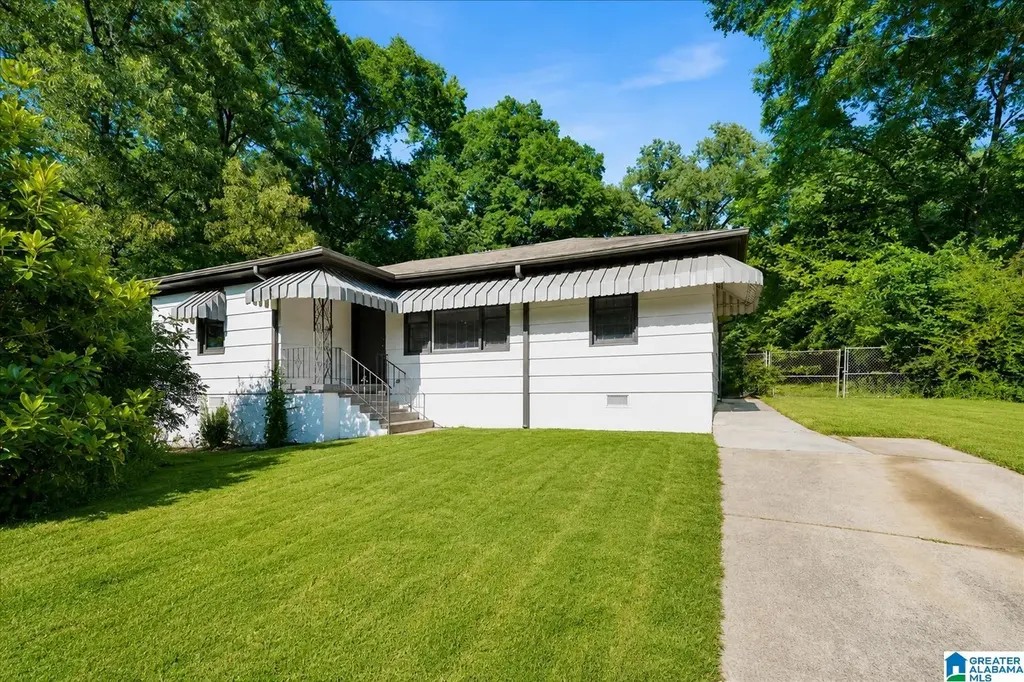
1521 Heron Dr · Forestdale, AL
Flood risk 1/10 · Minimal
- FEMA flood zone
- X (unshaded)
- Chance of flooding over 30 yrs
- 0.0%
- Est. flood insurance / yr
- $507 – $1,088
Fire risk 4/10 · Minor
- Est. fire insurance / yr
- $916 – $1,700
Heat risk 6/10 · Moderate
- Hot days now (above 107°F)
- 7 days/yr
- Hot days in 30 yrs
- 19 days/yr
Wind risk 6/10 · Moderate
- Chance of severe wind over 30 yrs
- 27.0%
Air-quality risk 4/10 · Minor
- Unhealthy air days now
- 4 days/yr
- Unhealthy air days in 30 yrs
- 8 days/yr
Risk factors via First Street. Map © Google.
Why this score? — see what drove the C- grade
The composite is a weighted blend of 9 inputs, each scored 0–100. Each bar is that input's sub-score; the figure is the points it added to the 100-point composite (weight × sub-score).
- Cash flow +19.2/30.0
- ARV discount +12.5/15.0
- DSCR +6.1/10.0
- 1% rule +4.4/10.0
- Livability +2.9/5.0
- Rent growth +2.7/5.0
- Condition / age +2.5/5.0
- Schools +1.8/10.0
- Appreciation +0.0/10.0
$140,000
🖨 Deal sheet 📄 Offer letter ✓ Due diligence
Listing remarks
1521 Heron Drive offers the space and layout buyers are looking for with 4 bedrooms and 2 full baths. Inside, the neutral paint colors give the home a clean, updated feel that works with any style. The living areas flow easily for everyday living, whether you are hosting family, helping with homework at the kitchen table, or relaxing at the end of the day. Step outside to a flat backyard with an open patio that is ready for cookouts, pets, or a play area. The yard offers plenty of usable space without a lot of maintenance. Conveniently located in Forestdale, this home is move-in ready and designed for practical, comfortable living.
Key facts
- Move-in ready
- Open patio
- Flat backyard
Tags
Property features AI
Finance
- Other: Lot size approximately 0.77 acres; Property not in a flood plain; Open deck type: open
- Financial info: Down payment assistance available
Exterior
- Parking: Driveway parking; On-street parking
- Utilities: Public water; Septic system; Gas water heater; Internet service available
- Home design: Existing property; Single-story rooms listed (main level throughout); Siding (wood)
- Construction: Wood siding construction; Crawl space foundation
- Exterior features: Open deck; No pool; No patio; No garden/patio area; Not waterfront
Interior
- Kitchen: Dishwasher (built-in); Electric oven; Electric stove; Solid surface countertops
- Bedrooms: Master bedroom on main level; Additional bedrooms on main level
- Flooring: Hardwood laminate
- Bathrooms: Two full bathrooms; Separate shower and tub/shower combo options
- Heating & cooling: Central heating (gas); Central electric cooling
- Interior features: Smooth ceilings; Hardwood laminate floors; Solid surface kitchen countertops; Attic with pull-down access; No special interior features listed
- Laundry & utility: Laundry on main level; Washer hookup; Electric dryer hookup
Neighborhood map
What this means for you Summary
Snapshot
- This is a 3-bed/1.0-bath single-family listed at $140k.
Deal economics
- At list price, monthly cash flow is $151 ($2k/yr) — positive.
- The deal already cash-flows at list — no discount required.
- To meet the 1% rule (rent ≥ 1% of price), the offer needs to be $131k (6.3% below list).
- Recommended offer: $131k (6.3% below list) — sets the bar for 1% rule.
Location & tenants
- Location reads 58/100 on livability (#367 in AL) — a working-class tenant base; expect higher turnover. Strengths: cost of living A+, housing A+; Watch: employment D+, amenities F, commute F.
- Jefferson County (suburban): math 9% / reading 32% proficiency, ranked #104 of 129 in AL (top 81%) — low school quality limits family demand, transient renter base, plan for 1-2y turnover.
- Zoned schools: Minor High School (math 4% / reading 8%, grade F, #275 of 305 statewide, top 90%, 915 students, 84% FRL) — zoned schools average 84% FRL vs 49% district-wide (35 pts higher); higher-poverty schools than district average — tighter screening recommended.
- Zoned-school proficiency averages 6% at this address vs 20% district-wide (-15 pts) — the specific schools serving this property underperform the Jefferson County average; the district grade overstates school quality for this exact location.
- Market conditions: Rents flat; 116 active listings in the ZIP; 13 comparable units currently listed for rent nearby; rentals at typical pace (median 19d on market — plan ~3-4 weeks tenant-placement turnaround); 2,114 units permitted in Jefferson County in 2024 (556 in 5+ unit buildings).
Forward outlook
- Local home prices are declining (-3.0%/yr); year-one equity from $968 of loan paydown is wiped out by about $4k of value loss. Plan a longer hold.
- Jefferson County population projected to shrink 4% by 2050 — rents likely to lag national; underwrite the cash flow, not the appreciation.
Negotiation context
- It's been on market 34 days — a 3% lower offer ($136k) is reasonable based on typical stale-listing flexibility.
- 5 sale attempts since 3y ago with the ask held roughly flat each time — persistent listings suggest the price (not the market) is what's stuck; bring a comps-based counter.
- Current owner paid $47k; list at $140k implies a 198% gain — meaningful room to come down on a strong offer.
Risks & watch-outs
- Watch-outs: built in 1955 — expect roof / HVAC / electrical / plumbing capex.
- Climate carrying-cost: major wind risk, 27% chance of damaging wind over 30y; extreme-heat days projected 7→19/yr by 2055 (HVAC capex compounding) — expect insurance premiums to compound above CPI over the hold.
Questions for the listing agent
- It's been on market 34 days. Have you received any prior offers? Is the seller open to a 6% concession, seller financing, or rate buy-down credit?
- Built in 1955 — when were the roof, HVAC, electrical panel, plumbing, and water heater last replaced?
- Is there a deadline driving the sale (1031 exchange, divorce, estate, relocation)? That informs how much negotiation room exists.
- Schools are D-rated, which usually means shorter tenancies and higher turnover. Who's the typical renter profile here, and what's been the actual vacancy rate?
- What's the average days-on-market for RENTAL listings here right now (not sales)? A rising rental-DOM trend means longer vacancies and softer asking-rent achievability than the comps imply.
- What's the recent tenant-quality profile in this submarket — average credit score on applications, eviction rate, late-payment / NSF rate, and stable-employment percentage? A property-management company in the area should have these aggregated.
- How much new for-sale + rental construction is in the pipeline within 1–3 miles? Heavy new supply typically softens prices + rents 12–24 months out; constrained supply supports both.
Investment metrics
- 1% rule
- 0.94% ✗
- Cap rate
- 7.59%
- Cash-on-cash
- 4.62%
- DSCR
- 1.21
- GRM
- 8.9
CMA / ARV
- ARV (median comp)
- $157,416
- List price
- $140,000
- Delta
- -11.06%
- Verdict
- UNDERPRICED
- Comps
- 20 within 1.0 mi
Show comp detail 12 sales within ~0.75 mi
| Address | Dist | Beds/Ba | Sqft | Sold | Price | $/sf | Match |
|---|---|---|---|---|---|---|---|
| 924 Laverne St | 0.36mi | 3/1.0 | 1,272 (+2%) | 2mo | $40,000 | $31 | 79 |
| 1500 Cherry Ave | 0.41mi | 3/1.0 | 1,144 (-8%) | 4mo | $81,750 | $71 | 64 |
| 1713 Circlewood Dr | 0.44mi | 3/2.0 | 1,344 (+8%) | 2mo | $175,000 | $130 | 61 |
| 783 Heflin Ave E | 0.33mi | 4/2.0 (+1) | 1,320 (+6%) | 10mo | $140,000 | $106 | 58 |
| 1724 Horn Dr | 0.51mi | 3/1.0 | 1,208 (-3%) | 17mo | $65,000 | $54 | 56 |
| 929 Heflin Ave E | 0.15mi | 3/1.0 | 1,080 (-14%) | 20mo | $60,000 | $56 | 54 |
| 1706 Huitt St | 0.54mi | 3/1.0 | 1,216 (-3%) | 21mo | $77,500 | $64 | 52 |
| 913 Keel St | 0.31mi | 3/2.0 | 1,404 (+12%) | 21mo | $157,000 | $112 | 44 |
| 1117 Graham Dr | 0.55mi | 3/1.0 | 1,102 (-12%) | 15mo | $82,000 | $74 | 42 |
| 1737 Horn Dr | 0.53mi | 3/1.5 | 1,400 (+12%) | 18mo | $125,900 | $90 | 38 |
| 1850 Ogden Cir | 0.71mi | 3/2.0 | 1,429 (+14%) | 13mo | $200,000 | $140 | 28 |
| 1212 U W Clemon Dr | 0.71mi | 3/3.0 | 1,402 (+12%) | 16mo | $100,000 | $71 | 26 |
Match score weights: distance 35% · size 25% · config 20% · recency 20%. Top-matched comps best support the ARV.
Projected returns pro-forma
-3.0% appreciation · 0.74% rent growth · sell at horizon
- IRR
- -11.5%
- Equity multiple
- 0.59×
- Total profit
- $-16,020
- Equity at exit
- $20,874
- IRR
- -5.7%
- Equity multiple
- 0.66×
- Total profit
- $-13,136
- Equity at exit
- $12,105
Cash invested: $39,200 (down + closing). Projections, not guarantees.
Landlord ↔ Tenant lean methodology
- Overall (STATE)
- 90 Strongly Landlord-Friendly
- State Alabama
- 90 Strongly Landlord-Friendly · R+15
- County
- — inherits STATE
- City
- — inherits STATE
ZIP-level market 35214
- Home prices YoY
- -20.0%
- Rents YoY
- 0.7%
- Active inventory
- 116
- Price-to-rent
- 8.9×
Monthly cashflow live
- Estimated rent
- $1,312 high interval (Pro) →
- Mortgage (P&I)
- −$734
- Tax from tax record
- −$93 /mo · $1,117/yr
- Insurance
- −$58
- HOA
- −$0
- Vacancy / Maint / Mgmt
- −$276
- Net cashflow
- $151
Break-even live
UW: 25.0% down · 7.5% · 30yr · 1.5% tax · 5.0% vac · 8.0% maint · 8.0% mgmt
Financing live
Cash to close
- Down payment
- $35,000
- Closing costs
- $4,200
- Reserves months
- —
- Total cash needed
- —
Loan-product check · same deal, 3 products live
Conventional
25% down · 7.5% · 30yr
- Down + closing
- —
- Monthly P&I
- —
- Monthly cashflow
- —
- DSCR
- —
- Eligible?
- —
Personal DTI + credit; lowest rate.
DSCR
20% down · 8.5% · 30yr
- Down + closing
- —
- Monthly P&I
- —
- Monthly cashflow
- —
- DSCR
- —
- Eligible?
- —
No personal income docs; deal must DSCR.
Hard money
10% down · 12.0% · 12mo
- Down + closing
- —
- Monthly P&I
- —
- Monthly cashflow
- —
- DSCR
- —
- Eligible?
- —
Short-term bridge; refi at stabilization.
Rent comps 13 comps
| Address | Beds | Baths | Sqft | Rent | $/sqft | DOM | Units | Dist |
|---|---|---|---|---|---|---|---|---|
| 944 Cagle Rd Birmingham, AL | 3.0 | 2.0 | 1174 | $1,425 | $1.21 | 23d | 1 | 0.20mi |
| 1647 Cherry Ave Birmingham, AL | 3.0 | 2.0 | 1079 | $1,150 | $1.07 | 11d | 1 | 0.34mi |
| 1512 Cherry Ave Birmingham, AL | 4.0 | 1.0 | 1146 | $1,200 | $1.05 | 43d | 1 | 0.34mi |
| 779 Heflin Ave E Birmingham, AL | 3.0 | 1.5 | 1052 | $1,100 | $1.05 | 19d | 1 | 0.35mi |
| 1500 Cherry Ave Birmingham, AL | 3.0 | 1.0 | 1144 | $1,225 | $1.07 | 2d | 1 | 0.39mi |
| 939 Brandy Ln Birmingham, AL | 3.0 | 1.0 | 1652 | $1,180 | $0.71 | 43d | 1 | 0.61mi |
| 1533 Choctaw Dr Birmingham, AL | 3.0 | 1.0 | 1241 | $1,175 | $0.95 | 43d | 1 | 0.89mi |
| 1712 Riderwood Trl Birmingham, AL | 3.0 | 1.0 | 1456 | $1,150 | $0.79 | 15d | 1 | 1.08mi |
| 115 Crabapple Ln Birmingham, AL | 1.0–3.0 | 1.0–2.0 | 906 | $1,027 | $1.13 | 11d | 19 | 1.08mi |
| 161 Cindy Ln Birmingham, AL | 3.0 | 2.0 | 1388 | $1,425 | $1.03 | 23d | 1 | 1.12mi |
| 120 Dewberry Ln Birmingham, AL | 3.0 | 2.0 | 1485 | $1,510 | $1.02 | 19d | 1 | 1.22mi |
| 305 Rose Hill Rd Birmingham, AL | 3.0 | 1.5 | 1285 | $1,200 | $0.93 | 10d | 1 | 1.25mi |
| 656 Kenwood Dr Birmingham, AL | 3.0 | 1.0 | 1252 | $1,175 | $0.94 | 15d | 1 | 1.32mi |
Listing history 25 events
-
2026-06-18days on market $140,000 Active 34 DOM
-
2026-06-17status $140,000 Active 33 DOM
-
2026-06-17days on market $140,000 Contingent 33 DOM
-
2026-06-16days on market $140,000 Contingent 32 DOM
-
2026-06-15days on market $140,000 Contingent 31 DOM
-
2026-06-13days on market $140,000 Contingent 29 DOM
-
2026-06-10days on market $140,000 Contingent 26 DOM
-
2026-06-09days on market $140,000 Contingent 25 DOM
-
2026-06-08days on market $140,000 Contingent 24 DOM
-
2026-06-07statusdays on market $140,000 Contingent 23 DOM
-
2026-06-03days on market $140,000 Active 19 DOM
-
2026-06-02days on market $140,000 Active 18 DOM
-
2026-06-01days on market $140,000 Active 17 DOM
-
2026-05-31days on market $140,000 Active 16 DOM
-
2026-05-15$140,000 Active 639-char remark
-
2026-04-04price $143,900
-
2026-03-10price $146,900
-
2023-09-11historical $1,375
-
2023-09-06historical $1,375
-
2023-09-02$1,375
-
2023-08-08historical $1,375
-
2023-07-30$1,375
-
2023-07-29$1,375
-
2020-08-20soldstatus $47,000
-
2007-04-16soldstatus $68,000
ⓘ Source: listings_history table (triggers on properties + properties_extension) + one-shot
backfill from property_details.listing_events for pre-trigger history.
Tax reassessment forecast AL · Resets to sale price
- Current annual tax
- $1,117 · $93/mo
- Projected year-2 tax
- $1,117 · $93/mo
- Expected delta
- $0/yr ($0/mo · 0.0%)
ⓘ Screening estimate from a state-policy table — verify with the county assessor before closing.
Climate risk First Street
- Flood 1/10 Low FEMA zone X (unshaded) · 0% chance over 30 yrs
- Wildfire 4/10 Moderate
- Heat 6/10 Major 7 d/yr ≥107°F today · 19 d/yr by 30 yrs out
- Wind 6/10 Major 27% chance of damaging wind over 30 yrs
- Air quality 4/10 Moderate 4 unhealthy d/yr today · 8 by 30 yrs out
Nearby sold comps map
Loading sold comps map…
Walkable amenities ~0.75 mi
Loading nearby amenities…
Taxation est. · year 1
- Rental income
- $15,745
- − Mortgage interest
- −$7,842
- − Property taxes
- −$1,117
- − Insurance
- −$700
- − Repairs & maintenance
- −$1,260
- − Management
- −$1,260
- − Depreciation
- −$4,073
- Taxable loss
- −$506
- Est. tax savings @ 24.0%
- +$121
- After-tax cash flow
- $1,933/yr
For passive investors: Depreciation is non-cash, so a rental often shows a tax loss while cash-flowing — sheltering income. Rental losses are passive: they offset passive income freely, and up to $25,000/yr can offset ordinary (W-2) income if you actively participate and your MAGI is under $100k (phasing out to $0 by $150k); unused losses carry forward. On sale, claimed depreciation is recaptured at up to 25%, and gains may owe capital-gains tax (a 1031 exchange can defer both). Figures are a year-1 estimate at your 24.0% rate — not tax advice; consult a CPA.
Schools (NCES district)
- District
- Jefferson County
- NCES district ID
- 0101920
- Math proficiency
- 9% ▼ -24.00%
- Reading proficiency
- 32% ▼ -5.00%
- Median HH income
- $51,712
- Composite
- 18.4/100
- National rank
- #8937
- State rank
- #104 of 129 in AL
Livability — Forestdale
- Score
- 58/100
- State rank
- #367
- US rank
- #21236
Category grades
Schools grade is shown separately in the Schools card above.
Census & demographics
- Census place
- Forestdale, AL
- County
- Jefferson County · 527,445 people
- City population
- 17,027
- Metro
- Birmingham-Hoover, AL
- Population (ZIP)
- 17,027
- Household income
- $56,383
- Rent vs Own
- Severe rent burden
- 578.0
Population outlook (Jefferson County) Hauer SSP2
- Today (2025)
- 669,185 people
- By 2030
- 669,694 · +0.1%
- By 2040
- 661,388 · -1.2%
- By 2050
- 643,086 · -3.9%
- By 2075
- 577,267 · -13.7%
- By 2100
- 474,758 · -29.1%
Race, ethnicity, and origin ACS 2023
- Neighborhood character
- Predominantly Black (77%)
- Race & ethnicity
- Black 77% White 18% Two or more races 2%
- Foreign-born
- 1% · Canada
- Languages at home
- 98% English-only · Spanish 2%
Political lean MEDSL · Jefferson
- 2024 margin
- D (+10.4) · D 54.6% · R 44.2% · Other 1.2%
- 2008→2024 swing
- +5.4pp toward D · 2008: 5.1pp · 2024: 10.4pp
- All cycles
- 2024: D+10.4 2020: D+13.2 2016: D+7.2 2012: D+6.0 2008: D+5.1
Not yet ingested
- Civics
- —
Market trends
- HPI YoY
- ▼ -54.48%
- Current HPI
- 218.5233
- Rent YoY
- ▲ 0.74%
- Metro
- Birmingham-Hoover, AL
- State GDP YoY
- ▲ 2.94%
- F500 in state
- 4
Industry mix (Fortune 500 HQ in AL)
| Industry | F500 HQs | Revenue |
|---|---|---|
| Financial Services | 1 | $8B |
|
||
| Healthcare | 1 | $5B |
|
||
Price history
+105.9% since first listed13 events — show timeline
- 2026-06-17 Relisted — Greater Alabama MLS
- 2026-06-04 Contingent — Greater Alabama MLS
- 2026-05-15 Listed $140,000 Greater Alabama MLS
- 2026-04-04 Price Changed $143,900 Greater Alabama MLS
- 2026-03-10 Price Changed $146,900 Greater Alabama MLS
- 2023-09-11 Rental Removed $1,375 APPFOLIO
- 2023-09-06 Rental Removed $1,375 RENT.
- 2023-09-02 Listed for Rent $1,375 RENT.
- 2023-08-08 Rental Removed $1,375 RENT.
- 2023-07-30 Listed for Rent $1,375 APPFOLIO
- 2023-07-29 Listed for Rent $1,375 RENT.
- 2020-08-20 Sold (Public Records) $47,000 Public Records
- 2007-04-16 Sold (Public Records) $68,000 Public Records
Property tax history
+4.5%/yrLatest (2025): $1,117 · +0.0% YoY. Source: county tax records.
Cash-flow waterfall
monthlySold comps — $/sqft
last 12 mo · ≤1 miLoading sold comps…