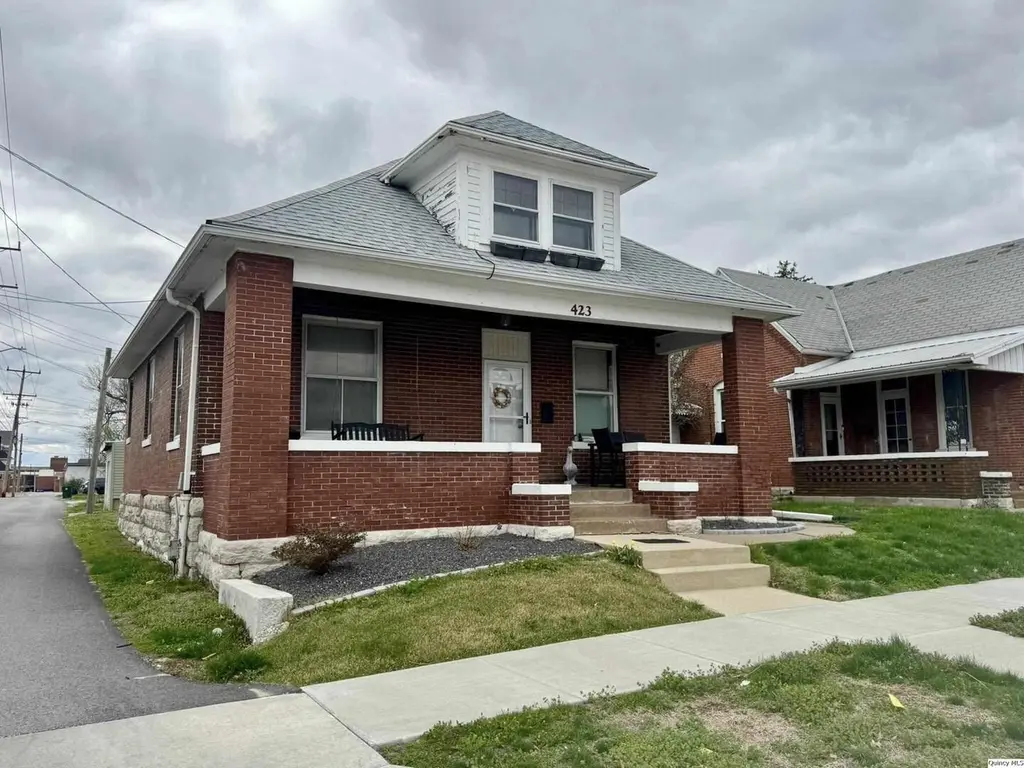
423 N 14th · Quincy, IL
Flood risk 1/10 · Minimal
- FEMA flood zone
- X (unshaded)
- Chance of flooding over 30 yrs
- 0.0%
- Est. flood insurance / yr
- $473 – $860
Fire risk 1/10 · Minimal
- Est. fire insurance / yr
- $804 – $1,492
Heat risk 4/10 · Minor
- Hot days now (above 106°F)
- 7 days/yr
- Hot days in 30 yrs
- 17 days/yr
Wind risk 2/10 · Minimal
- Chance of severe wind over 30 yrs
- —
Air-quality risk 2/10 · Minimal
- Unhealthy air days now
- 1 days/yr
- Unhealthy air days in 30 yrs
- 1 days/yr
Risk factors via First Street. Map © Google.
Why this score? — see what drove the B+ grade
The composite is a weighted blend of 9 inputs, each scored 0–100. Each bar is that input's sub-score; the figure is the points it added to the 100-point composite (weight × sub-score).
- Cash flow +30.0/30.0
- ARV discount +15.0/15.0
- DSCR +10.0/10.0
- 1% rule +8.3/10.0
- Rent growth +5.0/5.0
- Livability +3.4/5.0
- Condition / age +2.5/5.0
- Schools +2.2/10.0
- Appreciation +0.0/10.0
$156,900
🖨 Deal sheet (PDF) 📄 Offer letter ✓ Due diligence
Listing remarks MLS
If it's ample space you desire, this move-in-ready 3 bedroom (with a non-conforming 4th) 2 bath home delivers! On the main level you will find a massive living room, formal dinning room, primary bedroom, and stunning updated bathroom with a beautiful original stained glass window. Walk upstairs to find a 38'x 12' bedroom with its own full bath, or downstairs to find yet another open living area complete with bedroom #3 and office or non-conforming 4th bedroom. There is zero shortage of space and comfort in this 2,600+ sqft of livable space cozy home and is an in-person must see property. Set up your showing today & see for yourself!
Key facts
- Massive living room
- Formal dining room
- Open living area
Tags
Neighborhood map
What this means for you Summary
Snapshot
- This is a 3-bed/2.0-bath single-family listed at $157k.
Deal economics
- At list price, monthly cash flow is $597 ($7k/yr) — positive.
- The deal already cash-flows at list — no discount required.
- Meets the 1% rule at list price ($2k rent vs $157k).
- Recommended offer: $147k (6.0% below list) — sets the bar for market timing.
- Cap rate 10.9% vs local median 4.3% in Quincy — top-decile yield for the area; either an underpriced asset or a hidden risk that comps aren't pricing in. Stress-test before assuming the spread holds.
Location & tenants
- Location reads 67/100 on livability (#506 in IL) — a middle-class / working-renter tenant base. Strengths: cost of living A+, housing A+; Watch: crime D, employment D, amenities D-.
- Quincy SD 172 (town): math 24% / reading 27% proficiency, ranked #328 of 620 in IL (top 53%) — low school quality limits family demand, transient renter base, plan for 1-2y turnover.
- Zoned schools: Colonel George Iles Elem Sch (math 29% / reading 29%, grade F, #727 of 2,056 statewide, top 36%, 519 students, 0% FRL); Quincy Jr High School (math 25% / reading 30%, grade F, #295 of 665 statewide, top 45%, 1,348 students, 0% FRL); Quincy Sr High School (math 21% / reading 28%, grade F, #256 of 693 statewide, top 44%, 1,924 students, 0% FRL) — zoned schools average 0% FRL vs 48% district-wide (48 pts lower); this property's tenant base skews higher-income than the district average.
- Market conditions: Rents rising fast (+10.8%/yr); 184 active listings in the ZIP; 2 comparable units currently listed for rent nearby; 68 units permitted in Adams County in 2024 (0 in 5+ unit buildings).
- At $2,084/mo this rent would consume 48% of the median local household income ($52k/yr) (locally 1238% of renters already pay >50% of income on rent) — very limited rent-growth headroom before tenants either downsize or default.
Forward outlook
- Local home prices are declining (-3.0%/yr); year-one equity from $1k of loan paydown is wiped out by about $5k of value loss. Plan a longer hold.
- Adams County population projected at -14% by 2050 — secular population decline; favor cash flow + early exit over multi-decade hold.
- At projected returns (-3.0% appreciation + 8.0% rent growth), your $44k cash investment doubles in ~6 years — after that, you're playing with house money.
Negotiation context
- It's been on market 77 days — a 6% lower offer ($147k) is reasonable based on typical stale-listing flexibility.
- 5 sale attempts since 10y ago with the ask held roughly flat each time — persistent listings suggest the price (not the market) is what's stuck; bring a comps-based counter.
- Current owner paid $75k; list at $157k implies a 109% gain — meaningful room to come down on a strong offer.
Risks & watch-outs
- Watch-outs: built in 1902 — expect roof / HVAC / electrical / plumbing capex.
Questions for the listing agent
- It's been on market 77 days. Have you received any prior offers? Is the seller open to a 6% concession, seller financing, or rate buy-down credit?
- Built in 1902 — when were the roof, HVAC, electrical panel, plumbing, and water heater last replaced?
- Why hasn't it sold? Are there any deal-killer items the seller is aware of (foundation, flood, title, zoning, code violations)?
- Is there a deadline driving the sale (1031 exchange, divorce, estate, relocation)? That informs how much negotiation room exists.
- Schools are D-rated, which usually means shorter tenancies and higher turnover. Who's the typical renter profile here, and what's been the actual vacancy rate?
- Crime grade is D in this area — have there been break-ins, vandalism, or insurance claims at this property in the last 3 years? What carrier currently insures it and at what premium?
- What's the average days-on-market for RENTAL listings here right now (not sales)? A rising rental-DOM trend means longer vacancies and softer asking-rent achievability than the comps imply.
- What's the recent tenant-quality profile in this submarket — average credit score on applications, eviction rate, late-payment / NSF rate, and stable-employment percentage? A property-management company in the area should have these aggregated.
- How much new for-sale + rental construction is in the pipeline within 1–3 miles? Heavy new supply typically softens prices + rents 12–24 months out; constrained supply supports both.
Investment metrics
- 1% rule
- 1.33% ✓
- Cap rate
- 10.86%
- Cash-on-cash
- 16.30%
- DSCR
- 1.73
- GRM
- 6.3
CMA / ARV
- ARV (median comp)
- $190,693
- List price
- $156,900
- Delta
- -17.72%
- Verdict
- UNDERPRICED
- Comps
- 20 within 1.0 mi
Show comp detail 11 sales within ~0.75 mi
| Address | Dist | Beds/Ba | Sqft | Sold | Price | $/sf | Match |
|---|---|---|---|---|---|---|---|
| 1430 College | 0.21mi | 4/1.5 (+1) | 2,447 (-8%) | 1mo | $189,900 | $78 | 70 |
| 420 N 16th St | 0.20mi | 3/2.0 | 2,694 (+2%) | 22mo | $180,000 | $67 | 69 |
| 1317 State St | 0.66mi | 3/3.0 | 2,633 (-0%) | 14mo | $261,000 | $99 | 53 |
| 1626 Kentucky St | 0.65mi | 4/2.0 (+1) | 2,767 (+5%) | 8mo | $227,000 | $82 | 51 |
| 110 West Ave | 0.65mi | 4/1.5 (+1) | 2,436 (-8%) | 2mo | $250,000 | $103 | 47 |
| 728 N 22nd St | 0.75mi | 3/1.5 | 2,468 (-7%) | 12mo | $176,500 | $72 | 42 |
| 2133 Hampshire St | 0.69mi | 2/2.0 (-1) | 2,292 (-13%) | 1mo | $180,000 | $79 | 40 |
| 1604 State St | 0.74mi | 3/2.0 | 2,265 (-14%) | 3mo | $185,000 | $82 | 39 |
| 2140 Hampshire St | 0.72mi | 3/2.0 | 2,465 (-7%) | 22mo | $199,000 | $81 | 37 |
| 1874 Grove Ave | 0.74mi | 4/1.5 (+1) | 2,868 (+8%) | 18mo | $272,000 | $95 | 30 |
| 822 N 6th | 0.75mi | 4/2.5 (+1) | 3,033 (+15%) | 12mo | $165,000 | $54 | 24 |
Match score weights: distance 35% · size 25% · config 20% · recency 20%. Top-matched comps best support the ARV.
Projected returns pro-forma
-3.0% appreciation · 8.0% rent growth · sell at horizon
- IRR
- 12.8%
- Equity multiple
- 1.54×
- Total profit
- $23,612
- Equity at exit
- $23,394
- IRR
- 25.2%
- Equity multiple
- 3.72×
- Total profit
- $119,671
- Equity at exit
- $13,566
Cash invested: $43,932 (down + closing). Projections, not guarantees.
Landlord ↔ Tenant lean methodology
- Overall (STATE)
- 43 Moderately Tenant-Leaning
- State Illinois
- 43 Moderately Tenant-Leaning · D+7
- County
- — inherits STATE
- City
- — inherits STATE
ZIP-level market 62301
- Rents YoY
- 10.8%
- Active inventory
- 184
- Price-to-rent
- 6.3×
Monthly cashflow live
- Estimated rent
- $2,084 medium interval (Pro) →
- Mortgage (P&I)
- −$823
- Tax from tax record
- −$161 /mo · $1,932/yr
- Insurance
- −$65
- HOA
- −$0
- Vacancy / Maint / Mgmt
- −$438
- Net cashflow
- $597
Break-even live
Sensitivity live
| Price | -10% $686 | -5% $641 | +0% $597 | +5% $552 | +10% $508 |
|---|---|---|---|---|---|
| Rent | -10% $432 | -5% $515 | +0% $597 | +5% $679 | +10% $761 |
| Rate | -1.0pp $676 | -0.5pp $637 | base $597 | +0.5pp $556 | +1.0pp $515 |
UW: 25.0% down · 7.5% · 30yr · 1.5% tax · 5.0% vac · 8.0% maint · 8.0% mgmt
Financing live
Cash to close
- Down payment
- $39,225
- Closing costs
- $4,707
- Reserves months
- —
- Total cash needed
- —
Loan-product check · same deal, 3 products live
Conventional
25% down · 7.5% · 30yr
- Down + closing
- —
- Monthly P&I
- —
- Monthly cashflow
- —
- DSCR
- —
- Eligible?
- —
Personal DTI + credit; lowest rate.
DSCR
20% down · 8.5% · 30yr
- Down + closing
- —
- Monthly P&I
- —
- Monthly cashflow
- —
- DSCR
- —
- Eligible?
- —
No personal income docs; deal must DSCR.
Hard money
10% down · 12.0% · 12mo
- Down + closing
- —
- Monthly P&I
- —
- Monthly cashflow
- —
- DSCR
- —
- Eligible?
- —
Short-term bridge; refi at stabilization.
Rent comps 2 comps
| Address | Beds | Baths | Sqft | Rent | $/sqft | DOM | Units | Dist |
|---|---|---|---|---|---|---|---|---|
| 201 S 8th St Quincy, IL | 2.0 | 2.5 | 1785 | $1,800 | $1.01 | 46d | 1 | 0.62mi |
| 116 N 3rd St Quincy, IL | 1.0–4.0 | 1.0–2.0 | 1950 | $4,333 | $2.22 | 46d | 12 | 0.96mi |
Listing history 31 events
-
2026-06-22days on market $156,900 Active 77 DOM
-
2026-06-19days on market $156,900 Active 74 DOM
-
2026-06-18days on market $156,900 Active 73 DOM
-
2026-06-17days on market $156,900 Active 72 DOM
-
2026-06-16days on market $156,900 Active 71 DOM
-
2026-06-15days on market $156,900 Active 70 DOM
-
2026-06-14days on market $156,900 Active 68 DOM
-
2026-06-12days on market $156,900 Active 67 DOM
-
2026-06-09days on market $156,900 Active 64 DOM
-
2026-06-09$156,900 Active 63 DOM
-
2026-06-08days on market $156,900 Active 63 DOM
-
2026-06-07days on market $156,900 Active 62 DOM
-
2026-06-03days on market $156,900 Active 58 DOM
-
2026-06-02days on market $156,900 Active 57 DOM
-
2026-06-01days on market $156,900 Active 56 DOM
-
2026-05-31days on market $156,900 Active 55 DOM
-
2026-05-30days on market $156,900 Active 54 DOM
-
2026-05-19historical Active Under Contract 644-char remark
Show marketing remark (644 chars)
If it's ample space you desire, this move-in-ready 3 bedroom (with a non-conforming 4th) 2 bath home delivers! On the main level you will find a massive living room, formal dinning room, primary bedroom, and stunning updated bathroom with a beautiful original stained glass window. Walk upstairs to find a 38'x 12' bedroom with its own full bath, or downstairs to find yet another open living area complete with bedroom #3 and office or non-conforming 4th bedroom. There is zero shortage of space and comfort in this 2,600+ sqft of livable space cozy home and is an in-person must see property. Set up your showing today & see for yourself!
-
2026-05-19historical Contingent - Continue to Show 644-char remark
Show marketing remark (644 chars)
If it's ample space you desire, this move-in-ready 3 bedroom (with a non-conforming 4th) 2 bath home delivers! On the main level you will find a massive living room, formal dinning room, primary bedroom, and stunning updated bathroom with a beautiful original stained glass window. Walk upstairs to find a 38'x 12' bedroom with its own full bath, or downstairs to find yet another open living area complete with bedroom #3 and office or non-conforming 4th bedroom. There is zero shortage of space and comfort in this 2,600+ sqft of livable space cozy home and is an in-person must see property. Set up your showing today & see for yourself!
-
2026-04-23price $156,900 644-char remark
Show marketing remark (644 chars)
If it's ample space you desire, this move-in-ready 3 bedroom (with a non-conforming 4th) 2 bath home delivers! On the main level you will find a massive living room, formal dinning room, primary bedroom, and stunning updated bathroom with a beautiful original stained glass window. Walk upstairs to find a 38'x 12' bedroom with its own full bath, or downstairs to find yet another open living area complete with bedroom #3 and office or non-conforming 4th bedroom. There is zero shortage of space and comfort in this 2,600+ sqft of livable space cozy home and is an in-person must see property. Set up your showing today & see for yourself!
-
2026-04-06$159,700 Active 644-char remark
Show marketing remark (644 chars)
If it's ample space you desire, this move-in-ready 3 bedroom (with a non-conforming 4th) 2 bath home delivers! On the main level you will find a massive living room, formal dinning room, primary bedroom, and stunning updated bathroom with a beautiful original stained glass window. Walk upstairs to find a 38'x 12' bedroom with its own full bath, or downstairs to find yet another open living area complete with bedroom #3 and office or non-conforming 4th bedroom. There is zero shortage of space and comfort in this 2,600+ sqft of livable space cozy home and is an in-person must see property. Set up your showing today & see for yourself!
-
2022-09-27historical
-
2017-05-25soldstatus $75,000
-
2017-05-25soldstatus $75,000
-
2017-05-25soldstatus $75,000
-
2016-10-22$79,900
-
2016-10-22$79,900
-
2016-10-22$79,900
-
2016-10-22historical
ⓘ Source: listings_history table (triggers on properties + properties_extension) + one-shot
backfill from property_details.listing_events for pre-trigger history.
Tax reassessment forecast IL · Partial reset (capped growth)
- Current annual tax
- $1,932 · $161/mo
- Projected year-2 tax
- $2,747 · $229/mo
- Expected delta
- +$815/yr (+$68/mo · 42.2%)
ⓘ Screening estimate from a state-policy table — verify with the county assessor before closing.
Climate risk First Street
- Flood 1/10 Low FEMA zone X (unshaded) · 0% chance over 30 yrs
- Wildfire 1/10 Low
- Heat 4/10 Moderate 7 d/yr ≥106°F today · 17 d/yr by 30 yrs out
- Wind 2/10 Low
- Air quality 2/10 Low 1 unhealthy d/yr today · 1 by 30 yrs out
Nearby sold comps map
Loading sold comps map…
Walkable amenities ~0.75 mi
Loading nearby amenities…
Taxation est. · year 1
- Rental income
- $25,004
- − Mortgage interest
- −$8,789
- − Property taxes
- −$1,932
- − Insurance
- −$784
- − Repairs & maintenance
- −$2,000
- − Management
- −$2,000
- − Depreciation
- −$4,564
- Taxable income
- $4,933
- Est. tax owed @ 24.0%
- −$1,184
- After-tax cash flow
- $5,979/yr
For passive investors: Depreciation is non-cash, so a rental often shows a tax loss while cash-flowing — sheltering income. Rental losses are passive: they offset passive income freely, and up to $25,000/yr can offset ordinary (W-2) income if you actively participate and your MAGI is under $100k (phasing out to $0 by $150k); unused losses carry forward. On sale, claimed depreciation is recaptured at up to 25%, and gains may owe capital-gains tax (a 1031 exchange can defer both). Figures are a year-1 estimate at your 24.0% rate — not tax advice; consult a CPA.
Schools (NCES district)
- District
- Quincy SD 172
- NCES district ID
- 1733000
- Math proficiency
- 24% ▬ 0.00%
- Reading proficiency
- 27% ▬ 0.00%
- Median HH income
- $44,132
- Composite
- 21.91/100
- National rank
- #8229
- State rank
- #328 of 620 in IL
Livability — Quincy
- Score
- 67/100
- State rank
- #506
- US rank
- #10458
Category grades
Schools grade is shown separately in the Schools card above.
Census & demographics
- Census place
- Quincy, IL
- County
- Adams County · 30,746 people
- City population
- 30,746
- Metro
- Quincy, IL-MO
- Population (ZIP)
- 30,746
- Household income
- $52,055
- Rent vs Own
- Severe rent burden
- 1238.0
Population outlook (Adams County) Hauer SSP2
- Today (2025)
- 65,795 people
- By 2030
- 64,436 · -2.1%
- By 2040
- 61,007 · -7.3%
- By 2050
- 56,851 · -13.6%
- By 2075
- 46,424 · -29.4%
- By 2100
- 34,305 · -47.9%
Race, ethnicity, and origin ACS 2023
- Neighborhood character
- Predominantly White (84%)
- Race & ethnicity
- White 84% Two or more races 7% Black 6% Hispanic / Latino 3% Asian 1%
- Common ancestry
- Slovak 2% Iranian 1% Lithuanian 1%
- Foreign-born
- 2% · Canada
- Languages at home
- 96% English-only · Spanish 2%
Political lean MEDSL · Adams
- 2024 margin
- Solid R (+47.4) · D 25.6% · R 73.0% · Other 1.5%
- 2008→2024 swing
- -25.0pp toward R · 2008: -22.4pp · 2024: -47.4pp
- All cycles
- 2024: R+47.4 2020: R+46.5 2016: R+47.5 2012: R+35.2 2008: R+22.4
Not yet ingested
- Civics
- —
Market trends
- HPI YoY
- ▼ -121.44%
- Current HPI
- 131.7344
- Rent YoY
- ▲ 10.78%
- Metro
- Quincy, IL-MO
- State GDP YoY
- ▲ 1.59%
- F500 in state
- 60
Industry mix (Fortune 500 HQ in IL)
| Industry | F500 HQs | Revenue |
|---|---|---|
| Insurance | 4 | $201B |
|
||
| Consumer Goods | 4 | $87B |
|
||
| Industrial Machinery | 3 | $64B |
|
||
| Healthcare | 2 | $55B |
|
||
| Retail / Pharmacy | 1 | $148B |
|
||
| Agriculture / Food | 1 | $86B |
|
||
Price history
+96.4% since first listed14 events — show timeline
- 2026-05-19 Contingent — MARIS as Distributed by MLS Grid
- 2026-05-19 Contingent — MRED as Distributed by MLS Grid
- 2026-04-23 Price Changed $156,900 MRED as Distributed by MLS Grid
- 2026-04-23 Price Changed $156,900 MARIS as Distributed by MLS Grid
- 2026-04-06 Listed $159,700 MRED as Distributed by MLS Grid
- 2026-04-06 Listed $159,700 MARIS as Distributed by MLS Grid
- 2022-09-27 Listing Removed — RMLSA as Distributed by MLS Grid
- 2017-05-25 Sold (MLS) $75,000 Quincy AOR
- 2017-05-25 Sold (MLS) $75,000 RMLSA as Distributed by MLS Grid
- 2017-05-25 Sold (MLS) $75,000 MRED as Distributed by MLS Grid
- 2016-10-22 Listing Removed — MRED as Distributed by MLS Grid
- 2016-10-22 Listed $79,900 Quincy AOR
- 2016-10-22 Listed $79,900 RMLSA as Distributed by MLS Grid
- 2016-10-22 Listed $79,900 MRED as Distributed by MLS Grid
Property tax history
+2.0%/yrLatest (2023): $1,932 · +15.0% YoY. Source: county tax records.
Cash-flow waterfall
monthlySold comps — $/sqft
last 12 mo · ≤1 miLoading sold comps…