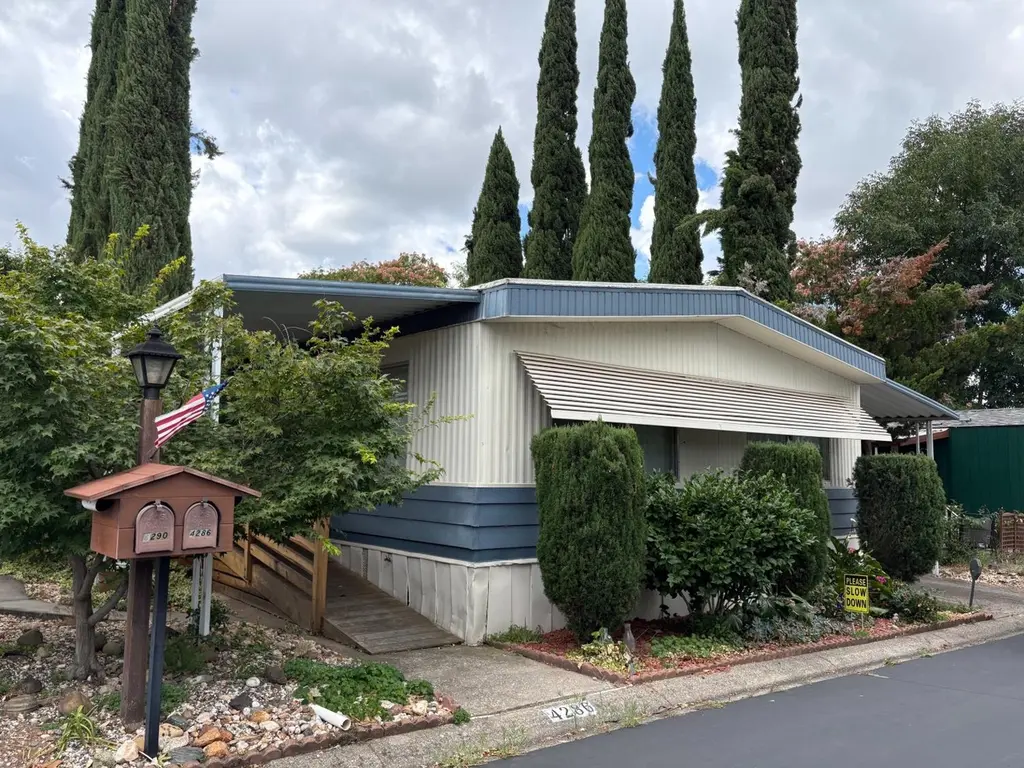
4286 Oakwood St #28 · Rocklin, CA
Flood risk 6/10 · Moderate
- FEMA flood zone
- X (unshaded)
- Chance of flooding over 30 yrs
- 0.68%
- Est. flood insurance / yr
- $507 – $1,088
Fire risk 8/10 · Major
- Est. fire insurance / yr
- $659 – $1,223
Heat risk 7/10 · Major
- Hot days now (above 104°F)
- 7 days/yr
- Hot days in 30 yrs
- 16 days/yr
Wind risk 1/10 · Minimal
- Chance of severe wind over 30 yrs
- —
Air-quality risk 10/10 · Severe
- Unhealthy air days now
- 32 days/yr
- Unhealthy air days in 30 yrs
- 38 days/yr
Risk factors via First Street. Map © Google.
Why this score? — see what drove the B+ grade
The composite is a weighted blend of 9 inputs, each scored 0–100. Each bar is that input's sub-score; the figure is the points it added to the 100-point composite (weight × sub-score).
- Cash flow +30.0/30.0
- ARV discount +15.0/15.0
- 1% rule +10.0/10.0
- DSCR +10.0/10.0
- Schools +5.0/10.0
- Livability +3.7/5.0
- Rent growth +3.2/5.0
- Condition / age +2.2/5.0
- Appreciation +0.0/10.0
$99,800
🖨 Deal sheet 📄 Offer letter ✓ Due diligence
Listing remarks
Home located in Sierra Lakes All Age Community. Living room opens up to gorgeous deck with wheelchair ramp. Upgrades included 3/4 inch hardwood flooring in Living room, Dining Room, Hallway and Bedrooms, Central Heat & Air. Open Floor plan features spacious living room and nice size dining room with updated China Cabinet. Home shows well however does need some tender love. Nice size backyard to enjoy those summer evenings. Sierra Lakes offers a parklike setting with large trees, streams and lake to enjoy plus clubhouse with billiards room, library and pool. Home Sold in AS-IS condition. No reasonable offer refused.
Key facts
- Open floor plan
- Clubhouse
- Central heat and air
Tags
Property features AI
Finance
- Other: Located at 4286 Oakwood St #28, Rocklin, CA 95677; Directions: I-80 to Rocklin Road, turn around 1st roundabout and turn left on Creekside Drive, immediate left onto Oakwood Street
- Financial info: Land lease: No
- HOA & community: No association
Exterior
- Parking: 2 parking spaces; Off-street, covered parking with no garage
- Utilities: Electric: Other; Public water; Public sewer
- Home design: Manufactured in park (double wide); Updated/remodeled; also listed as fixer; Built in 1976
- Construction: Metal roof; Metal skirting; Manufacturer/Make: Skyline
- Exterior features: Carport awning; Backyard
Interior
- Kitchen: Built-in gas oven, gas cook top, dishwasher; Laminate countertops
- Bedrooms: 2 bedrooms
- Flooring: Laminate flooring; Linoleum flooring
- Bathrooms: 2 full bathrooms; Includes tub, tub with shower over, and shower stall(s)
- Heating & cooling: Central heating; Central cooling with ceiling fan(s)
- Interior features: Built-in gas oven, gas cook top, dishwasher; Laminate counters; Porch steps, covered deck, porch ramp; Pets allowed (cats and dogs, number limit)
- Laundry & utility: Washer and dryer included
Neighborhood map
What this means for you Summary
Snapshot
- This is a 2-bed/2.0-bath manufactured listed at $100k. Condition is rated fair.
Deal economics
- At list price, monthly cash flow is $1k ($14k/yr) — positive.
- The deal already cash-flows at list — no discount required.
- Meets the 1% rule at list price ($2k rent vs $100k).
- Recommended offer: $98k (1.5% below list) — sets the bar for market timing.
- Cap rate 20.4% vs local median 2.7% in Rocklin — top-decile yield for the area; either an underpriced asset or a hidden risk that comps aren't pricing in. Stress-test before assuming the spread holds.
Location & tenants
- Location reads 74/100 on livability (#136 in CA, #4,755 nationally) — a middle-class / working-renter tenant base. Strengths: schools A+, employment A+, housing A+; Watch: commute D+, amenities F, cost of living F.
- Rocklin Unified (suburban): math 44% / reading 65% proficiency, ranked #96 of 517 in CA (top 19%) — acceptable for families but not a draw, mixed tenant base, ~2y average lease; only 14% free/reduced lunch — higher-income household profile.
- Market conditions: Rents rising (+2.9%/yr); 159 active listings in the ZIP; 11 comparable units currently listed for rent nearby; rentals leasing fast (median 2d on market — plan ~1-2 weeks tenant-placement turnaround); solid renter incomes; 3,535 units permitted in Placer County in 2024 (689 in 5+ unit buildings).
Forward outlook
- Local home prices are declining (-3.0%/yr); year-one equity from $690 of loan paydown is wiped out by about $3k of value loss. Plan a longer hold.
- Placer County population projected at +20% by 2050 — long-run rental-demand tailwind backs the buy-and-hold thesis.
- At projected returns (-3.0% appreciation + 2.9% rent growth), your $28k cash investment doubles in ~3 years — after that, you're playing with house money.
Negotiation context
- It's been on market 22 days — a 2% lower offer ($98k) is reasonable based on typical stale-listing flexibility.
Risks & watch-outs
- Climate carrying-cost: major flood risk; severe wildfire risk; extreme-heat days projected 7→16/yr by 2055 (HVAC capex compounding) — expect insurance premiums to compound above CPI over the hold.
Questions for the listing agent
- Have any recent inspections been done? Can we get a copy of the seller's disclosures and any deferred-maintenance estimates?
- Built in 1976 — when were the roof, HVAC, electrical panel, plumbing, and water heater last replaced?
- Is there a deadline driving the sale (1031 exchange, divorce, estate, relocation)? That informs how much negotiation room exists.
- Schools are A-rated — typically a magnet for longer-tenancy family renters. What's the average tenant stay here, and is there a school-zone premium baked into asking?
- What's the average days-on-market for RENTAL listings here right now (not sales)? A rising rental-DOM trend means longer vacancies and softer asking-rent achievability than the comps imply.
- What's the recent tenant-quality profile in this submarket — average credit score on applications, eviction rate, late-payment / NSF rate, and stable-employment percentage? A property-management company in the area should have these aggregated.
- How much new for-sale + rental construction is in the pipeline within 1–3 miles? Heavy new supply typically softens prices + rents 12–24 months out; constrained supply supports both.
Investment metrics
- 1% rule
- 2.36% ✓
- Cap rate
- 20.38%
- Cash-on-cash
- 50.30%
- DSCR
- 3.24
- GRM
- 3.5
CMA / ARV
- ARV (on-the-fly)
- $119,952
- Comps found
- 12
Show comp detail 12 sales within ~0.75 mi
| Address | Dist | Beds/Ba | Sqft | Sold | Price | $/sf | Match |
|---|---|---|---|---|---|---|---|
| 4267 Fernwood St | 0.02mi | 2/2.0 | 1,248 (+2%) | 6mo | $130,000 | $104 | 91 |
| 4140 Lakeside Dr | 0.20mi | 2/2.0 | 1,248 (+2%) | 1mo | $55,000 | $44 | 87 |
| 4212 Rockwood St | 0.13mi | 2/2.0 | 1,141 (-7%) | 0mo | $158,600 | $139 | 82 |
| 4264 Fernwood St #54 | 0.04mi | 3/2.0 (+1) | 1,300 (+6%) | 8mo | $100,000 | $77 | 76 |
| 4288 Fernwood St #48 | 0.04mi | 2/2.0 | 1,152 (-6%) | 15mo | $65,000 | $56 | 76 |
| 4311 Oakwood St | 0.05mi | 2/2.0 | 1,296 (+6%) | 16mo | $115,000 | $89 | 74 |
| 4319 Oakwood St | 0.07mi | 2/2.0 | 1,368 (+12%) | 10mo | $151,000 | $110 | 69 |
| 5505 South Grv #60 | 0.27mi | 2/2.0 | 1,152 (-6%) | 12mo | $125,000 | $109 | 68 |
| 5505 S Grove St #113 | 0.27mi | 3/2.0 (+1) | 1,164 (-5%) | 15mo | $112,000 | $96 | 61 |
| 5505 S Grove St #88 | 0.35mi | 2/2.0 | 1,314 (+7%) | 13mo | $90,000 | $68 | 60 |
| 5505 S Grove St #15 | 0.27mi | 3/2.0 (+1) | 1,293 (+6%) | 20mo | $169,000 | $131 | 57 |
| 5505 S Grove St #51 | 0.27mi | 3/2.0 (+1) | 1,380 (+13%) | 10mo | $135,000 | $98 | 53 |
Match score weights: distance 35% · size 25% · config 20% · recency 20%. Top-matched comps best support the ARV.
Projected returns pro-forma
-3.0% appreciation · 2.93% rent growth · sell at horizon
- IRR
- 48.0%
- Equity multiple
- 3.09×
- Total profit
- $58,299
- Equity at exit
- $14,881
- IRR
- 53.6%
- Equity multiple
- 6.24×
- Total profit
- $146,291
- Equity at exit
- $8,629
Cash invested: $27,944 (down + closing). Projections, not guarantees.
Landlord ↔ Tenant lean methodology
- Overall (STATE)
- 18 Strongly Tenant-Friendly
- State California
- 18 Strongly Tenant-Friendly · D+13
- County
- — inherits STATE
- City
- — inherits STATE
ZIP-level market 95677
- Rents YoY
- 2.9%
- Active inventory
- 159
- Price-to-rent
- 3.5×
Monthly cashflow live
- Estimated rent
- $2,356 high interval (Pro) →
- Mortgage (P&I)
- −$523
- Tax est. 1.5%
- −$125 /mo · $1,497/yr
- Insurance
- −$42
- HOA
- −$0
- Vacancy / Maint / Mgmt
- −$495
- Net cashflow
- $1,171
Break-even live
UW: 25.0% down · 7.5% · 30yr · 1.5% tax · 5.0% vac · 8.0% maint · 8.0% mgmt
Financing live
Cash to close
- Down payment
- $24,950
- Closing costs
- $2,994
- Reserves months
- —
- Total cash needed
- —
Loan-product check · same deal, 3 products live
Conventional
25% down · 7.5% · 30yr
- Down + closing
- —
- Monthly P&I
- —
- Monthly cashflow
- —
- DSCR
- —
- Eligible?
- —
Personal DTI + credit; lowest rate.
DSCR
20% down · 8.5% · 30yr
- Down + closing
- —
- Monthly P&I
- —
- Monthly cashflow
- —
- DSCR
- —
- Eligible?
- —
No personal income docs; deal must DSCR.
Hard money
10% down · 12.0% · 12mo
- Down + closing
- —
- Monthly P&I
- —
- Monthly cashflow
- —
- DSCR
- —
- Eligible?
- —
Short-term bridge; refi at stabilization.
Rent comps 11 comps
| Address | Beds | Baths | Sqft | Rent | $/sqft | DOM | Units | Dist |
|---|---|---|---|---|---|---|---|---|
| 5415 S Grove St Rocklin, CA | 1.0–2.0 | 1.0 | 765 | $2,100 | $2.75 | 2d | 6 | 0.30mi |
| 4769 Racetrack Cir Rocklin, CA | 3.0 | 2.0 | 1148 | $2,950 | $2.57 | 44d | 1 | 0.45mi |
| 5800 Woodside Dr Rocklin, CA | 1.0–2.0 | 1.0–2.0 | 850 | $2,239 | $2.63 | 3d | 4 | 0.68mi |
| 1501 Cobble Creek Cir Rocklin, CA | 1.0–2.0 | 1.0–2.0 | 881 | $2,300 | $2.61 | 2d | 7 | 1.09mi |
| 5051 El Don Dr Rocklin, CA | 2.0 | 2.0 | 1125 | $2,270 | $2.02 | 2d | 7 | 1.10mi |
| 5180 Rocklin Rd Rocklin, CA | 1.0–2.0 | 1.0–2.0 | 857 | $2,552 | $2.98 | 2d | 9 | 1.20mi |
| 6250 Westwood Dr Rocklin, CA | 2.0 | 1.0 | 827 | $1,995 | $2.41 | 23d | 1 | 1.27mi |
| 6260 Westwood Dr Rocklin, CA | 2.0 | 1.0 | 827 | $1,995 | $2.41 | 22d | 1 | 1.28mi |
| 6260 Westwood Dr Rocklin, CA | 2.0 | 1.0 | 828 | $1,995 | $2.41 | 12d | 1 | 1.28mi |
| 5240 Rocklin Rd Rocklin, CA | 2.0 | 1.0–2.0 | 809 | $2,220 | $2.74 | 2d | 5 | 1.31mi |
| 5002 Jewel St Rocklin, CA | 1.0–3.0 | 1.0–2.0 | 1082 | $2,658 | $2.45 | 2d | 13 | 1.47mi |
Listing history 16 events
-
2026-06-19status $99,800 Pending 22 DOM
-
2026-06-18days on market $99,800 Active 22 DOM
-
2026-06-17days on market $99,800 Active 21 DOM
-
2026-06-16days on market $99,800 Active 20 DOM
-
2026-06-15days on market $99,800 Active 19 DOM
-
2026-06-13days on market $99,800 Active 17 DOM
-
2026-06-13days on market $99,800 Active 16 DOM
-
2026-06-09days on market $99,800 Active 13 DOM
-
2026-06-08days on market $99,800 Active 12 DOM
-
2026-06-07days on market $99,800 Active 11 DOM
-
2026-06-05days on market $99,800 Active 8 DOM
-
2026-06-03days on market $99,800 Active 7 DOM
-
2026-06-02days on market $99,800 Active 6 DOM
-
2026-06-02remarks 624-char remark
-
2026-06-01days on market $99,800 Active 5 DOM
-
2026-05-31days on market $99,800 Active 4 DOM
ⓘ Source: listings_history table (triggers on properties + properties_extension) + one-shot
backfill from property_details.listing_events for pre-trigger history.
Climate risk First Street
- Flood 6/10 Major FEMA zone X (unshaded) · 68% chance over 30 yrs
- Wildfire 8/10 Severe
- Heat 7/10 Severe 7 d/yr ≥104°F today · 16 d/yr by 30 yrs out
- Wind 1/10 Low
- Air quality 10/10 Extreme 32 unhealthy d/yr today · 38 by 30 yrs out
Nearby sold comps map
Loading sold comps map…
Walkable amenities ~0.75 mi
Loading nearby amenities…
Taxation est. · year 1
- Rental income
- $28,268
- − Mortgage interest
- −$5,590
- − Property taxes
- −$1,497
- − Insurance
- −$499
- − Repairs & maintenance
- −$2,261
- − Management
- −$2,261
- − Depreciation
- −$2,903
- Taxable income
- $13,256
- Est. tax owed @ 24.0%
- −$3,181
- After-tax cash flow
- $10,874/yr
For passive investors: Depreciation is non-cash, so a rental often shows a tax loss while cash-flowing — sheltering income. Rental losses are passive: they offset passive income freely, and up to $25,000/yr can offset ordinary (W-2) income if you actively participate and your MAGI is under $100k (phasing out to $0 by $150k); unused losses carry forward. On sale, claimed depreciation is recaptured at up to 25%, and gains may owe capital-gains tax (a 1031 exchange can defer both). Figures are a year-1 estimate at your 24.0% rate — not tax advice; consult a CPA.
Condition & rehab AI · 12 photos
The home requires moderate renovations, including new kitchen cabinets and bathroom fixtures, to improve its resale and rental value. The property has good curb appeal and a good foundation, but the interior needs updating to meet current standards.
Repairs flagged
- Major Kitchen cabinets — Outdated and in need of replacement
- Major Bathroom fixtures — Dated and in need of replacement
Value-add opportunities
- Resale Paint interior walls — Fresh paint can make a significant difference in the home's appearance
- Resale Replace kitchen cabinets — New cabinets can greatly enhance the kitchen's functionality and aesthetic
- Resale Replace bathroom fixtures — Modern fixtures can improve the bathroom's functionality and appeal
- Both Landscaping — A well-maintained yard can increase both resale and rental value
Renovation cost estimate screening
| Repair item | Severity | Est. cost |
|---|---|---|
| Kitchen cabinets · Outdated and in need of replacement | Major | $15,000–50,000 |
| Bathroom fixtures · Dated and in need of replacement | Major | $15,000–50,000 |
| Total estimated repair cost · 2 items | $30,000–100,000 |
Value-add ROI direction
- Resale Paint interior walls — Fresh paint can make a significant difference in the home's appearance ↑
- Resale Replace kitchen cabinets — New cabinets can greatly enhance the kitchen's functionality and aesthetic ↑
- Resale Replace bathroom fixtures — Modern fixtures can improve the bathroom's functionality and appeal ↑
- Both Landscaping — A well-maintained yard can increase both resale and rental value ↑
ⓘ Cost ranges are severity-bucket heuristics (US national rule-of-thumb). Get contractor quotes + a written scope before underwriting a rehab budget.
Schools (NCES district)
- District
- Rocklin Unified
- NCES district ID
- 0600013
- Math proficiency
- 44% ▼ -19.00%
- Reading proficiency
- 65% ▼ -6.00%
- Median HH income
- $82,858
- Composite
- 49.58/100
- National rank
- #1984
- State rank
- #96 of 517 in CA
Livability — Rocklin
- Score
- 74/100
- State rank
- #136
- US rank
- #4755
Category grades
Schools grade is shown separately in the Schools card above.
Census & demographics
- Census place
- Rocklin, CA
- County
- Placer County · 390,510 people
- City population
- 73,077
- Metro
- Sacramento-Roseville-Folsom, CA
- Population (ZIP)
- 29,206
- Household income
- $105,713
- Rent vs Own
- Severe rent burden
- 1107.0
Population outlook (Placer County) Hauer SSP2
- Today (2025)
- 422,709 people
- By 2030
- 444,249 · +5.1%
- By 2040
- 480,192 · +13.6%
- By 2050
- 506,390 · +19.8%
- By 2075
- 550,219 · +30.2%
- By 2100
- 547,760 · +29.6%
Race, ethnicity, and origin ACS 2023
- Neighborhood character
- Predominantly White (67%)
- Race & ethnicity
- White 67% Hispanic / Latino 15% Two or more races 15% Asian 7% Black 1%
- Hispanic origin (detail)
- Mexican 10%
- Common ancestry
- Italian 3% Slovak 3% Lithuanian 2%
- Foreign-born
- 10% · Canada, China, South Korea
- Languages at home
- 86% English-only · Spanish 5% Other Indo-European 2% Russian/Polish/Slavic 2%
Political lean MEDSL · Placer
- 2024 margin
- Lean R (+8.5) · D 44.3% · R 52.8% · Other 2.9%
- 2008→2024 swing
- +2.8pp toward D · 2008: -11.3pp · 2024: -8.5pp
- All cycles
- 2024: R+8.5 2020: R+6.7 2016: R+11.3 2012: R+20.1 2008: R+11.3
Not yet ingested
- Civics
- —
Market trends
- HPI YoY
- ▼ -443.08%
- Current HPI
- 278.1359
- Rent YoY
- ▲ 2.93%
- Metro
- Sacramento-Roseville-Folsom, CA
- State GDP YoY
- ▲ 3.21%
- F500 in state
- 116
Industry mix (Fortune 500 HQ in CA)
| Industry | F500 HQs | Revenue |
|---|---|---|
| Technology | 27 | $1,492B |
|
||
| Financial Services | 3 | $174B |
|
||
| Retail | 3 | $44B |
|
||
| Insurance | 3 | $26B |
|
||
| Media / Entertainment | 2 | $115B |
|
||
| Pharmaceuticals / Biotech | 2 | $62B |
|
||
Cash-flow waterfall
monthlySold comps — $/sqft
last 12 mo · ≤1 miLoading sold comps…