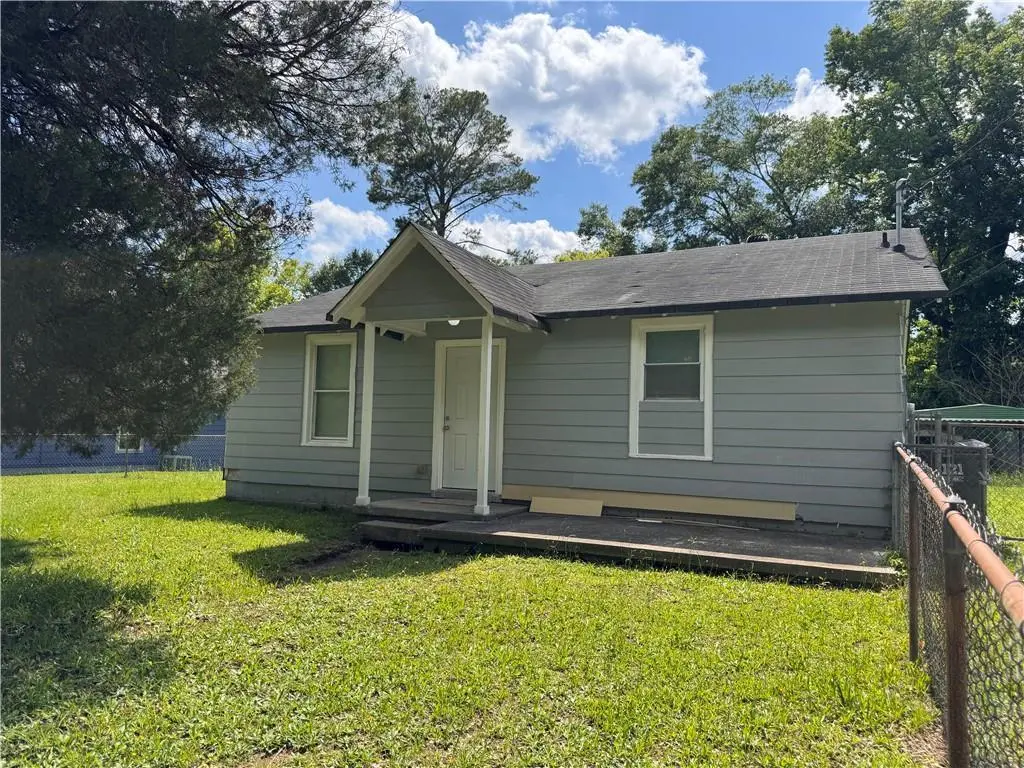
424 15th Ave S · Phenix City, AL
Flood risk 1/10 · Minimal
- FEMA flood zone
- X (unshaded)
- Chance of flooding over 30 yrs
- 0.0%
- Est. flood insurance / yr
- $507 – $1,088
Fire risk 2/10 · Minimal
- Est. fire insurance / yr
- $916 – $1,700
Heat risk 7/10 · Major
- Hot days now (above 108°F)
- 7 days/yr
- Hot days in 30 yrs
- 19 days/yr
Wind risk 6/10 · Moderate
- Chance of severe wind over 30 yrs
- 76.0%
Air-quality risk 4/10 · Minor
- Unhealthy air days now
- 4 days/yr
- Unhealthy air days in 30 yrs
- 5 days/yr
Risk factors via First Street. Map © Google.
Why this score? — see what drove the D grade
The composite is a weighted blend of 9 inputs, each scored 0–100. Each bar is that input's sub-score; the figure is the points it added to the 100-point composite (weight × sub-score).
- Cash flow +16.4/30.0
- ARV discount +7.5/15.0
- DSCR +5.1/10.0
- 1% rule +3.3/10.0
- Livability +3.0/5.0
- Schools +2.7/10.0
- Rent growth +2.6/5.0
- Condition / age +2.5/5.0
- Appreciation +0.0/10.0
$115,500
🖨 Deal sheet (PDF) 📄 Offer letter ✓ Due diligence
Listing remarks
Completely refreshed and move-in ready, this charming 2-bedrooms/1bath-home offers modern updates and practical living on a spacious fenced lot. Inside, you'll find a bright and inviting kitchen featuring updated cabinetry, contemporary countertops, stainless steel appliances, and convenient in-home laundry. Large windows provide abundant natural light throughout the home, creating a warm and welcoming atmosphere. Outside, enjoy a generous yard with plenty of space for entertaining, gardening, pets, or future outdoor improvements. This home is just minutes from restaurants, hotels, shopping and a community sports complex offering pool, soccer field, event room, walking trail, basketball cou
Key facts
- Bright kitchen
- In-home laundry
- Updated cabinetry
Tags
Property features AI
Finance
- HOA & community: Community amenities include pool and restaurant
Exterior
- Parking: Carport (1 space); Covered parking (1 space); Driveway
- Security: Smoke detector(s)
- Utilities: Public water; Public sewer; Electricity available; Phone available; Sewer available
- Home design: Single-family residence; One level; No common walls
- Construction: Lap siding construction; Composition roof
- Exterior features: Outbuilding; Other exterior features; Chain link fencing; No patio or porch features; Cleared, level lot; Asphalt road frontage on a city street; View present
Interior
- Kitchen: Electric cooktop
- Bedrooms: Two bedrooms on the main level
- Flooring: Carpet; Vinyl
- Bathrooms: One full bathroom on the main level
- Heating & cooling: Central heating; Central air conditioning
- Interior features: Other interior features; Smoke detector(s)
- Laundry & utility: Laundry located in the kitchen; Dryer
Neighborhood map
What this means for you Summary
Snapshot
- This is a 2-bed/1.0-bath single-family listed at $116k.
Deal economics
- At list price, monthly cash flow is $66 ($789/yr) — positive.
- The deal already cash-flows at list — no discount required.
- To meet the 1% rule (rent ≥ 1% of price), the offer needs to be $96k (16.9% below list).
- Recommended offer: $96k (16.9% below list) — sets the bar for 1% rule.
- Cap rate 7.0% vs local median 5.1% in Phenix City — top-decile yield for the area; either an underpriced asset or a hidden risk that comps aren't pricing in. Stress-test before assuming the spread holds.
Location & tenants
- Location reads 60/100 on livability (#297 in AL) — a middle-class / working-renter tenant base. Strengths: cost of living A+, housing A+; Watch: crime F, amenities F, commute F.
- Phenix City (suburban): math 22% / reading 44% proficiency, ranked #59 of 129 in AL (top 46%) — families likely to look elsewhere, expect single-tenant / working-renter base with shorter leases; 64% free/reduced lunch — lower-income household profile, screen leases tightly.
- Zoned schools: Ridgecrest Elementary School (math 17% / reading 39%, grade F, #385 of 627 statewide, top 62%, 796 students, 89% FRL); Phenix City Intermediate School (math 18% / reading 41%, grade F, #129 of 257 statewide, top 52%, 1,044 students, 80% FRL); Central High School (math 26% / reading 21%, grade F, #139 of 305 statewide, top 45%, 1,495 students, 74% FRL) — zoned schools average 81% FRL vs 64% district-wide (17 pts higher); higher-poverty schools than district average — tighter screening recommended.
- Market conditions: Rents flat; 107 active listings in the ZIP; 8 comparable units currently listed for rent nearby; rentals at typical pace (median 23d on market — plan ~3-4 weeks tenant-placement turnaround); 183 units permitted in Russell County in 2024 (0 in 5+ unit buildings).
Forward outlook
- Local home prices are declining (-3.0%/yr); year-one equity from $799 of loan paydown is wiped out by about $3k of value loss. Plan a longer hold.
- Russell County population projected at +42% by 2050 — long-run rental-demand tailwind backs the buy-and-hold thesis.
Negotiation context
- It's been on market 19 days — a 2% lower offer ($114k) is reasonable based on typical stale-listing flexibility.
- Current owner paid $11k; list at $116k implies a 914% gain — meaningful room to come down on a strong offer.
Risks & watch-outs
- Watch-outs: built in 1948 — expect roof / HVAC / electrical / plumbing capex.
- Climate carrying-cost: major wind risk, 76% chance of damaging wind over 30y; extreme-heat days projected 7→19/yr by 2055 (HVAC capex compounding) — expect insurance premiums to compound above CPI over the hold.
Questions for the listing agent
- Built in 1948 — when were the roof, HVAC, electrical panel, plumbing, and water heater last replaced?
- Is there a deadline driving the sale (1031 exchange, divorce, estate, relocation)? That informs how much negotiation room exists.
- Schools are D-rated, which usually means shorter tenancies and higher turnover. Who's the typical renter profile here, and what's been the actual vacancy rate?
- Crime grade is F in this area — have there been break-ins, vandalism, or insurance claims at this property in the last 3 years? What carrier currently insures it and at what premium?
- The area grade is low — what's the realistic commute time and amenity access for the typical tenant pool here? Any planned neighborhood developments (good or bad) we should know about?
- What's the average days-on-market for RENTAL listings here right now (not sales)? A rising rental-DOM trend means longer vacancies and softer asking-rent achievability than the comps imply.
- What's the recent tenant-quality profile in this submarket — average credit score on applications, eviction rate, late-payment / NSF rate, and stable-employment percentage? A property-management company in the area should have these aggregated.
- How much new for-sale + rental construction is in the pipeline within 1–3 miles? Heavy new supply typically softens prices + rents 12–24 months out; constrained supply supports both.
Investment metrics
- 1% rule
- 0.83% ✗
- Cap rate
- 6.98%
- Cash-on-cash
- 2.44%
- DSCR
- 1.11
- GRM
- 10.0
CMA / ARV
- ARV (on-the-fly)
- $43,008
- Comps found
- 5
Show comp detail 5 sales within ~0.75 mi
| Address | Dist | Beds/Ba | Sqft | Sold | Price | $/sf | Match |
|---|---|---|---|---|---|---|---|
| 415 S 16th Ave | 0.10mi | 2/1.0 | 858 (-4%) | 7mo | $110,000 | $128 | 83 |
| 411 12th Ave | 0.27mi | 2/1.0 | 864 (-4%) | 14mo | $45,000 | $52 | 70 |
| 1304 2nd Place South Pl | 0.41mi | 2/1.0 | 952 (+6%) | 18mo | $35,000 | $37 | 55 |
| 220 15th Ave S | 0.32mi | 2/1.0 | 1,015 (+13%) | 10mo | $45,000 | $44 | 55 |
| 111 11th Ave S | 0.60mi | 2/1.0 | 837 (-7%) | 12mo | $40,000 | $48 | 51 |
Match score weights: distance 35% · size 25% · config 20% · recency 20%. Top-matched comps best support the ARV.
Projected returns pro-forma
-3.0% appreciation · 0.43% rent growth · sell at horizon
- IRR
- -15.1%
- Equity multiple
- 0.47×
- Total profit
- $-16,999
- Equity at exit
- $17,221
- IRR
- -10.9%
- Equity multiple
- 0.41×
- Total profit
- $-19,046
- Equity at exit
- $9,986
Cash invested: $32,340 (down + closing). Projections, not guarantees.
Landlord ↔ Tenant lean methodology
- Overall (STATE)
- 90 Strongly Landlord-Friendly
- State Alabama
- 90 Strongly Landlord-Friendly · R+15
- County
- — inherits STATE
- City
- — inherits STATE
ZIP-level market 36869
- Home prices YoY
- -22.2%
- Rents YoY
- 0.4%
- Active inventory
- 107
- Price-to-rent
- 10.0×
Monthly cashflow live
- Estimated rent
- $959 high interval (Pro) →
- Mortgage (P&I)
- −$606
- Tax from tax record
- −$38 /mo · $460/yr
- Insurance
- −$48
- HOA
- −$0
- Vacancy / Maint / Mgmt
- −$201
- Net cashflow
- $66
Break-even live
Sensitivity live
| Price | -10% $131 | -5% $98 | +0% $66 | +5% $33 | +10% $0 |
|---|---|---|---|---|---|
| Rent | -10% $-10 | -5% $28 | +0% $66 | +5% $104 | +10% $142 |
| Rate | -1.0pp $124 | -0.5pp $95 | base $66 | +0.5pp $36 | +1.0pp $5 |
UW: 25.0% down · 7.5% · 30yr · 1.5% tax · 5.0% vac · 8.0% maint · 8.0% mgmt
Financing live
Cash to close
- Down payment
- $28,875
- Closing costs
- $3,465
- Reserves months
- —
- Total cash needed
- —
Loan-product check · same deal, 3 products live
Conventional
25% down · 7.5% · 30yr
- Down + closing
- —
- Monthly P&I
- —
- Monthly cashflow
- —
- DSCR
- —
- Eligible?
- —
Personal DTI + credit; lowest rate.
DSCR
20% down · 8.5% · 30yr
- Down + closing
- —
- Monthly P&I
- —
- Monthly cashflow
- —
- DSCR
- —
- Eligible?
- —
No personal income docs; deal must DSCR.
Hard money
10% down · 12.0% · 12mo
- Down + closing
- —
- Monthly P&I
- —
- Monthly cashflow
- —
- DSCR
- —
- Eligible?
- —
Short-term bridge; refi at stabilization.
Rent comps 8 comps
| Address | Beds | Baths | Sqft | Rent | $/sqft | DOM | Units | Dist |
|---|---|---|---|---|---|---|---|---|
| 319 16th Ave S Phenix City, AL | 3.0 | 1.0 | 854 | $975 | $1.14 | 23d | 1 | 0.22mi |
| 441 S Seale Rd Unit 03 Phenix City, AL | 2.0 | 1.0 | 750 | $500 | $0.67 | 23d | 1 | 0.23mi |
| 315 S Seale Rd Phenix City, AL | 1.0 | 1.0 | 800 | $750 | $0.94 | 23d | 1 | 0.30mi |
| 1702 12th Pl S Unit C Phenix City, AL | 2.0 | 2.0 | 900 | $825 | $0.92 | 23d | 1 | 0.67mi |
| 1200 20th Ave S Unit G Phenix City, AL | 2.0 | 1.0 | 900 | $795 | $0.88 | 15d | 1 | 0.96mi |
| 414 21st Ave Phenix City, AL | 3.0 | 1.0 | 1080 | $1,250 | $1.16 | 15d | 1 | 1.16mi |
| 2514 S Seale Rd Unit P-C8 Phenix City, AL | 2.0 | 1.0 | 850 | $775 | $0.91 | 15d | 1 | 1.35mi |
| 2514 S Seale Rd Unit P-D3 Phenix City, AL | 2.0 | 1.0 | 850 | $850 | $1.00 | 15d | 1 | 1.35mi |
Listing history 14 events
-
2026-06-21days on market $115,500 Active 19 DOM
-
2026-06-18days on market $115,500 Active 16 DOM
-
2026-06-17days on market $115,500 Active 15 DOM
-
2026-06-16days on market $115,500 Active 14 DOM
-
2026-06-15days on market $115,500 Active 13 DOM
-
2026-06-14days on market $115,500 Active 11 DOM
-
2026-06-13days on market $115,500 Active 10 DOM
-
2026-06-10days on market $115,500 Active 8 DOM
-
2026-06-09days on market $115,500 Active 7 DOM
-
2026-06-08days on market $115,500 Active 6 DOM
-
2026-06-07days on market $115,500 Active 5 DOM
-
2026-06-05days on market $115,500 Active 2 DOM
-
2026-06-03remarks 699-char remark
-
2026-06-03$115,500 Active 1 DOM
ⓘ Source: listings_history table (triggers on properties + properties_extension) + one-shot
backfill from property_details.listing_events for pre-trigger history.
Tax reassessment forecast AL · Resets to sale price
- Current annual tax
- $460 · $38/mo
- Projected year-2 tax
- $474 · $39/mo
- Expected delta
- +$13/yr (+$1/mo · 2.9%)
ⓘ Screening estimate from a state-policy table — verify with the county assessor before closing.
Climate risk First Street
- Flood 1/10 Low FEMA zone X (unshaded) · 0% chance over 30 yrs
- Wildfire 2/10 Low
- Heat 7/10 Severe 7 d/yr ≥108°F today · 19 d/yr by 30 yrs out
- Wind 6/10 Major 76% chance of damaging wind over 30 yrs
- Air quality 4/10 Moderate 4 unhealthy d/yr today · 5 by 30 yrs out
Nearby sold comps map
Loading sold comps map…
Walkable amenities ~0.75 mi
Loading nearby amenities…
Taxation est. · year 1
- Rental income
- $11,512
- − Mortgage interest
- −$6,470
- − Property taxes
- −$460
- − Insurance
- −$578
- − Repairs & maintenance
- −$921
- − Management
- −$921
- − Depreciation
- −$3,360
- Taxable loss
- −$1,197
- Est. tax savings @ 24.0%
- +$287
- After-tax cash flow
- $1,076/yr
For passive investors: Depreciation is non-cash, so a rental often shows a tax loss while cash-flowing — sheltering income. Rental losses are passive: they offset passive income freely, and up to $25,000/yr can offset ordinary (W-2) income if you actively participate and your MAGI is under $100k (phasing out to $0 by $150k); unused losses carry forward. On sale, claimed depreciation is recaptured at up to 25%, and gains may owe capital-gains tax (a 1031 exchange can defer both). Figures are a year-1 estimate at your 24.0% rate — not tax advice; consult a CPA.
Schools (NCES district)
- District
- Phenix City
- NCES district ID
- 0102700
- Math proficiency
- 22% ▼ -24.00%
- Reading proficiency
- 44% ▼ -1.00%
- Median HH income
- $36,228
- Composite
- 27.29/100
- National rank
- #7001
- State rank
- #59 of 129 in AL
Livability — Phenix City
- Score
- 60/100
- State rank
- #297
- US rank
- #19037
Category grades
Schools grade is shown separately in the Schools card above.
Census & demographics
- Census place
- Phenix City, AL
- County
- Russell County · 53,055 people
- City population
- 62,290
- Metro
- Columbus, GA-AL
- Population (ZIP)
- 21,518
- Household income
- $50,061
- Rent vs Own
- Severe rent burden
- 789.0
Population outlook (Russell County) Hauer SSP2
- Today (2025)
- 70,137 people
- By 2030
- 75,826 · +8.1%
- By 2040
- 87,858 · +25.3%
- By 2050
- 99,721 · +42.2%
- By 2075
- 128,009 · +82.5%
- By 2100
- 149,251 · +112.8%
Race, ethnicity, and origin ACS 2023
- Neighborhood character
- Diverse neighborhood (Simpson 0.58)
- Race & ethnicity
- Black 50% White 41% Hispanic / Latino 5% Two or more races 4%
- Common ancestry
- Slovak 1% Lithuanian 1% Portuguese 1%
- Foreign-born
- 3% · Canada
- Languages at home
- 95% English-only · Spanish 4%
Political lean MEDSL · Russell
- 2024 margin
- Toss-up / Even · D 50.4% · R 48.7%
- 2008→2024 swing
- -5.6pp toward R · 2008: 7.3pp · 2024: 1.7pp
- All cycles
- 2024: D+1.7 2020: D+6.4 2016: D+1.9 2012: D+11.8 2008: D+7.3
Not yet ingested
- Civics
- —
Market trends
- HPI YoY
- ▼ -47.69%
- Current HPI
- 166.9094
- Rent YoY
- ▲ 0.43%
- Metro
- Columbus, GA-AL
- State GDP YoY
- ▲ 2.94%
- F500 in state
- 4
Industry mix (Fortune 500 HQ in AL)
| Industry | F500 HQs | Revenue |
|---|---|---|
| Financial Services | 1 | $8B |
|
||
| Healthcare | 1 | $5B |
|
||
Price history
+275.1% since first listed3 events — show timeline
- 2026-06-02 Listed $115,500 EABOR
- 2009-01-02 Sold (Public Records) $11,386 Public Records
- 2000-02-18 Sold (Public Records) $30,795 Public Records
Property tax history
+4.0%/yrLatest (2025): $460 · +0.0% YoY. Source: county tax records.
Cash-flow waterfall
monthlySold comps — $/sqft
last 12 mo · ≤1 miLoading sold comps…