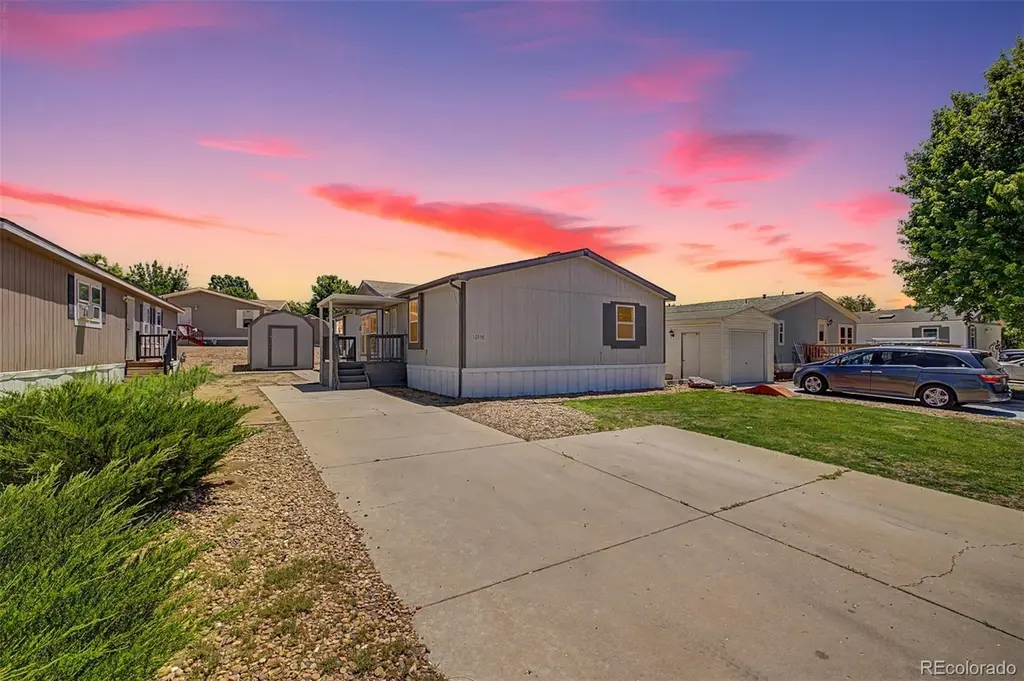
10598 Barron Cir · Firestone, CO
Flood risk No data
- FEMA flood zone
- —
- Chance of flooding over 30 yrs
- —
- Est. flood insurance / yr
- —
Fire risk No data
- Est. fire insurance / yr
- —
Heat risk No data
- Hot days now (above threshold)
- —
- Hot days in 30 yrs
- —
Wind risk No data
- Chance of severe wind over 30 yrs
- —
Air-quality risk No data
- Unhealthy air days now
- —
- Unhealthy air days in 30 yrs
- —
Risk factors via First Street. Map © Google.
Why this score? — see what drove the B grade
The composite is a weighted blend of 9 inputs, each scored 0–100. Each bar is that input's sub-score; the figure is the points it added to the 100-point composite (weight × sub-score).
- Cash flow +30.0/30.0
- 1% rule +10.0/10.0
- DSCR +10.0/10.0
- ARV discount +6.7/15.0
- Condition / age +4.0/5.0
- Schools +3.8/10.0
- Livability +3.7/5.0
- Rent growth +1.9/5.0
- Appreciation +0.0/10.0
$143,000
🖨 Deal sheet 📄 Offer letter ✓ Due diligence
Listing remarks
Welcome to Eagle Crest, where this beautifully updated 3-bedroom, 2-bath home delivers a bright, spacious feel with elevated finishes throughout. Inside, you’ll love the airy layout filled with natural light, complemented by fresh interior paint, new flooring and carpet, modern lighting, and upgraded door and cabinet hardware for a crisp, contemporary look. The kitchen is a standout—finished with white quartz countertops, a designer tile backsplash, and a clean, modern palette that feels straight out of a model home. Both bathrooms have been fully remodeled with upgraded tile, stylish vanities, and updated fixtures that bring a high-end, spa-like feel. Enjoy the lifestyle Eagle
Key facts
- Community pool
- Natural light
- Updated home
Tags
Property features AI
Finance
- Other: Lot number 227
- Financial info: Property owned by a corporation/trust
- HOA & community: Land lease in effect (monthly land lease of $1,003; lease expires September 30, 2027); Located in Eagle Crest park
Exterior
- Parking: 3 off-street parking spaces; Concrete parking surface
- Utilities: Public water; Public sewer; Electricity connected; Natural gas connected; Cable available; Phone available
- Home design: Manufactured home located in a park; Single-level (no stairs); Skirted with vinyl
- Construction: Wood siding; Composition roof
- Exterior features: Balcony; Paved public road frontage; Publicly maintained road
Interior
- Kitchen: Quartz counters; Oven; Range; Dishwasher; Refrigerator; Garbage disposal
- Bedrooms: 3 bedrooms — all on the main level
- Flooring: Carpet; Tile; Vinyl
- Bathrooms: 2 bathrooms (1 full, 1 three-quarter) — both on the main level
- Heating & cooling: Forced air heating; Central air conditioning
- Interior features: Open floor plan; High-speed internet; No stairs (single-level); Primary suite; Quartz counters; Vaulted ceilings; Walk-in closet(s); Double pane windows
- Laundry & utility: Washer; Dryer
Neighborhood map
What this means for you Summary
Snapshot
- This is a 3-bed/2.0-bath manufactured listed at $143k. Condition is rated good.
Deal economics
- At list price, monthly cash flow is $1k ($13k/yr) — positive.
- The deal already cash-flows at list — no discount required.
- Meets the 1% rule at list price ($3k rent vs $143k).
- Cap rate 15.3% vs local median 2.9% in Firestone — top-decile yield for the area; either an underpriced asset or a hidden risk that comps aren't pricing in. Stress-test before assuming the spread holds.
Location & tenants
- Location reads 73/100 on livability (#44 in CO) — a middle-class / working-renter tenant base. Strengths: employment A+, housing A+, crime A; Watch: amenities F, commute F, cost of living F.
- St. Vrain Valley School District No. Re1J (suburban): math 32% / reading 51% proficiency, ranked #23 of 86 in CO (top 27%) — families likely to look elsewhere, expect single-tenant / working-renter base with shorter leases.
- Zoned schools: Centennial Elementary (math 32% / reading 47%, grade F, #357 of 966 statewide, top 40%, 468 students, 33% FRL); Coal Ridge Middle School (math 23% / reading 46%, grade F, #106 of 270 statewide, top 42%, 800 students, 32% FRL); Mead High School (math 34% / reading 59%, grade D-, #137 of 381 statewide, top 36%, 1,119 students, 25% FRL) — zoned schools at 30% FRL track the district average.
- Market conditions: Rents soft (-2.3%/yr); 534 active listings in the ZIP; 8 comparable units currently listed for rent nearby; rentals at typical pace (median 21d on market — plan ~3-4 weeks tenant-placement turnaround); high-income renter base; 3,170 units permitted in Weld County in 2024 (278 in 5+ unit buildings).
Forward outlook
- Local home prices are declining (-3.0%/yr); year-one equity from $989 of loan paydown is wiped out by about $4k of value loss. Plan a longer hold.
- Weld County population projected at +46% by 2050 — long-run rental-demand tailwind backs the buy-and-hold thesis.
- At projected returns (-3.0% appreciation + 0.0% rent growth), your $40k cash investment doubles in ~5 years — after that, you're playing with house money.
Negotiation context
- Only 10 days on market — expect competitive offers; lowballing is unlikely to land.
Questions for the listing agent
- Is there a deadline driving the sale (1031 exchange, divorce, estate, relocation)? That informs how much negotiation room exists.
- What's the average days-on-market for RENTAL listings here right now (not sales)? A rising rental-DOM trend means longer vacancies and softer asking-rent achievability than the comps imply.
- What's the recent tenant-quality profile in this submarket — average credit score on applications, eviction rate, late-payment / NSF rate, and stable-employment percentage? A property-management company in the area should have these aggregated.
- How much new for-sale + rental construction is in the pipeline within 1–3 miles? Heavy new supply typically softens prices + rents 12–24 months out; constrained supply supports both.
Investment metrics
- 1% rule
- 1.82% ✓
- Cap rate
- 15.29%
- Cash-on-cash
- 32.15%
- DSCR
- 2.43
- GRM
- 4.6
CMA / ARV
- ARV (on-the-fly)
- $140,616
- Comps found
- 12
Show comp detail 12 sales within ~0.75 mi
| Address | Dist | Beds/Ba | Sqft | Sold | Price | $/sf | Match |
|---|---|---|---|---|---|---|---|
| 10844 Belmont St N | 0.26mi | 3/2.0 | 1,512 (0%) | 6mo | $162,500 | $107 | 82 |
| 10658 Bald Eagle Cir | 0.12mi | 4/2.0 (+1) | 1,456 (-4%) | 3mo | $125,000 | $86 | 81 |
| 10686 Baily St #153 | 0.09mi | 4/2.0 (+1) | 1,456 (-4%) | 6mo | $127,000 | $87 | 79 |
| 4616 Tilbury Ct | 0.27mi | 3/2.0 | 1,456 (-4%) | 4mo | $135,000 | $93 | 78 |
| 10540 Barron Cir | 0.11mi | 3/2.0 | 1,350 (-11%) | 1mo | $157,000 | $116 | 76 |
| 10600 Titan Ave | 0.24mi | 3/2.0 | 1,404 (-7%) | 10mo | $143,000 | $102 | 69 |
| 10846 Bailey St | 0.25mi | 3/2.0 | 1,404 (-7%) | 9mo | $125,000 | $89 | 69 |
| 10655 Titan Ave #324 | 0.26mi | 4/2.0 (+1) | 1,528 (+1%) | 18mo | $145,000 | $95 | 67 |
| 4892 Barron Cir | 0.08mi | 4/2.0 (+1) | 1,680 (+11%) | 9mo | $163,400 | $97 | 65 |
| 10655 Titan Ave | 0.26mi | 4/2.0 (+1) | 1,568 (+4%) | 18mo | $145,000 | $92 | 62 |
| 10729 Belmont St #146 | 0.15mi | 3/2.0 | 1,292 (-15%) | 11mo | $70,000 | $54 | 59 |
| 4595 Ashwood St | 0.29mi | 3/2.0 | 1,344 (-11%) | 16mo | $108,900 | $81 | 55 |
Match score weights: distance 35% · size 25% · config 20% · recency 20%. Top-matched comps best support the ARV.
Projected returns pro-forma
-3.0% appreciation · 0.0% rent growth · sell at horizon
- IRR
- 23.7%
- Equity multiple
- 1.94×
- Total profit
- $37,537
- Equity at exit
- $21,322
- IRR
- 29.6%
- Equity multiple
- 3.28×
- Total profit
- $91,267
- Equity at exit
- $12,364
Cash invested: $40,040 (down + closing). Projections, not guarantees.
Landlord ↔ Tenant lean methodology
- Overall (STATE)
- 38 Tenant-Leaning
- State Colorado
- 38 Tenant-Leaning · D+4
- County
- — inherits STATE
- City
- — inherits STATE
ZIP-level market 80504
- Rents YoY
- -2.3%
- Active inventory
- 534
- Price-to-rent
- 4.6×
Monthly cashflow live
- Estimated rent
- $2,609 high interval (Pro) →
- Mortgage (P&I)
- −$750
- Tax est. 1.5%
- −$179 /mo · $2,145/yr
- Insurance
- −$60
- HOA
- −$0
- Vacancy / Maint / Mgmt
- −$548
- Net cashflow
- $1,073
Break-even live
UW: 25.0% down · 7.5% · 30yr · 1.5% tax · 5.0% vac · 8.0% maint · 8.0% mgmt
Financing live
Cash to close
- Down payment
- $35,750
- Closing costs
- $4,290
- Reserves months
- —
- Total cash needed
- —
Loan-product check · same deal, 3 products live
Conventional
25% down · 7.5% · 30yr
- Down + closing
- —
- Monthly P&I
- —
- Monthly cashflow
- —
- DSCR
- —
- Eligible?
- —
Personal DTI + credit; lowest rate.
DSCR
20% down · 8.5% · 30yr
- Down + closing
- —
- Monthly P&I
- —
- Monthly cashflow
- —
- DSCR
- —
- Eligible?
- —
No personal income docs; deal must DSCR.
Hard money
10% down · 12.0% · 12mo
- Down + closing
- —
- Monthly P&I
- —
- Monthly cashflow
- —
- DSCR
- —
- Eligible?
- —
Short-term bridge; refi at stabilization.
Rent comps 8 comps
| Address | Beds | Baths | Sqft | Rent | $/sqft | DOM | Units | Dist |
|---|---|---|---|---|---|---|---|---|
| 10670 Jake Jabs Blvd Firestone, CO | 1.0–3.0 | 1.0–2.0 | 1036 | $2,595 | $2.50 | 13d | 26 | 0.44mi |
| 5620 Tumbleweed Ave Firestone, CO | 3.0 | 2.0 | 1747 | $3,200 | $1.83 | 21d | 1 | 0.87mi |
| 10818 Cimarron St #1202 Firestone, CO | 2.0 | 2.0 | 1823 | $2,500 | $1.37 | 21d | 1 | 1.02mi |
| 10910 Turner Blvd #70 Longmont, CO | 3.0 | 2.0 | 1152 | $1,999 | $1.74 | 21d | 1 | 1.09mi |
| 4347 Rangeview Cir Longmont, CO | 3.0–5.0 | 2.0–3.0 | 2143 | $2,995 | $1.40 | 13d | 4 | 1.12mi |
| 10692 Durango Pl Longmont, CO | 3.0 | 2.0 | 1500 | $2,395 | $1.60 | 21d | 1 | 1.24mi |
| 10426 Durango Pl Longmont, CO | 3.0 | 2.0 | 1500 | $2,350 | $1.57 | 21d | 1 | 1.27mi |
| 10489 Taylor Ave Firestone, CO | 3.0 | 2.0 | 1386 | $2,499 | $1.80 | 13d | 1 | 1.42mi |
Listing history 8 events
-
2026-06-18days on market $143,000 Active 10 DOM
-
2026-06-17days on market $143,000 Active 9 DOM
-
2026-06-16days on market $143,000 Active 8 DOM
-
2026-06-15days on market $143,000 Active 7 DOM
-
2026-06-14days on market $143,000 Active 5 DOM
-
2026-06-13days on market $143,000 Active 4 DOM
-
2026-06-09remarks 687-char remark
-
2026-06-09$143,000 Active 1 DOM
ⓘ Source: listings_history table (triggers on properties + properties_extension) + one-shot
backfill from property_details.listing_events for pre-trigger history.
Nearby sold comps map
Loading sold comps map…
Walkable amenities ~0.75 mi
Loading nearby amenities…
Taxation est. · year 1
- Rental income
- $31,304
- − Mortgage interest
- −$8,010
- − Property taxes
- −$2,145
- − Insurance
- −$715
- − Repairs & maintenance
- −$2,504
- − Management
- −$2,504
- − Depreciation
- −$4,160
- Taxable income
- $11,265
- Est. tax owed @ 24.0%
- −$2,704
- After-tax cash flow
- $10,168/yr
For passive investors: Depreciation is non-cash, so a rental often shows a tax loss while cash-flowing — sheltering income. Rental losses are passive: they offset passive income freely, and up to $25,000/yr can offset ordinary (W-2) income if you actively participate and your MAGI is under $100k (phasing out to $0 by $150k); unused losses carry forward. On sale, claimed depreciation is recaptured at up to 25%, and gains may owe capital-gains tax (a 1031 exchange can defer both). Figures are a year-1 estimate at your 24.0% rate — not tax advice; consult a CPA.
Condition & rehab AI · 12 photos
This beautifully updated 3-bedroom, 2-bath home in Eagle Crest offers a bright, spacious feel with modern finishes throughout. The kitchen and bathrooms are particularly impressive, making it a great investment opportunity.
Value-add opportunities
- Resale Paint exterior siding — Enhances curb appeal
- Both Replace carpet in bedrooms — Improves comfort and appearance
- Both Install smart home devices — Enhances convenience and marketability
Renovation cost estimate screening
Value-add ROI direction
- Resale Paint exterior siding — Enhances curb appeal ↑
- Both Replace carpet in bedrooms — Improves comfort and appearance ↑
- Both Install smart home devices — Enhances convenience and marketability ↑
ⓘ Cost ranges are severity-bucket heuristics (US national rule-of-thumb). Get contractor quotes + a written scope before underwriting a rehab budget.
Schools (NCES district)
- District
- St. Vrain Valley School District No. Re1J
- NCES district ID
- 0805370
- Math proficiency
- 32% ▼ -8.00%
- Reading proficiency
- 51% ▬ 0.00%
- Median HH income
- $71,571
- Composite
- 37.73/100
- National rank
- #4353
- State rank
- #23 of 86 in CO
Livability — Firestone
- Score
- 73/100
- State rank
- #44
- US rank
- #5060
Category grades
Schools grade is shown separately in the Schools card above.
Census & demographics
- Census place
- Firestone, CO
- County
- Weld County · 332,652 people
- City population
- 1,684
- Metro
- Greeley, CO
- Population (ZIP)
- 63,451
- Household income
- $113,643
- Rent vs Own
- Severe rent burden
- 1028.0
Population outlook (Weld County) Hauer SSP2
- Today (2025)
- 351,957 people
- By 2030
- 385,304 · +9.5%
- By 2040
- 451,818 · +28.4%
- By 2050
- 514,478 · +46.2%
- By 2075
- 648,733 · +84.3%
- By 2100
- 720,400 · +104.7%
Race, ethnicity, and origin ACS 2023
- Neighborhood character
- Predominantly White (68%)
- Race & ethnicity
- White 68% Hispanic / Latino 24% Two or more races 13% Asian 3%
- Hispanic origin (detail)
- Mexican 18%
- Common ancestry
- Lithuanian 3% Italian 2% Iranian 2%
- Foreign-born
- 8% · Canada, Vietnam
- Languages at home
- 84% English-only · Spanish 13% Other Asian/Pacific 1%
Political lean MEDSL · Weld
- 2024 margin
- Strong R (+21.0) · D 38.2% · R 59.2% · Other 2.6%
- 2008→2024 swing
- -12.2pp toward R · 2008: -8.7pp · 2024: -21.0pp
- All cycles
- 2024: R+21.0 2020: R+18.0 2016: R+22.4 2012: R+13.2 2008: R+8.7
Not yet ingested
- Civics
- —
Market trends
- HPI YoY
- ▼ -534.45%
- Current HPI
- 245.1351
- Rent YoY
- ▼ -2.34%
- Metro
- Greeley, CO
- State GDP YoY
- ▲ 1.95%
- F500 in state
- 14
Industry mix (Fortune 500 HQ in CO)
| Industry | F500 HQs | Revenue |
|---|---|---|
| Technology Distribution | 1 | $31B |
|
||
| Food / Agriculture | 1 | $18B |
|
||
| Packaging | 1 | $14B |
|
||
| Healthcare | 1 | $13B |
|
||
| Energy | 1 | $10B |
|
||
| Technology | 1 | $4B |
|
||
Price history
1 event — show timeline
- 2026-06-08 Listed $143,000 REColorado as Distributed by MLS Grid
Cash-flow waterfall
monthlySold comps — $/sqft
last 12 mo · ≤1 miLoading sold comps…