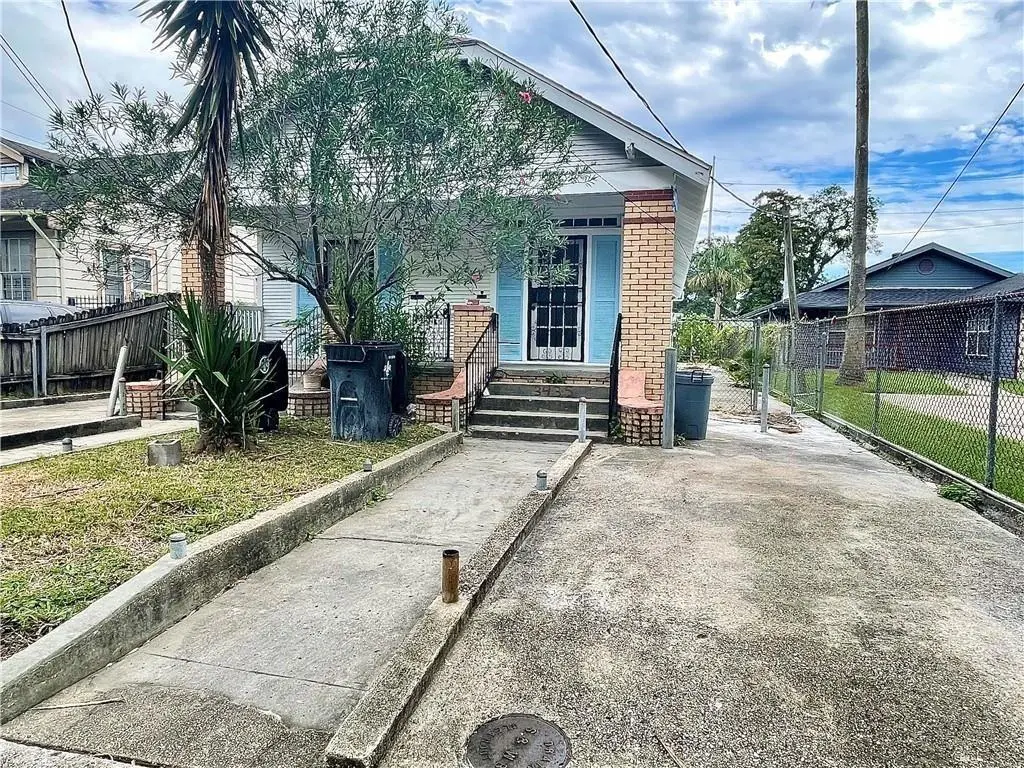
 Duplex
3435 37 New Orleans St · New Orleans, LA
Flood risk 8/10 · Major
- FEMA flood zone
- X
- Chance of flooding over 30 yrs
- 0.6%
- Est. flood insurance / yr
- $507 – $1,088
Fire risk 1/10 · Minimal
- Est. fire insurance / yr
- $1,269 – $2,357
Heat risk 10/10 · Severe
- Hot days now (above 108°F)
- 7 days/yr
- Hot days in 30 yrs
- 20 days/yr
Wind risk 10/10 · Severe
- Chance of severe wind over 30 yrs
- 99.0%
Air-quality risk 4/10 · Minor
- Unhealthy air days now
- 4 days/yr
- Unhealthy air days in 30 yrs
- 4 days/yr
Risk factors via First Street. Map © Google.
Why this score? — see what drove the B- grade
The composite is a weighted blend of 9 inputs, each scored 0–100. Each bar is that input's sub-score; the figure is the points it added to the 100-point composite (weight × sub-score).
- Cash flow +28.5/30.0
- DSCR +10.0/10.0
- ARV discount +8.8/15.0
- 1% rule +7.3/10.0
- Livability +4.0/5.0
- Condition / age +2.5/5.0
- Rent growth +2.3/5.0
- Schools +1.6/10.0
- Appreciation +0.0/10.0
$219,900
🖨 Deal sheet 📄 Offer letter ✓ Due diligence
Multi-family units
County records classify this as Multi-Family (2-4 Unit). Listing-text estimate: 2 units. confirmed
Listing remarks MLS
STABILIZED, CASH-FLOWING DUPLEX TURNKEY PERFORMANCE FROM DAY ONE For the disciplined investor who values immediate yield and controlled risk, this fully occupied income-producing asset delivers measurable performance from closing. Both units are leased, creating instant cash flow with no lease-up period and no renovation delays. Each side features two bedrooms and one full bath, enhanced with wood laminate flooring, fresh paint, and updated appliances reducing deferred maintenance exposure. This is a true turnkey rental positioned for operational efficiency and predictable returns. Tenants are responsible for utilities and lawn maintenance, preserving margins and minimizing owner overhead. The spacious yard increases tenant desirability while supporting long-term retention and asset value stability. Whether you are expanding a buy-and-hold portfolio or executing a house hack strategy live in one unit while the other offsets your mortgage this property provides strategic flexibility with income already in place. SOLD AS IS W/ WOR ACT AOS. MEASUREMENTS ARE APPROXIMATE. BUYER MUST VERIFY.
Key facts
- Updated appliances
- Spacious yard
- Cash flowing duplex
Tags
Neighborhood map
What this means for you Summary
Snapshot
- This is a 2 × 2-bed/1.0-bath units multifamily listed at $220k.
Deal economics
- At list price, monthly cash flow is $655 ($8k/yr) — positive. Per door: $328/mo.
- The deal already cash-flows at list — no discount required.
- Meets the 1% rule at list price ($3k rent vs $220k).
- Recommended offer: $194k (12.0% below list) — sets the bar for market timing.
- Cap rate 10.2% vs local median 4.4% in New Orleans — top-decile yield for the area; either an underpriced asset or a hidden risk that comps aren't pricing in. Stress-test before assuming the spread holds.
Location & tenants
- Location reads 81/100 on livability (#3 in LA, #1,383 nationally) — a professional / high-income tenant draw. Strengths: amenities A+, commute A+, health & safety A+; Watch: crime C-, employment D.
- Orleans Parish (urban): math 11% / reading 27% proficiency, ranked #69 of 98 in LA (top 70%) — low school quality limits family demand, transient renter base, plan for 1-2y turnover; 68% free/reduced lunch — lower-income household profile, screen leases tightly.
- Market conditions: Rents soft (-0.6%/yr); 332 active listings in the ZIP; 40 comparable units currently listed for rent nearby; rentals at typical pace (median 24d on market — plan ~3-4 weeks tenant-placement turnaround); 710 units permitted in Orleans Parish in 2024 (244 in 5+ unit buildings).
- At $2,696/mo this rent would consume 65% of the median local household income ($49k/yr) (locally 2150% of renters already pay >50% of income on rent) — very limited rent-growth headroom before tenants either downsize or default.
Forward outlook
- Local home prices are declining (-3.0%/yr); year-one equity from $2k of loan paydown is wiped out by about $7k of value loss. Plan a longer hold.
- Orleans County population projected at +61% by 2050 — long-run rental-demand tailwind backs the buy-and-hold thesis.
Negotiation context
- It's been on market 123 days — a 12% lower offer ($194k) is reasonable based on typical stale-listing flexibility.
- 11 sale attempts since 19y ago; this cycle's ask is 5% above the opening price — seller raised mid-cycle; expect resistance to lowballs.
- Current owner paid $120k; list at $220k implies a 83% gain — meaningful room to come down on a strong offer.
Risks & watch-outs
- Watch-outs: flood insurance adds $66/mo.
- Climate carrying-cost: severe flood risk; severe wind risk, 99% chance of damaging wind over 30y; extreme-heat days projected 7→20/yr by 2055 (HVAC capex compounding) — expect insurance premiums to compound above CPI over the hold.
Questions for the listing agent
- It's been on market 123 days. Have you received any prior offers? Is the seller open to a 12% concession, seller financing, or rate buy-down credit?
- Can we see the unit-by-unit rent roll, current vacancy, and any below-market leases? What's the average tenancy length?
- What capital expenditures (roof, boiler, parking lot, exteriors) have been made in the last 5 years, and what's planned in the next 2?
- Built in 1968 — when were the roof, HVAC, electrical panel, plumbing, and water heater last replaced?
- What's the actual annual flood-insurance premium (NFIP or private), and is the property in a SFHA with mandatory coverage?
- Why hasn't it sold? Are there any deal-killer items the seller is aware of (foundation, flood, title, zoning, code violations)?
- Is there a deadline driving the sale (1031 exchange, divorce, estate, relocation)? That informs how much negotiation room exists.
- What's the average days-on-market for RENTAL listings here right now (not sales)? A rising rental-DOM trend means longer vacancies and softer asking-rent achievability than the comps imply.
- What's the recent tenant-quality profile in this submarket — average credit score on applications, eviction rate, late-payment / NSF rate, and stable-employment percentage? A property-management company in the area should have these aggregated.
- How much new apartment / multifamily construction is in the pipeline within 1–3 miles? Heavy new supply (>2% of stock underway) typically softens rents 12–24 months out; light construction supports rent growth.
Investment metrics
- 1% rule
- 1.23% ✓
- Cap rate
- 10.23%
- Cash-on-cash
- 14.06%
- DSCR
- 1.63
- GRM
- 6.8
CMA / ARV
- ARV (median comp)
- $226,404
- List price
- $219,900
- Delta
- -2.87%
- Verdict
- FAIR
- Comps
- 20 within 1.0 mi
Show comp detail 10 sales within ~0.75 mi
| Address | Dist | Beds/Ba | Sqft | Sold | Price | $/sf | Match |
|---|---|---|---|---|---|---|---|
| 3036 38 Allen St | 0.12mi | 3/3.0 (-1) | 1,500 (+2%) | 21mo | $347,900 | $232 | 64 |
| 2127-29 Mandolin St | 0.75mi | 4/2.0 | 1,474 (+1%) | 3mo | $230,000 | $156 | 61 |
| 3501 03 Paris Ave | 0.38mi | 4/2.0 | 1,534 (+5%) | 18mo | $152,000 | $99 | 60 |
| 2714 16 New Orleans St | 0.45mi | 4/2.0 | 1,623 (+11%) | 4mo | $230,000 | $142 | 58 |
| 1938-1940 Industry St | 0.43mi | 4/2.0 | 1,620 (+11%) | 16mo | $264,000 | $163 | 49 |
| 3022 24 Paris Ave | 0.46mi | 4/2.0 | 1,351 (-8%) | 23mo | $199,000 | $147 | 46 |
| 2416 18 Annette St | 0.73mi | 4/2.0 | 1,400 (-4%) | 23mo | $167,000 | $119 | 40 |
| 2657 59 Bruxelles St | 0.58mi | 5/3.0 (+1) | 1,580 (+8%) | 16mo | $278,250 | $176 | 38 |
| 3638 40 Elysian Fields Ave | 0.50mi | 4/2.0 | 1,671 (+14%) | 18mo | $289,000 | $173 | 38 |
| 2258 60 Pleasure St | 0.73mi | 5/2.0 (+1) | 1,600 (+9%) | 17mo | $174,000 | $109 | 32 |
Match score weights: distance 35% · size 25% · config 20% · recency 20%. Top-matched comps best support the ARV.
Projected returns pro-forma
-3.0% appreciation · 0.0% rent growth · sell at horizon
- IRR
- -0.8%
- Equity multiple
- 0.97×
- Total profit
- $-1,800
- Equity at exit
- $32,788
- IRR
- 5.5%
- Equity multiple
- 1.35×
- Total profit
- $21,675
- Equity at exit
- $19,013
Cash invested: $61,572 (down + closing). Projections, not guarantees.
Landlord ↔ Tenant lean methodology
- Overall (STATE)
- 90 Strongly Landlord-Friendly
- State Louisiana
- 90 Strongly Landlord-Friendly · R+12
- County
- — inherits STATE
- City
- — inherits STATE
ZIP-level market 70122
- Rents YoY
- -0.6%
- Active inventory
- 332
- Price-to-rent
- 13.6×
Monthly cashflow live
- Estimated rent
- $2,696 high interval (Pro) →
- Mortgage (P&I)
- −$1,153
- Tax from tax record
- −$164 /mo · $1,962/yr
- Insurance
- −$92
- Flood insurance flood zone
- −$66 /mo · $798/yr
- HOA
- −$0
- Vacancy / Maint / Mgmt
- −$566
- Net cashflow
- $655
Break-even live
2-unit breakdown (identical units grouped — click to expand)
| Units | Beds | Baths | Est. rent |
|---|---|---|---|
| 2× units | 2 | 1 | $2,696 |
| #1 | 2 | 1 | $1,348 |
| #2 | 2 | 1 | $1,348 |
| Total (2 units) | $2,696 | ||
UW: 25.0% down · 7.5% · 30yr · 1.5% tax · 5.0% vac · 8.0% maint · 8.0% mgmt
Financing live
Cash to close
- Down payment
- $54,975
- Closing costs
- $6,597
- Reserves months
- —
- Total cash needed
- —
Loan-product check · same deal, 3 products live
Conventional
25% down · 7.5% · 30yr
- Down + closing
- —
- Monthly P&I
- —
- Monthly cashflow
- —
- DSCR
- —
- Eligible?
- —
Personal DTI + credit; lowest rate.
DSCR
20% down · 8.5% · 30yr
- Down + closing
- —
- Monthly P&I
- —
- Monthly cashflow
- —
- DSCR
- —
- Eligible?
- —
No personal income docs; deal must DSCR.
Hard money
10% down · 12.0% · 12mo
- Down + closing
- —
- Monthly P&I
- —
- Monthly cashflow
- —
- DSCR
- —
- Eligible?
- —
Short-term bridge; refi at stabilization.
Rent comps 40 comps
| Address | Beds | Baths | Sqft | Rent | $/sqft | DOM | Units | Dist |
|---|---|---|---|---|---|---|---|---|
| 3607 Havana St New Orleans, LA | 3.0 | 2.0 | 1693 | $1,488 | $0.88 | 17d | 1 | 0.23mi |
| 3624 Havana St New Orleans, LA | 3.0 | 1.0 | 1388 | $1,875 | $1.35 | 16d | 1 | 0.26mi |
| 3515 Saint Anthony Ave New Orleans, LA | 3.0 | 2.0 | 1366 | $2,500 | $1.83 | 23d | 1 | 0.27mi |
| 3021 Republic St New Orleans, LA | 4.0 | 2.0 | 1125 | $2,200 | $1.96 | 23d | 1 | 0.29mi |
| 2338 40 Annette St New Orleans, LA | 3.0 | 1.0 | 1150 | $1,385 | $1.20 | 20d | 1 | 0.33mi |
| 3023 Bruxelles St New Orleans, LA | 3.0 | 1.0 | 960 | $2,200 | $2.29 | 14d | 1 | 0.35mi |
| 1933 Industry St New Orleans, LA | 3.0 | 2.0 | 1400 | $1,595 | $1.14 | 16d | 1 | 0.40mi |
| 2910 Bruxelles St New Orleans, LA | 3.0 | 2.0 | 1074 | $1,600 | $1.49 | 3d | 1 | 0.43mi |
| 2817 Annette St New Orleans, LA | 3.0 | 1.0 | 1100 | $1,350 | $1.23 | 23d | 1 | 0.45mi |
| 2817 Paris Ave New Orleans, LA | 3.0 | 1.0 | 1018 | $1,700 | $1.67 | 20d | 1 | 0.50mi |
| 2152 Abundance St Unit 2152 New Orleans, LA | 3.0 | 2.0 | 1100 | $1,599 | $1.45 | 3d | 1 | 0.51mi |
| 3327 Elysian Fields Ave New Orleans, LA | 3.0 | 1.0 | 1200 | $1,300 | $1.08 | 23d | 1 | 0.52mi |
| 1996 Hope St New Orleans, LA | 3.0 | 1.0 | 910 | $1,550 | $1.70 | 3d | 1 | 0.55mi |
| 2310 George Nick Connor Dr New Orleans, LA | 3.0 | 2.0 | 1050 | $1,600 | $1.52 | 23d | 1 | 0.56mi |
| 3907 Elysian Fields Ave New Orleans, LA | 3.0 | 2.0 | 1652 | $3,000 | $1.82 | 23d | 1 | 0.66mi |
| 3228 Pauger St New Orleans, LA | 5.0 | 2.0 | 1600 | $2,100 | $1.31 | 23d | 1 | 0.68mi |
| 1818 Paul Morphy St Unit B New Orleans, LA | 3.0 | 2.0 | 1065 | $1,800 | $1.69 | 23d | 1 | 0.69mi |
| 2632 Oreilly St New Orleans, LA | 3.0 | 1.5 | 950 | $1,450 | $1.53 | 23d | 1 | 0.74mi |
| 2338 Annette St Unit 1 New Orleans, LA | 3.0 | 1.0 | 1150 | $1,400 | $1.22 | 20d | 1 | 0.76mi |
| 3540 Clermont Dr New Orleans, LA | 3.0 | 2.0 | 1248 | $1,975 | $1.58 | 23d | 1 | 0.80mi |
| 1486 Mandolin St New Orleans, LA | 3.0 | 2.0 | 1497 | $1,900 | $1.27 | 3d | 1 | 0.82mi |
| 4111 Jumonville St New Orleans, LA | 3.0 | 2.5 | 1543 | $2,300 | $1.49 | 10d | 1 | 0.83mi |
| 3622 Buchanan St Unit 3622 New Orleans, LA | 3.0 | 1.0 | 950 | $1,525 | $1.61 | 23d | 1 | 0.84mi |
| 1735 N Tonti St New Orleans, LA | 3.0 | 1.0 | 1197 | $1,650 | $1.38 | 23d | 1 | 0.89mi |
| 3702 Trafalgar St New Orleans, LA | 3.0 | 2.0 | 1428 | $2,350 | $1.65 | 16d | 1 | 0.95mi |
| 2509 Sage St New Orleans, LA | 3.0 | 1.0 | 1250 | $1,650 | $1.32 | 21d | 1 | 0.98mi |
| 4736 Saint Anthony Ave New Orleans, LA | 3.0 | 1.0 | 1100 | $1,800 | $1.64 | 16d | 1 | 1.00mi |
| 4229 Buchanan St New Orleans, LA | 3.0 | 2.0 | 1235 | $2,250 | $1.82 | 23d | 1 | 1.00mi |
| 4815 Warrington Dr New Orleans, LA | 3.0 | 2.0 | 1652 | $2,150 | $1.30 | 16d | 1 | 1.03mi |
| 4618 Marigny St New Orleans, LA | 3.0 | 1.0 | 1320 | $1,900 | $1.44 | 23d | 1 | 1.05mi |
| 1938 N Johnson St Unit 38 New Orleans, LA | 3.0 | 2.0 | 1844 | $2,400 | $1.30 | 23d | 1 | 1.06mi |
| 2115 Elysian Fields Ave Unit 2115 New Orleans, LA | 3.0 | 1.0 | 1100 | $1,450 | $1.32 | 23d | 1 | 1.06mi |
| 1936 N Johnson St Unit 36 New Orleans, LA | 3.0 | 2.0 | 1844 | $2,400 | $1.30 | 23d | 1 | 1.06mi |
| 2107 Elysian Fields Ave New Orleans, LA | 4.0 | 2.0 | 1794 | $1,650 | $0.92 | 3d | 1 | 1.08mi |
| 1525 N Broad St New Orleans, LA | 3.0 | 1.0 | 1100 | $1,600 | $1.45 | 23d | 1 | 1.10mi |
| 2329 Laharpe St New Orleans, LA | 3.0 | 1.0 | 1250 | $1,000 | $0.80 | 20d | 1 | 1.12mi |
| 2647 Myrtle St Unit 2647 New Orleans, LA | 4.0 | 2.0 | 1445 | $2,550 | $1.76 | 43d | 1 | 1.14mi |
| 2115 Mandeville St New Orleans, LA | 3.0 | 2.0 | 1400 | $1,650 | $1.18 | 23d | 1 | 1.14mi |
| 2222 Saint Roch Ave New Orleans, LA | 3.0 | 1.0 | 900 | $1,200 | $1.33 | 23d | 1 | 1.14mi |
| 2646 Elder St New Orleans, LA | 3.0 | 3.0 | 1284 | $2,200 | $1.71 | 17d | 1 | 1.15mi |
Listing history 42 events
-
2026-06-18days on market $219,900 Active 123 DOM
-
2026-06-17days on market $219,900 Active 122 DOM
-
2026-06-16days on market $219,900 Active 121 DOM
-
2026-06-15days on market $219,900 Active 120 DOM
-
2026-06-13days on market $219,900 Active 118 DOM
-
2026-06-10days on market $219,900 Active 115 DOM
-
2026-06-09days on market $219,900 Active 114 DOM
-
2026-06-08days on market $219,900 Active 113 DOM
-
2026-06-07days on market $219,900 Active 112 DOM
-
2026-06-05days on market $219,900 Active 109 DOM
-
2026-06-03days on market $219,900 Active 108 DOM
-
2026-06-02days on market $219,900 Active 107 DOM
-
2026-06-01days on market $219,900 Active 106 DOM
-
2026-05-31days on market $219,900 Active 105 DOM
-
2026-03-10price $219,900 1102-char remark
Show marketing remark (1102 chars)
STABILIZED, CASH-FLOWING DUPLEX TURNKEY PERFORMANCE FROM DAY ONE For the disciplined investor who values immediate yield and controlled risk, this fully occupied income-producing asset delivers measurable performance from closing. Both units are leased, creating instant cash flow with no lease-up period and no renovation delays. Each side features two bedrooms and one full bath, enhanced with wood laminate flooring, fresh paint, and updated appliances reducing deferred maintenance exposure. This is a true turnkey rental positioned for operational efficiency and predictable returns. Tenants are responsible for utilities and lawn maintenance, preserving margins and minimizing owner overhead. The spacious yard increases tenant desirability while supporting long-term retention and asset value stability. Whether you are expanding a buy-and-hold portfolio or executing a house hack strategy live in one unit while the other offsets your mortgage this property provides strategic flexibility with income already in place. SOLD AS IS W/ WOR ACT AOS. MEASUREMENTS ARE APPROXIMATE. BUYER MUST VERIFY.
-
2026-02-15$209,900 Active 1102-char remark
Show marketing remark (1102 chars)
STABILIZED, CASH-FLOWING DUPLEX TURNKEY PERFORMANCE FROM DAY ONE For the disciplined investor who values immediate yield and controlled risk, this fully occupied income-producing asset delivers measurable performance from closing. Both units are leased, creating instant cash flow with no lease-up period and no renovation delays. Each side features two bedrooms and one full bath, enhanced with wood laminate flooring, fresh paint, and updated appliances reducing deferred maintenance exposure. This is a true turnkey rental positioned for operational efficiency and predictable returns. Tenants are responsible for utilities and lawn maintenance, preserving margins and minimizing owner overhead. The spacious yard increases tenant desirability while supporting long-term retention and asset value stability. Whether you are expanding a buy-and-hold portfolio or executing a house hack strategy live in one unit while the other offsets your mortgage this property provides strategic flexibility with income already in place. SOLD AS IS W/ WOR ACT AOS. MEASUREMENTS ARE APPROXIMATE. BUYER MUST VERIFY.
-
2024-10-25historical $1,400
-
2024-10-04$1,400
-
2024-06-04soldstatus $120,000
-
2024-05-30soldstatus $120,000 Closed
-
2024-05-07historical Active Under Contract
-
2024-04-21$135,000
-
2024-04-21$135,000
-
2024-04-21$135,000 Active
-
2023-11-02price $150,000
-
2023-10-24price $160,000
-
2023-09-20price $185,000
-
2023-08-09price $200,000
-
2023-07-11$150,000
-
2015-11-04historical
-
2015-10-16price $130,000
-
2015-07-23price $135,000
-
2015-06-30price $145,000
-
2015-06-22$135,000 Active
-
2015-06-22$130,000
-
2007-08-15soldstatus $148,300
-
2007-08-10soldstatus $148,300
-
2007-05-04$139,900
-
2007-05-04$139,900
-
1986-05-01soldstatus $67,000
ⓘ Source: listings_history table (triggers on properties + properties_extension) + one-shot
backfill from property_details.listing_events for pre-trigger history.
Tax reassessment forecast LA · Resets to sale price
- Current annual tax
- $1,962 · $164/mo
- Projected year-2 tax
- $1,962 · $164/mo
- Expected delta
- $0/yr ($0/mo · 0.0%)
ⓘ Screening estimate from a state-policy table — verify with the county assessor before closing.
Climate risk First Street
- Flood 8/10 Severe FEMA zone X · 60% chance over 30 yrs
- Wildfire 1/10 Low
- Heat 10/10 Extreme 7 d/yr ≥108°F today · 20 d/yr by 30 yrs out
- Wind 10/10 Extreme 99% chance of damaging wind over 30 yrs
- Air quality 4/10 Moderate 4 unhealthy d/yr today · 4 by 30 yrs out
Nearby sold comps map
Loading sold comps map…
Walkable amenities ~0.75 mi
Loading nearby amenities…
Taxation est. · year 1
- Rental income
- $32,352
- − Mortgage interest
- −$12,318
- − Property taxes
- −$1,962
- − Insurance
- −$1,897
- − Repairs & maintenance
- −$2,588
- − Management
- −$2,588
- − Depreciation
- −$6,397
- Taxable income
- $4,602
- Est. tax owed @ 24.0%
- −$1,104
- After-tax cash flow
- $6,756/yr
For passive investors: Depreciation is non-cash, so a rental often shows a tax loss while cash-flowing — sheltering income. Rental losses are passive: they offset passive income freely, and up to $25,000/yr can offset ordinary (W-2) income if you actively participate and your MAGI is under $100k (phasing out to $0 by $150k); unused losses carry forward. On sale, claimed depreciation is recaptured at up to 25%, and gains may owe capital-gains tax (a 1031 exchange can defer both). Figures are a year-1 estimate at your 24.0% rate — not tax advice; consult a CPA.
Schools (NCES district)
- District
- Orleans Parish
- NCES district ID
- 2201170
- Math proficiency
- 11% ▼ -52.00%
- Reading proficiency
- 27% ▼ -46.00%
- Median HH income
- $37,011
- Composite
- 15.78/100
- National rank
- #9271
- State rank
- #69 of 98 in LA
Livability — New Orleans
- Score
- 81/100
- State rank
- #3
- US rank
- #1383
Category grades
Schools grade is shown separately in the Schools card above.
Census & demographics
- Census place
- New Orleans, LA
- County
- Orleans Parish · 338,817 people
- City population
- 338,817
- Metro
- New Orleans-Metairie, LA
- Population (ZIP)
- 35,253
- Household income
- $49,455
- Rent vs Own
- Severe rent burden
- 2150.0
Population outlook (Orleans County) Hauer SSP2
- Today (2025)
- 513,025 people
- By 2030
- 575,781 · +12.2%
- By 2040
- 700,174 · +36.5%
- By 2050
- 826,541 · +61.1%
- By 2075
- 1,123,374 · +119.0%
- By 2100
- 1,355,609 · +164.2%
Race, ethnicity, and origin ACS 2023
- Neighborhood character
- Predominantly Black (69%)
- Race & ethnicity
- Black 69% White 18% Two or more races 7% Hispanic / Latino 6% Asian 1%
- Hispanic origin (detail)
- Mexican 1%
- Common ancestry
- Lithuanian 4% Italian 2% Slovak 1%
- Foreign-born
- 4% · Canada, China
- Languages at home
- 92% English-only · Spanish 5% Chinese 1% French/Haitian/Cajun 1%
Political lean MEDSL · Orleans
- 2024 margin
- Solid D (+67.0) · D 82.2% · R 15.2% · Other 2.7%
- 2008→2024 swing
- +6.7pp toward D · 2008: 60.3pp · 2024: 67.0pp
- All cycles
- 2024: D+67.0 2020: D+68.2 2016: D+66.2 2012: D+62.5 2008: D+60.3
Not yet ingested
- Civics
- —
Market trends
- HPI YoY
- ▼ -222.37%
- Current HPI
- 231.9921
- Rent YoY
- ▼ -0.61%
- Metro
- New Orleans-Metairie, LA
- State GDP YoY
- ▲ 3.29%
- F500 in state
- 10
Industry mix (Fortune 500 HQ in LA)
| Industry | F500 HQs | Revenue |
|---|---|---|
| Telecommunications | 2 | $23B |
|
||
| Utilities | 1 | $12B |
|
||
| Wholesale / Distribution | 1 | $5B |
|
||
| Advertising | 1 | $2B |
|
||
Price history
+228.2% since first listed28 events — show timeline
- 2026-03-10 Price Changed $219,900 AcadianaMLS
- 2026-03-10 Price Changed $219,900 GSREIN
- 2026-02-15 Listed $209,900 GSREIN
- 2026-02-15 Listed $209,900 AcadianaMLS
- 2024-10-25 Rental Removed $1,400 GSREIN
- 2024-10-04 Listed for Rent $1,400 GSREIN
- 2024-06-04 Sold (Public Records) $120,000 Public Records
- 2024-05-30 Sold (MLS) $120,000 GSREIN
- 2024-05-07 Contingent — GSREIN
- 2024-04-21 Listed $135,000 GSREIN
- 2024-04-21 Listed $135,000 AcadianaMLS
- 2024-04-21 Listed $135,000 AcadianaMLS
- 2023-11-02 Price Changed $150,000 GSREIN
- 2023-10-24 Price Changed $160,000 GSREIN
- 2023-09-20 Price Changed $185,000 GSREIN
- 2023-08-09 Price Changed $200,000 GSREIN
- 2023-07-11 Listed $150,000 AcadianaMLS
- 2015-11-04 Listing Removed — GSREIN
- 2015-10-16 Price Changed $130,000 GSREIN
- 2015-07-23 Price Changed $135,000 GSREIN
- 2015-06-30 Price Changed $145,000 GSREIN
- 2015-06-22 Listed $135,000 GSREIN
- 2015-06-22 Listed $130,000 AcadianaMLS
- 2007-08-15 Sold (Public Records) $148,300 Public Records
- 2007-08-10 Sold (MLS) $148,300 GSREIN
- 2007-05-04 Listed $139,900 AcadianaMLS
- 2007-05-04 Listed $139,900 GSREIN
- 1986-05-01 Sold (Public Records) $67,000 Public Records
Property tax history
+0.3%/yrLatest (2026): $1,962 · +1.1% YoY. Source: county tax records.
Cash-flow waterfall
monthlySold comps — $/sqft
last 12 mo · ≤1 miLoading sold comps…