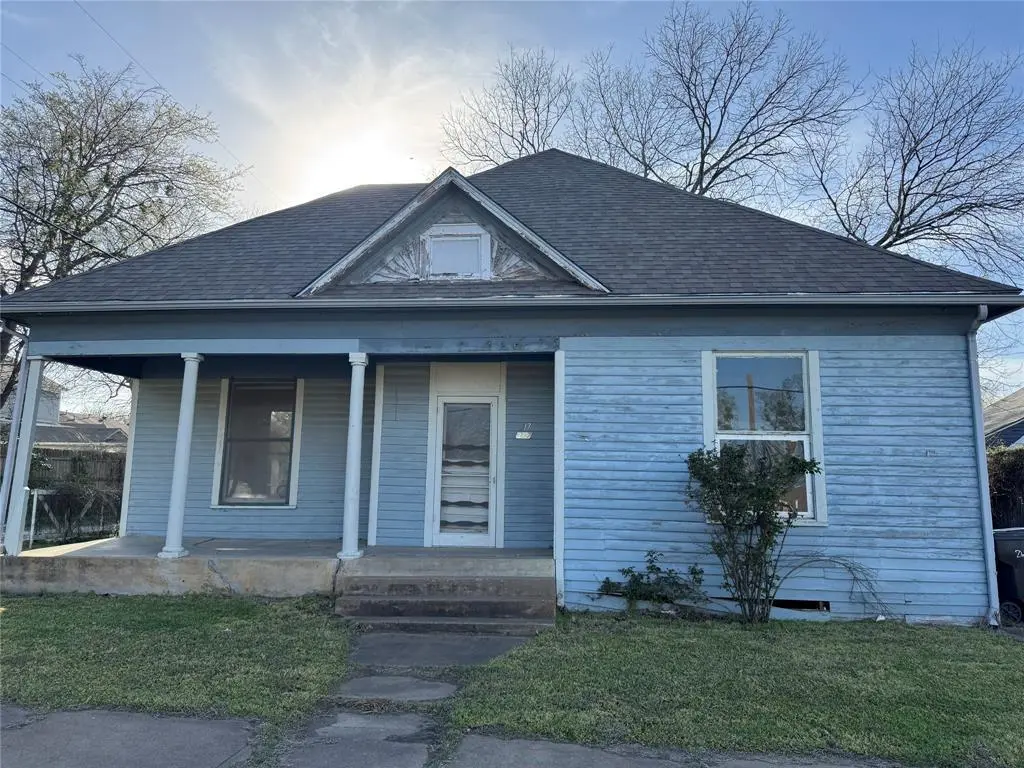
317 Scullin · Denison, TX
Flood risk 1/10 · Minimal
- FEMA flood zone
- X (unshaded)
- Chance of flooding over 30 yrs
- 0.0%
- Est. flood insurance / yr
- $507 – $1,088
Fire risk 4/10 · Minor
- Est. fire insurance / yr
- $1,222 – $2,270
Heat risk 6/10 · Moderate
- Hot days now (above 109°F)
- 7 days/yr
- Hot days in 30 yrs
- 21 days/yr
Wind risk 4/10 · Minor
- Chance of severe wind over 30 yrs
- 19.0%
Air-quality risk 3/10 · Minor
- Unhealthy air days now
- 3 days/yr
- Unhealthy air days in 30 yrs
- 3 days/yr
Risk factors via First Street. Map © Google.
Why this score? — see what drove the B- grade
The composite is a weighted blend of 9 inputs, each scored 0–100. Each bar is that input's sub-score; the figure is the points it added to the 100-point composite (weight × sub-score).
- Cash flow +30.0/30.0
- DSCR +10.0/10.0
- 1% rule +9.5/10.0
- ARV discount +7.5/15.0
- Schools +3.7/10.0
- Livability +3.7/5.0
- Rent growth +2.5/5.0
- Condition / age +2.2/5.0
- Appreciation +0.0/10.0
$94,000
🖨 Deal sheet 📄 Offer letter ✓ Due diligence
Listing remarks MLS
Investor special in the heart of Denison, Texas! This 2-bedroom, 1-bath home presents a prime opportunity for investors, flippers, or buyers ready to add value in a central, convenient location. Situated near local dining, shopping, schools, and just minutes from downtown Denison, this property offers both visibility and accessibility. With solid bones and endless potential, it’s ready for renovation and customization to maximize returns. Whether you’re planning a fix-and-flip, long-term rental, or affordable starter home project, this is your chance to invest in a growing area with strong demand and upside opportunity.
Key facts
- Near schools
- Solid bones
- Ready for renovation
Tags
Neighborhood map
What this means for you Summary
Snapshot
- This is a 2-bed/1.0-bath single-family listed at $94k. Condition is rated fair.
Deal economics
- At list price, monthly cash flow is $429 ($5k/yr) — positive.
- The deal already cash-flows at list — no discount required.
- Meets the 1% rule at list price ($1k rent vs $94k).
- Recommended offer: $83k (12.0% below list) — sets the bar for market timing.
- Cap rate 11.8% vs local median 3.8% in Denison — top-decile yield for the area; either an underpriced asset or a hidden risk that comps aren't pricing in. Stress-test before assuming the spread holds.
Location & tenants
- Location reads 73/100 on livability (#221 in TX) — a middle-class / working-renter tenant base. Strengths: cost of living A+, housing A+, crime A; Watch: health & safety D+, schools D-, amenities F.
- Denison ISD (urban): math 43% / reading 44% proficiency, ranked #315 of 826 in TX (top 38%) — families likely to look elsewhere, expect single-tenant / working-renter base with shorter leases.
- Market conditions: Rents flat; 485 active listings in the ZIP; 40 comparable units currently listed for rent nearby; rentals lingering (median 44d on market — plan ~5-8 weeks vacancy on turnover, expect pricing pressure); 55% of comp listings sitting > 30 days — soft ceiling on asking rent; 2,272 units permitted in Grayson County in 2024 (750 in 5+ unit buildings).
Forward outlook
- Local home prices are declining (-3.0%/yr); year-one equity from $650 of loan paydown is wiped out by about $3k of value loss. Plan a longer hold.
- Grayson County population projected at +12% by 2050 — modest demand growth; plan on rents tracking national, not racing it.
- At projected returns (-3.0% appreciation + 0.1% rent growth), your $26k cash investment doubles in ~8 years — after that, you're playing with house money.
Negotiation context
- It's been on market 121 days — a 12% lower offer ($83k) is reasonable based on typical stale-listing flexibility.
Risks & watch-outs
- Watch-outs: built in 1900 — expect roof / HVAC / electrical / plumbing capex.
- Climate carrying-cost: extreme-heat days projected 7→21/yr by 2055 (HVAC capex compounding) — expect insurance premiums to compound above CPI over the hold.
Questions for the listing agent
- It's been on market 121 days. Have you received any prior offers? Is the seller open to a 12% concession, seller financing, or rate buy-down credit?
- Have any recent inspections been done? Can we get a copy of the seller's disclosures and any deferred-maintenance estimates?
- Built in 1900 — when were the roof, HVAC, electrical panel, plumbing, and water heater last replaced?
- Why hasn't it sold? Are there any deal-killer items the seller is aware of (foundation, flood, title, zoning, code violations)?
- Is there a deadline driving the sale (1031 exchange, divorce, estate, relocation)? That informs how much negotiation room exists.
- Schools are D-rated, which usually means shorter tenancies and higher turnover. Who's the typical renter profile here, and what's been the actual vacancy rate?
- What's the average days-on-market for RENTAL listings here right now (not sales)? A rising rental-DOM trend means longer vacancies and softer asking-rent achievability than the comps imply.
- What's the recent tenant-quality profile in this submarket — average credit score on applications, eviction rate, late-payment / NSF rate, and stable-employment percentage? A property-management company in the area should have these aggregated.
- How much new for-sale + rental construction is in the pipeline within 1–3 miles? Heavy new supply typically softens prices + rents 12–24 months out; constrained supply supports both.
Investment metrics
- 1% rule
- 1.45% ✓
- Cap rate
- 11.77%
- Cash-on-cash
- 19.56%
- DSCR
- 1.87
- GRM
- 5.7
CMA / ARV
- ARV (median comp)
- $203,964
- List price
- $94,000
- Delta
- -53.91%
- Verdict
- UNDERPRICED
- Comps
- 20 within 1.0 mi
Show comp detail 12 sales within ~0.75 mi
| Address | Dist | Beds/Ba | Sqft | Sold | Price | $/sf | Match |
|---|---|---|---|---|---|---|---|
| 811 W Woodard St | 0.12mi | 2/2.0 | 1,202 (-3%) | 0mo | $199,000 | $166 | 86 |
| 917 W Sears St | 0.06mi | 3/1.0 (+1) | 1,197 (-3%) | 3mo | $99,900 | $83 | 85 |
| 1231 W Woodard St | 0.35mi | 2/1.0 | 1,257 (+2%) | 2mo | $150,000 | $119 | 79 |
| 1326 W Sears St | 0.41mi | 2/1.0 | 1,318 (+7%) | 2mo | $118,900 | $90 | 67 |
| 401 N Mirick Ave | 0.27mi | 3/2.0 (+1) | 1,313 (+6%) | 1mo | $209,000 | $159 | 67 |
| 728 W Walker St | 0.27mi | 3/2.0 (+1) | 1,148 (-7%) | 1mo | $189,000 | $165 | 66 |
| 425 W Johnson | 0.51mi | 3/2.0 (+1) | 1,257 (+2%) | 1mo | $215,000 | $171 | 63 |
| 1612 W Bond St | 0.67mi | 2/2.0 | 1,273 (+3%) | 1mo | $200,000 | $157 | 59 |
| 925 W Nelson St | 0.51mi | 3/2.0 (+1) | 1,168 (-5%) | 1mo | $87,500 | $75 | 58 |
| 1213 W Morgan St | 0.52mi | 3/1.0 (+1) | 1,336 (+8%) | 1mo | $99,000 | $74 | 56 |
| 1328 W Woodard St | 0.43mi | 2/2.0 | 1,365 (+11%) | 2mo | $149,000 | $109 | 56 |
| 1609 W Woodard St | 0.64mi | 3/2.0 (+1) | 1,288 (+4%) | 1mo | $239,900 | $186 | 53 |
Match score weights: distance 35% · size 25% · config 20% · recency 20%. Top-matched comps best support the ARV.
Projected returns pro-forma
-3.0% appreciation · 0.05% rent growth · sell at horizon
- IRR
- 8.2%
- Equity multiple
- 1.31×
- Total profit
- $8,174
- Equity at exit
- $14,016
- IRR
- 14.8%
- Equity multiple
- 2.03×
- Total profit
- $27,154
- Equity at exit
- $8,127
Cash invested: $26,320 (down + closing). Projections, not guarantees.
Landlord ↔ Tenant lean methodology
- Overall (STATE)
- 87 Strongly Landlord-Friendly
- State Texas
- 87 Strongly Landlord-Friendly · R+5
- County
- — inherits STATE
- City
- — inherits STATE
ZIP-level market 75020
- Rents YoY
- 0.1%
- Active inventory
- 485
- Price-to-rent
- 5.7×
Monthly cashflow live
- Estimated rent
- $1,365 high interval (Pro) →
- Mortgage (P&I)
- −$493
- Tax est. 1.5%
- −$118 /mo · $1,410/yr
- Insurance
- −$39
- HOA
- −$0
- Vacancy / Maint / Mgmt
- −$287
- Net cashflow
- $429
Break-even live
UW: 25.0% down · 7.5% · 30yr · 1.5% tax · 5.0% vac · 8.0% maint · 8.0% mgmt
Financing live
Cash to close
- Down payment
- $23,500
- Closing costs
- $2,820
- Reserves months
- —
- Total cash needed
- —
Loan-product check · same deal, 3 products live
Conventional
25% down · 7.5% · 30yr
- Down + closing
- —
- Monthly P&I
- —
- Monthly cashflow
- —
- DSCR
- —
- Eligible?
- —
Personal DTI + credit; lowest rate.
DSCR
20% down · 8.5% · 30yr
- Down + closing
- —
- Monthly P&I
- —
- Monthly cashflow
- —
- DSCR
- —
- Eligible?
- —
No personal income docs; deal must DSCR.
Hard money
10% down · 12.0% · 12mo
- Down + closing
- —
- Monthly P&I
- —
- Monthly cashflow
- —
- DSCR
- —
- Eligible?
- —
Short-term bridge; refi at stabilization.
Rent comps 40 comps
| Address | Beds | Baths | Sqft | Rent | $/sqft | DOM | Units | Dist |
|---|---|---|---|---|---|---|---|---|
| 1004 W Gandy St Denison, TX | 3.0 | 1.0 | 1250 | $1,299 | $1.04 | 20d | 1 | 0.09mi |
| 1016 W Gandy St #4 Denison, TX | 2.0 | 1.5 | 1000 | $1,100 | $1.10 | 43d | 1 | 0.12mi |
| 731 W Morton St Denison, TX | 3.0 | 2.0 | 1298 | $1,500 | $1.16 | 43d | 1 | 0.19mi |
| 617 W Gandy St Unit 3 Denison, TX | 2.0 | 2.0 | 750 | $1,200 | $1.60 | 43d | 1 | 0.24mi |
| 731 W Bond St Denison, TX | 3.0 | 2.0 | 1297 | $1,595 | $1.23 | 20d | 1 | 0.25mi |
| 715 W Chestnut St Denison, TX | 2.0 | 2.0 | 1273 | $1,300 | $1.02 | 43d | 1 | 0.26mi |
| 820 W Crawford St Denison, TX | 2.0 | 1.0 | 996 | $1,250 | $1.26 | 20d | 1 | 0.31mi |
| 626 W Chestnut St Denison, TX | 2.0 | 1.0 | 1132 | $1,300 | $1.15 | 20d | 1 | 0.33mi |
| 108 N Eddy Ave Denison, TX | 1.0 | 1.0 | 882 | $1,100 | $1.25 | 43d | 1 | 0.35mi |
| 817 W Owing St Denison, TX | 1.0 | 1.0 | 700 | $800 | $1.14 | 20d | 1 | 0.35mi |
| 1231 W Main St Denison, TX | 2.0 | 1.5 | 1203 | $1,575 | $1.31 | 20d | 1 | 0.35mi |
| 626 W Crawford St Unit 101 Denison, TX | 2.0 | 2.0 | 950 | $950 | $1.00 | 20d | 1 | 0.38mi |
| 727 W Johnson St Unit A Denison, TX | 3.0 | 2.5 | 1238 | $1,450 | $1.17 | 43d | 1 | 0.39mi |
| 1326 W Sears St Denison, TX | 2.0 | 1.0 | 1318 | $1,350 | $1.02 | 20d | 1 | 0.40mi |
| 1131 W Owing St Denison, TX | 3.0 | 2.0 | 1135 | $1,695 | $1.49 | 43d | 1 | 0.41mi |
| 527 W Walker St Denison, TX | 3.0 | 2.0 | 1300 | $1,675 | $1.29 | 43d | 1 | 0.42mi |
| 1120 W Owing St Denison, TX | 3.0 | 2.0 | 1090 | $1,225 | $1.12 | 20d | 1 | 0.43mi |
| 610 W Owing St Denison, TX | 3.0 | 2.0 | 1108 | $1,395 | $1.26 | 43d | 1 | 0.45mi |
| 410 S Mirick Ave Denison, TX | 3.0 | 2.0 | 1100 | $1,300 | $1.18 | 43d | 1 | 0.50mi |
| 613 W Elm St Unit 613 Denison, TX | 3.0 | 2.0 | 1375 | $1,525 | $1.11 | 44d | 1 | 0.51mi |
| 317 W Main St #203 Denison, TX | 1.0 | 1.0 | 1000 | $1,600 | $1.60 | 43d | 1 | 0.53mi |
| 317 W Main St Unit 202 Denison, TX | 1.0 | 1.0 | 1000 | $1,700 | $1.70 | 43d | 1 | 0.53mi |
| 320 W Bond St Denison, TX | 3.0 | 2.0 | 1278 | $1,500 | $1.17 | 44d | 1 | 0.53mi |
| 411 S Fannin Ave #411 Denison, TX | 3.0 | 2.5 | 1322 | $1,450 | $1.10 | 20d | 1 | 0.54mi |
| 514 N Rusk Ave Unit 516 Denison, TX | 3.0 | 2.0 | 1173 | $1,375 | $1.17 | 20d | 1 | 0.59mi |
| 1022 W Shepherd St #1022 Denison, TX | 3.0 | 2.5 | 1322 | $1,450 | $1.10 | 20d | 1 | 0.60mi |
| 514 N Rusk Ave Denison, TX | 3.0 | 2.0 | 1173 | $1,450 | $1.24 | 43d | 1 | 0.60mi |
| 226 W Bond St Unit 224 Denison, TX | 3.0 | 2.5 | 1294 | $1,375 | $1.06 | 43d | 1 | 0.61mi |
| 224 W Bond St Denison, TX | 3.0 | 2.5 | 1294 | $1,375 | $1.06 | 43d | 1 | 0.61mi |
| 921 W Day St Denison, TX | 3.0 | 2.0 | 1212 | $1,500 | $1.24 | 43d | 1 | 0.63mi |
| 1311 W Day St Denison, TX | 2.0 | 1.0 | 1188 | $1,050 | $0.88 | 20d | 1 | 0.73mi |
| 1602 W Elm St Denison, TX | 3.0 | 2.0 | 1141 | $1,495 | $1.31 | 43d | 1 | 0.74mi |
| 412 W Day St Denison, TX | 2.0 | 1.0 | 900 | $1,200 | $1.33 | 20d | 1 | 0.79mi |
| 105 E Bond St Denison, TX | 2.0 | 1.0 | 825 | $950 | $1.15 | 43d | 1 | 0.79mi |
| 526 W Munson St Unit 2 Denison, TX | 2.0 | 1.0 | 778 | $999 | $1.28 | 43d | 1 | 0.79mi |
| 404 W Day St Denison, TX | 3.0 | 2.0 | 1057 | $1,500 | $1.42 | 20d | 1 | 0.79mi |
| 526 W Munson St Denison, TX | 2.0 | 1.0 | 778 | $849 | $1.09 | 20d | 2 | 0.79mi |
| 1721 W Walker St Denison, TX | 2.0 | 1.0 | 1322 | $1,400 | $1.06 | 43d | 1 | 0.80mi |
| 1703 W Elm St Denison, TX | 2.0 | 1.0 | 800 | $875 | $1.09 | 20d | 1 | 0.83mi |
| 1701 W Elm St Denison, TX | 2.0 | 1.0 | 800 | $900 | $1.12 | 20d | 1 | 0.83mi |
Listing history 19 events
-
2026-06-19days on market $94,000 Active 121 DOM
-
2026-06-18days on market $94,000 Active 120 DOM
-
2026-06-17days on market $94,000 Active 119 DOM
-
2026-06-16days on market $94,000 Active 118 DOM
-
2026-06-15days on market $94,000 Active 117 DOM
-
2026-06-14days on market $94,000 Active 115 DOM
-
2026-06-13days on market $94,000 Active 114 DOM
-
2026-06-10days on market $94,000 Active 112 DOM
-
2026-06-09days on market $94,000 Active 111 DOM
-
2026-06-08days on market $94,000 Active 110 DOM
-
2026-06-07days on market $94,000 Active 109 DOM
-
2026-06-05days on market $94,000 Active 106 DOM
-
2026-06-03days on market $94,000 Active 105 DOM
-
2026-06-02days on market $94,000 Active 104 DOM
-
2026-06-01days on market $94,000 Active 103 DOM
-
2026-05-31days on market $94,000 Active 102 DOM
-
2026-05-30days on market $94,000 Active 101 DOM
-
2026-05-11price $94,000 639-char remark
Show marketing remark (639 chars)
Investor special in the heart of Denison, Texas! This 2-bedroom, 1-bath home presents a prime opportunity for investors, flippers, or buyers ready to add value in a central, convenient location. Situated near local dining, shopping, schools, and just minutes from downtown Denison, this property offers both visibility and accessibility. With solid bones and endless potential, it’s ready for renovation and customization to maximize returns. Whether you’re planning a fix-and-flip, long-term rental, or affordable starter home project, this is your chance to invest in a growing area with strong demand and upside opportunity.
-
2026-02-18$99,000 Active 639-char remark
Show marketing remark (639 chars)
Investor special in the heart of Denison, Texas! This 2-bedroom, 1-bath home presents a prime opportunity for investors, flippers, or buyers ready to add value in a central, convenient location. Situated near local dining, shopping, schools, and just minutes from downtown Denison, this property offers both visibility and accessibility. With solid bones and endless potential, it’s ready for renovation and customization to maximize returns. Whether you’re planning a fix-and-flip, long-term rental, or affordable starter home project, this is your chance to invest in a growing area with strong demand and upside opportunity.
ⓘ Source: listings_history table (triggers on properties + properties_extension) + one-shot
backfill from property_details.listing_events for pre-trigger history.
Climate risk First Street
- Flood 1/10 Low FEMA zone X (unshaded) · 0% chance over 30 yrs
- Wildfire 4/10 Moderate
- Heat 6/10 Major 7 d/yr ≥109°F today · 21 d/yr by 30 yrs out
- Wind 4/10 Moderate 19% chance of damaging wind over 30 yrs
- Air quality 3/10 Moderate 3 unhealthy d/yr today · 3 by 30 yrs out
Nearby sold comps map
Loading sold comps map…
Walkable amenities ~0.75 mi
Loading nearby amenities…
Taxation est. · year 1
- Rental income
- $16,384
- − Mortgage interest
- −$5,265
- − Property taxes
- −$1,410
- − Insurance
- −$470
- − Repairs & maintenance
- −$1,311
- − Management
- −$1,311
- − Depreciation
- −$2,735
- Taxable income
- $3,882
- Est. tax owed @ 24.0%
- −$932
- After-tax cash flow
- $4,216/yr
For passive investors: Depreciation is non-cash, so a rental often shows a tax loss while cash-flowing — sheltering income. Rental losses are passive: they offset passive income freely, and up to $25,000/yr can offset ordinary (W-2) income if you actively participate and your MAGI is under $100k (phasing out to $0 by $150k); unused losses carry forward. On sale, claimed depreciation is recaptured at up to 25%, and gains may owe capital-gains tax (a 1031 exchange can defer both). Figures are a year-1 estimate at your 24.0% rate — not tax advice; consult a CPA.
Condition & rehab AI · 12 photos
This 2-bedroom, 1-bath home in Denison, TX, requires moderate renovations to improve its condition and increase its value. Key areas for improvement include the kitchen, bathrooms, exterior, and interior walls. With fresh paint, new flooring, and updated fixtures, this property can become a move-in-ready investment.
Repairs flagged
- Major kitchen cabinets — Severe wear and tear
- Major bathroom fixtures — Outdated and worn
- Moderate exterior siding — Weathered and discolored
- Major interior walls — Peeling wallpaper and worn paint
Value-add opportunities
- Both Paint and wallpaper — Fresh paint and wallpaper can improve both resale and rental value
- Both New flooring — New flooring can improve both resale and rental value
- Both New kitchen cabinets — New cabinets can improve both resale and rental value
- Both New bathroom fixtures — New fixtures can improve both resale and rental value
Renovation cost estimate screening
| Repair item | Severity | Est. cost |
|---|---|---|
| kitchen cabinets · Severe wear and tear | Major | $15,000–50,000 |
| bathroom fixtures · Outdated and worn | Major | $15,000–50,000 |
| exterior siding · Weathered and discolored | Moderate | $3,000–15,000 |
| interior walls · Peeling wallpaper and worn paint | Major | $15,000–50,000 |
| Total estimated repair cost · 4 items | $48,000–165,000 |
Value-add ROI direction
- Both Paint and wallpaper — Fresh paint and wallpaper can improve both resale and rental value ↑
- Both New flooring — New flooring can improve both resale and rental value ↑
- Both New kitchen cabinets — New cabinets can improve both resale and rental value ↑
- Both New bathroom fixtures — New fixtures can improve both resale and rental value ↑
ⓘ Cost ranges are severity-bucket heuristics (US national rule-of-thumb). Get contractor quotes + a written scope before underwriting a rehab budget.
Schools (NCES district)
- District
- Denison ISD
- NCES district ID
- 4816710
- Math proficiency
- 43% ▼ -7.00%
- Reading proficiency
- 44% ▼ -3.00%
- Median HH income
- $41,650
- Composite
- 36.6/100
- National rank
- #4629
- State rank
- #315 of 826 in TX
Livability — Denison
- Score
- 73/100
- State rank
- #221
- US rank
- #5428
Category grades
Schools grade is shown separately in the Schools card above.
Census & demographics
- Census place
- Denison, TX
- County
- Grayson County · 108,053 people
- City population
- 34,008
- Metro
- Sherman-Denison, TX
- Population (ZIP)
- 24,835
- Household income
- $71,605
- Rent vs Own
- Severe rent burden
- 997.0
Population outlook (Grayson County) Hauer SSP2
- Today (2025)
- 134,540 people
- By 2030
- 138,653 · +3.1%
- By 2040
- 145,958 · +8.5%
- By 2050
- 151,218 · +12.4%
- By 2075
- 161,802 · +20.3%
- By 2100
- 159,036 · +18.2%
Race, ethnicity, and origin ACS 2023
- Neighborhood character
- Predominantly White (73%)
- Race & ethnicity
- White 73% Hispanic / Latino 13% Two or more races 9% Black 6%
- Hispanic origin (detail)
- Mexican 11%
- Common ancestry
- Slovak 5% Serbian 2% Portuguese 2%
- Foreign-born
- 4% · Canada
- Languages at home
- 93% English-only · Spanish 6%
Political lean MEDSL · Grayson
- 2024 margin
- Solid R (+54.3) · D 22.5% · R 76.7%
- 2008→2024 swing
- -16.4pp toward R · 2008: -37.9pp · 2024: -54.3pp
- All cycles
- 2024: R+54.3 2020: R+49.9 2016: R+53.1 2012: R+48.0 2008: R+37.9
Not yet ingested
- Civics
- —
Market trends
- HPI YoY
- ▼ -295.96%
- Current HPI
- 257.1806
- Rent YoY
- ▬ 0.05%
- Metro
- Sherman-Denison, TX
- State GDP YoY
- ▲ 3.95%
- F500 in state
- 110
Industry mix (Fortune 500 HQ in TX)
| Industry | F500 HQs | Revenue |
|---|---|---|
| Energy | 16 | $1,198B |
|
||
| Technology | 5 | $198B |
|
||
| Engineering / Construction | 4 | $72B |
|
||
| Energy Services | 3 | $60B |
|
||
| Utilities | 3 | $41B |
|
||
| Healthcare | 2 | $330B |
|
||
Price history
-5.1% since first listed2 events — show timeline
- 2026-05-11 Price Changed $94,000 NTREIS
- 2026-02-18 Listed $99,000 NTREIS
Cash-flow waterfall
monthlySold comps — $/sqft
last 12 mo · ≤1 miLoading sold comps…