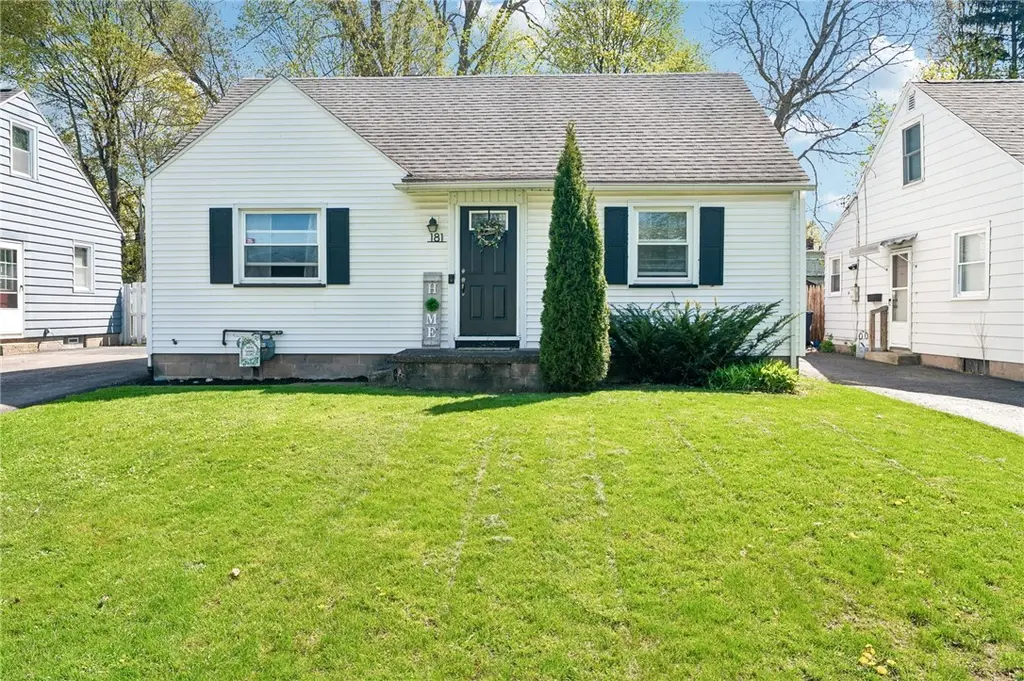
181 Leonard Rd · Rochester, NY
Flood risk 1/10 · Minimal
- FEMA flood zone
- X (unshaded)
- Chance of flooding over 30 yrs
- 0.0%
- Est. flood insurance / yr
- $473 – $860
Fire risk 1/10 · Minimal
- Est. fire insurance / yr
- $691 – $1,283
Heat risk 2/10 · Minimal
- Hot days now (above 95°F)
- 7 days/yr
- Hot days in 30 yrs
- 16 days/yr
Wind risk 1/10 · Minimal
- Chance of severe wind over 30 yrs
- —
Air-quality risk 2/10 · Minimal
- Unhealthy air days now
- 1 days/yr
- Unhealthy air days in 30 yrs
- 2 days/yr
Risk factors via First Street. Map © Google.
Why this score? — see what drove the C- grade
The composite is a weighted blend of 9 inputs, each scored 0–100. Each bar is that input's sub-score; the figure is the points it added to the 100-point composite (weight × sub-score).
- Cash flow +14.6/30.0
- ARV discount +13.9/15.0
- 1% rule +5.6/10.0
- DSCR +4.4/10.0
- Livability +3.8/5.0
- Schools +3.2/10.0
- Rent growth +2.5/5.0
- Condition / age +2.5/5.0
- Appreciation +0.0/10.0
$169,900
🖨 Deal sheet 📄 Offer letter ✓ Due diligence
Listing remarks MLS
Pristine vinyl sided Cape Cod with newer replacement windows, newer 30 year architectural roof, NEW MAPLE KITCHEN WITH GRANITE COUNTER TOPS, GLEAMING HARDWOOD FLOORS, and large master bedroom with plush new carpeting! Close to shopping area, this one won't last!
Key facts
- Flexible bonus space
- One car garage
- First floor living
Tags
Property features AI
Exterior
- Parking: Detached garage; Shared driveway; Total of 1 garage space
- Utilities: Electricity connected (circuit breakers); Sewer connected; Spring water source
- Home design: Two-story home; Existing/previously built
- Construction: Vinyl siding; Architectural shingle roof; Block foundation; Full basement
- Exterior features: Blacktop driveway; Patio; Rectangular residential lot; City street frontage
Interior
- Kitchen: Gas range; Gas oven; Refrigerator; Wine cooler
- Bedrooms: Two main-level bedrooms
- Flooring: Hardwood; Carpet; Varies
- Bathrooms: One full bathroom (main level)
- Heating & cooling: Gas forced-air heating
- Interior features: Eat-in kitchen; Separate/formal living room; Sliding glass doors
- Laundry & utility: Washer and dryer located in basement; Gas water heater
Neighborhood map
What this means for you Summary
Snapshot
- This is a 2-bed/1.0-bath single-family listed at $170k.
Deal economics
- At list price, monthly cash flow is $40 ($476/yr) — positive.
- The deal already cash-flows at list — no discount required.
- Meets the 1% rule at list price ($2k rent vs $170k).
- Cap rate 6.6% vs local median 9.3% in Rochester — below-typical yield; the buyer is paying a premium for something (appreciation thesis, condition, location) that the cap rate doesn't capture.
Location & tenants
- Location reads 76/100 on livability (#222 in NY, #3,482 nationally) — a middle-class / working-renter tenant base. Strengths: commute A+, cost of living A+, housing A+; Watch: schools D+, crime F, employment F.
- Greece Central School District (suburban): math 35% / reading 39% proficiency, ranked #544 of 590 in NY (top 92%) — families likely to look elsewhere, expect single-tenant / working-renter base with shorter leases.
- Market conditions: 111 active listings in the ZIP; 16 comparable units currently listed for rent nearby; rentals leasing fast (median 3d on market — plan ~1-2 weeks tenant-placement turnaround); 1,169 units permitted in Monroe County in 2024 (591 in 5+ unit buildings).
- This rent runs 32% of the median local income ($66k/yr) — at the standard rent-burdened threshold; future hikes will face affordability resistance.
Forward outlook
- Local home prices are declining (-3.0%/yr); year-one equity from $1k of loan paydown is wiped out by about $5k of value loss. Plan a longer hold.
- Monroe County population projected to shrink 6% by 2050 — rents likely to lag national; underwrite the cash flow, not the appreciation.
Negotiation context
- Only 6 days on market — expect competitive offers; lowballing is unlikely to land.
- 3 sale attempts since 13y ago with the ask held roughly flat each time — persistent listings suggest the price (not the market) is what's stuck; bring a comps-based counter.
- Current owner paid $78k; list at $170k implies a 118% gain — meaningful room to come down on a strong offer.
Risks & watch-outs
- Watch-outs: property tax is 3.0% of price; built in 1950 — expect roof / HVAC / electrical / plumbing capex.
Questions for the listing agent
- Built in 1950 — when were the roof, HVAC, electrical panel, plumbing, and water heater last replaced?
- Property tax is high relative to price — has the assessment been appealed recently, and will the sale trigger a re-assessment?
- Is there a deadline driving the sale (1031 exchange, divorce, estate, relocation)? That informs how much negotiation room exists.
- Schools are D-rated, which usually means shorter tenancies and higher turnover. Who's the typical renter profile here, and what's been the actual vacancy rate?
- Crime grade is F in this area — have there been break-ins, vandalism, or insurance claims at this property in the last 3 years? What carrier currently insures it and at what premium?
- What's the average days-on-market for RENTAL listings here right now (not sales)? A rising rental-DOM trend means longer vacancies and softer asking-rent achievability than the comps imply.
- What's the recent tenant-quality profile in this submarket — average credit score on applications, eviction rate, late-payment / NSF rate, and stable-employment percentage? A property-management company in the area should have these aggregated.
- How much new for-sale + rental construction is in the pipeline within 1–3 miles? Heavy new supply typically softens prices + rents 12–24 months out; constrained supply supports both.
Investment metrics
- 1% rule
- 1.06% ✓
- Cap rate
- 6.57%
- Cash-on-cash
- 1.00%
- DSCR
- 1.04
- GRM
- 7.9
CMA / ARV
- ARV (median comp)
- $197,815
- List price
- $169,900
- Delta
- -14.11%
- Verdict
- UNDERPRICED
- Comps
- 20 within 1.0 mi
Show comp detail 12 sales within ~0.75 mi
| Address | Dist | Beds/Ba | Sqft | Sold | Price | $/sf | Match |
|---|---|---|---|---|---|---|---|
| 157 Leonard Rd | 0.04mi | 2/1.5 | 1,229 (-5%) | 4mo | $207,300 | $169 | 85 |
| 266 Brayton Rd | 0.18mi | 3/1.0 (+1) | 1,211 (-6%) | 5mo | $166,000 | $137 | 72 |
| 92 Veness Ave | 0.60mi | 2/1.0 | 1,296 (+1%) | 2mo | $185,000 | $143 | 69 |
| 212 Leonard Rd | 0.05mi | 3/1.0 (+1) | 1,098 (-15%) | 4mo | $202,500 | $184 | 65 |
| 1043 Britton Rd | 0.08mi | 3/1.0 (+1) | 1,101 (-14%) | 4mo | $195,000 | $177 | 64 |
| 99 Newfield Dr | 0.40mi | 3/1.5 (+1) | 1,199 (-7%) | 4mo | $215,000 | $179 | 60 |
| 4314 Mount Read Blvd | 0.35mi | 3/1.5 (+1) | 1,392 (+8%) | 5mo | $277,000 | $199 | 59 |
| 65 Villewood Dr | 0.66mi | 3/1.0 (+1) | 1,350 (+5%) | 1mo | $215,000 | $159 | 55 |
| 23 Barcrest Dr | 0.51mi | 3/1.5 (+1) | 1,405 (+9%) | 0mo | $285,000 | $203 | 54 |
| 591 Britton Rd | 0.58mi | 3/1.5 (+1) | 1,392 (+8%) | 1mo | $225,000 | $162 | 51 |
| 3887 Mount Read Blvd | 0.63mi | 3/1.5 (+1) | 1,197 (-7%) | 4mo | $254,000 | $212 | 48 |
| 25 Yarkerdale Dr | 0.73mi | 3/2.0 (+1) | 1,438 (+12%) | 5mo | $284,000 | $197 | 34 |
Match score weights: distance 35% · size 25% · config 20% · recency 20%. Top-matched comps best support the ARV.
Projected returns pro-forma
-3.0% appreciation · 3.0% rent growth · sell at horizon
- IRR
- -14.6%
- Equity multiple
- 0.48×
- Total profit
- $-24,848
- Equity at exit
- $25,333
- IRR
- -5.7%
- Equity multiple
- 0.63×
- Total profit
- $-17,752
- Equity at exit
- $14,690
Cash invested: $47,572 (down + closing). Projections, not guarantees.
Landlord ↔ Tenant lean methodology
- Overall (STATE)
- 15 Strongly Tenant-Friendly
- State New York
- 15 Strongly Tenant-Friendly · D+10
- County
- — inherits STATE
- City
- — inherits STATE
ZIP-level market 14616
- Home prices YoY
- -18.0%
- Active inventory
- 111
- Price-to-rent
- 7.9×
Monthly cashflow live
- Estimated rent
- $1,800 high interval (Pro) →
- Mortgage (P&I)
- −$891
- Tax from tax record
- −$421 /mo · $5,046/yr
- Insurance
- −$71
- HOA
- −$0
- Vacancy / Maint / Mgmt
- −$378
- Net cashflow
- $40
Break-even live
UW: 25.0% down · 7.5% · 30yr · 1.5% tax · 5.0% vac · 8.0% maint · 8.0% mgmt
Financing live
Cash to close
- Down payment
- $42,475
- Closing costs
- $5,097
- Reserves months
- —
- Total cash needed
- —
Loan-product check · same deal, 3 products live
Conventional
25% down · 7.5% · 30yr
- Down + closing
- —
- Monthly P&I
- —
- Monthly cashflow
- —
- DSCR
- —
- Eligible?
- —
Personal DTI + credit; lowest rate.
DSCR
20% down · 8.5% · 30yr
- Down + closing
- —
- Monthly P&I
- —
- Monthly cashflow
- —
- DSCR
- —
- Eligible?
- —
No personal income docs; deal must DSCR.
Hard money
10% down · 12.0% · 12mo
- Down + closing
- —
- Monthly P&I
- —
- Monthly cashflow
- —
- DSCR
- —
- Eligible?
- —
Short-term bridge; refi at stabilization.
Rent comps 16 comps
| Address | Beds | Baths | Sqft | Rent | $/sqft | DOM | Units | Dist |
|---|---|---|---|---|---|---|---|---|
| 175 English Rd Rochester, NY | 3.0 | 1.5 | 1194 | $1,975 | $1.65 | 43d | 1 | 0.08mi |
| 331 Leonard Rd Rochester, NY | 3.0 | 2.0 | 1157 | $1,850 | $1.60 | 3d | 1 | 0.22mi |
| 37 Linda Dr Unit 1 Rochester, NY | 3.0 | 2.0 | 1600 | $2,100 | $1.31 | 43d | 1 | 0.38mi |
| 4 Valley Brook Cir Greece, NY | 2.0 | 1.5 | 1047 | $2,306 | $2.20 | 2d | 3 | 0.63mi |
| 108 Glenbrook Rd Rochester, NY | 3.0 | 1.0 | 1088 | $1,850 | $1.70 | 23d | 1 | 0.63mi |
| 419 Britton Rd Rochester, NY | 2.0 | 1.5 | 1025 | $1,595 | $1.56 | 2d | 1 | 0.83mi |
| 304 Bakerdale Rd Rochester, NY | 3.0 | 1.0 | 1256 | $1,650 | $1.31 | 44d | 1 | 0.85mi |
| 262 Jamestown Ter Unit 2 Rochester, NY | 2.0 | 1.0 | 1242 | $2,200 | $1.77 | 43d | 1 | 0.89mi |
| 360 Britton Rd Rochester, NY | 1.0–2.0 | 1.0 | 837 | $1,479 | $1.77 | 2d | 2 | 0.90mi |
| 704 Rumson Rd Rochester, NY | 3.0 | 1.0 | 1100 | $1,950 | $1.77 | 3d | 1 | 0.98mi |
| 534-582 Denise Rd Unit 562 Rochester, NY | 2.0 | 1.0 | 1000 | $1,575 | $1.57 | 2d | 1 | 1.10mi |
| 44 Windsor Rd Rochester, NY | 3.0 | 1.0 | 882 | $1,795 | $2.04 | 2d | 1 | 1.12mi |
| 1255 Latta Rd Greece, NY | 1.0–2.0 | 1.0 | 705 | $1,570 | $2.23 | 2d | 5 | 1.14mi |
| 125 Windsor Rd Rochester, NY | 2.0 | 1.0 | 1142 | $1,700 | $1.49 | 2d | 1 | 1.21mi |
| 130 N Park Dr Rochester, NY | 3.0 | 1.5 | 1120 | $2,000 | $1.79 | 43d | 1 | 1.39mi |
| 3677 Lake Ave Rochester, NY | 2.0 | 1.0 | 1088 | $1,200 | $1.10 | 43d | 1 | 1.44mi |
Listing history 8 events
-
2026-05-06status Pending 1627-char remark
-
2026-04-29$169,900 Active 1627-char remark
-
2013-10-02soldstatus $78,000
-
2013-09-20soldstatus $77,340 263-char remark
Show marketing remark (263 chars)
Pristine vinyl sided Cape Cod with newer replacement windows, newer 30 year architectural roof, NEW MAPLE KITCHEN WITH GRANITE COUNTER TOPS, GLEAMING HARDWOOD FLOORS, and large master bedroom with plush new carpeting! Close to shopping area, this one won't last!
-
2013-09-16historical
-
2013-08-30$79,900 263-char remark
Show marketing remark (263 chars)
Pristine vinyl sided Cape Cod with newer replacement windows, newer 30 year architectural roof, NEW MAPLE KITCHEN WITH GRANITE COUNTER TOPS, GLEAMING HARDWOOD FLOORS, and large master bedroom with plush new carpeting! Close to shopping area, this one won't last!
-
2013-04-17$79,900
-
2013-03-01soldstatus $48,000
ⓘ Source: listings_history table (triggers on properties + properties_extension) + one-shot
backfill from property_details.listing_events for pre-trigger history.
Tax reassessment forecast NY · Partial reset (capped growth)
- Current annual tax
- $5,046 · $421/mo
- Projected year-2 tax
- $5,046 · $421/mo
- Expected delta
- $0/yr ($0/mo · 0.0%)
ⓘ Screening estimate from a state-policy table — verify with the county assessor before closing.
Climate risk First Street
- Flood 1/10 Low FEMA zone X (unshaded) · 0% chance over 30 yrs
- Wildfire 1/10 Low
- Heat 2/10 Low 7 d/yr ≥95°F today · 16 d/yr by 30 yrs out
- Wind 1/10 Low
- Air quality 2/10 Low 1 unhealthy d/yr today · 2 by 30 yrs out
Nearby sold comps map
Loading sold comps map…
Walkable amenities ~0.75 mi
Loading nearby amenities…
Taxation est. · year 1
- Rental income
- $21,600
- − Mortgage interest
- −$9,517
- − Property taxes
- −$5,046
- − Insurance
- −$850
- − Repairs & maintenance
- −$1,728
- − Management
- −$1,728
- − Depreciation
- −$4,943
- Taxable loss
- −$2,212
- Est. tax savings @ 24.0%
- +$531
- After-tax cash flow
- $1,007/yr
For passive investors: Depreciation is non-cash, so a rental often shows a tax loss while cash-flowing — sheltering income. Rental losses are passive: they offset passive income freely, and up to $25,000/yr can offset ordinary (W-2) income if you actively participate and your MAGI is under $100k (phasing out to $0 by $150k); unused losses carry forward. On sale, claimed depreciation is recaptured at up to 25%, and gains may owe capital-gains tax (a 1031 exchange can defer both). Figures are a year-1 estimate at your 24.0% rate — not tax advice; consult a CPA.
Schools (NCES district)
- District
- Greece Central School District
- NCES district ID
- 3612630
- Math proficiency
- 35% ▼ -14.00%
- Reading proficiency
- 39% ▼ -3.00%
- Median HH income
- $52,718
- Composite
- 32.26/100
- National rank
- #5761
- State rank
- #544 of 590 in NY
Livability — Rochester
- Score
- 76/100
- State rank
- #222
- US rank
- #3482
Category grades
Schools grade is shown separately in the Schools card above.
Census & demographics
- County
- Monroe County · 674,131 people
- City population
- 432,803
- Metro
- Rochester, NY
- Population (ZIP)
- 26,863
- Household income
- $66,499
- Rent vs Own
- Severe rent burden
- 789.0
Population outlook (Monroe County) Hauer SSP2
- Today (2025)
- 759,460 people
- By 2030
- 757,154 · -0.3%
- By 2040
- 740,644 · -2.5%
- By 2050
- 714,443 · -5.9%
- By 2075
- 645,883 · -15.0%
- By 2100
- 547,084 · -28.0%
Race, ethnicity, and origin ACS 2023
- Neighborhood character
- Predominantly White (68%)
- Race & ethnicity
- White 68% Black 13% Hispanic / Latino 12% Two or more races 8% Asian 3%
- Hispanic origin (detail)
- Mexican 1% Puerto Rican 9%
- Common ancestry
- Romanian 6% Lithuanian 2% Iranian 2%
- Foreign-born
- 8% · Canada, Philippines, Jamaica
- Languages at home
- 88% English-only · Spanish 5% Arabic 2% Other Asian/Pacific 2%
Political lean MEDSL · Monroe
- 2024 margin
- D (+19.1) · D 59.5% · R 40.5%
- 2008→2024 swing
- +1.4pp toward D · 2008: 17.7pp · 2024: 19.1pp
- All cycles
- 2024: D+19.1 2020: D+21.0 2016: D+14.1 2012: D+17.4 2008: D+17.7
Not yet ingested
- Civics
- —
Market trends
- HPI YoY
- ▼ -54.14%
- Current HPI
- 246.1703
- Rent YoY
- —
- Metro
- Rochester, NY
- State GDP YoY
- ▲ 2.60%
- F500 in state
- 92
Industry mix (Fortune 500 HQ in NY)
| Industry | F500 HQs | Revenue |
|---|---|---|
| Financial Services | 10 | $950B |
|
||
| Consumer Goods | 9 | $162B |
|
||
| Insurance | 4 | $225B |
|
||
| Telecommunications | 2 | $144B |
|
||
| Pharmaceuticals | 2 | $112B |
|
||
| Media / Entertainment | 2 | $69B |
|
||
Price history
+254.0% since first listed8 events — show timeline
- 2026-05-06 Pending — UNYREIS
- 2026-04-29 Listed $169,900 UNYREIS
- 2013-10-02 Sold (Public Records) $78,000 Public Records
- 2013-09-20 Sold (MLS) $77,340 UNYREIS
- 2013-09-16 Listing Removed — UNYREIS
- 2013-08-30 Listed $79,900 UNYREIS
- 2013-04-17 Listed $79,900 UNYREIS
- 2013-03-01 Sold (Public Records) $48,000 Public Records
Property tax history
+2.7%/yrLatest (2025): $5,046 · +2.8% YoY. Source: county tax records.
Cash-flow waterfall
monthlySold comps — $/sqft
last 12 mo · ≤1 miLoading sold comps…