 Multi-family
123 Multi Family Way · Fall River, MA
Flood risk 1/10 · Minimal
- FEMA flood zone
- X (unshaded)
- Chance of flooding over 30 yrs
- 0.0%
- Est. flood insurance / yr
- $473 – $860
Fire risk 1/10 · Minimal
- Est. fire insurance / yr
- $915 – $1,699
Heat risk 6/10 · Moderate
- Hot days now (above 96°F)
- 7 days/yr
- Hot days in 30 yrs
- 15 days/yr
Wind risk 8/10 · Major
- Chance of severe wind over 30 yrs
- 80.0%
Air-quality risk 2/10 · Minimal
- Unhealthy air days now
- 1 days/yr
- Unhealthy air days in 30 yrs
- 2 days/yr
Risk factors via First Street. Map © Google.
Why this score? — see what drove the C- grade
The composite is a weighted blend of 9 inputs, each scored 0–100. Each bar is that input's sub-score; the figure is the points it added to the 100-point composite (weight × sub-score).
- Cash flow +25.2/30.0
- DSCR +8.3/10.0
- 1% rule +6.6/10.0
- Livability +3.1/5.0
- ARV discount +2.9/15.0
- Rent growth +2.5/5.0
- Condition / age +2.2/5.0
- Schools +1.9/10.0
- Appreciation +0.0/10.0
$1,100,000
🖨 Deal sheet 📄 Offer letter ✓ Due diligence
Multi-family units
County records classify this as Multi-Family (5+ Unit). Listing-text estimate: 1 unit. estimate disagrees with records
5+ unit building — per-unit beds/baths from public records are typically unavailable; the breakdown below (if shown) is an estimate from the listing text.
Listing remarks MLS
Rare mixed-use investment opportunity on a high-visibility corner lot. Property features 7 residential units: six 2-bedroom apartments plus a private studio in a separate rear structure. Strong income potential with a busy corner retail storefront and an additional rented office space. Excellent exposure for commercial tenants with steady traffic. Large corner lot offers potential for curb cut and off-street parking (buyer to perform due diligence). Ideal for investors seeking diversified income streams. Private showings only
Key facts
- Large corner lot
- Off-street parking
- 6,486 sq ft lot
Tags
Neighborhood map
What this means for you Summary
Snapshot
- This is a multifamily listed at $1.10M. Condition is rated fair.
Deal economics
- At list price, monthly cash flow is $2k ($30k/yr) — positive.
- The deal already cash-flows at list — no discount required.
- Meets the 1% rule at list price ($13k rent vs $1.10M).
- Recommended offer: $1.03M (6.0% below list) — sets the bar for market timing.
- Cap rate 9.0% vs local median 3.6% in Fall River — top-decile yield for the area; either an underpriced asset or a hidden risk that comps aren't pricing in. Stress-test before assuming the spread holds.
Location & tenants
- Location reads 61/100 on livability (#221 in MA) — a middle-class / working-renter tenant base. Strengths: health & safety A+; Watch: cost of living D+, schools D, crime F.
- Fall River (suburban): math 17% / reading 28% proficiency, ranked #288 of 302 in MA (top 95%) — low school quality limits family demand, transient renter base, plan for 1-2y turnover; 68% free/reduced lunch — lower-income household profile, screen leases tightly.
- Market conditions: 23 active listings in the ZIP; 2 comparable units currently listed for rent nearby; 760 units permitted in Bristol County in 2024 (142 in 5+ unit buildings).
- At $12,744/mo this rent would consume 275% of the median local household income ($56k/yr) (locally 1445% of renters already pay >50% of income on rent) — very limited rent-growth headroom before tenants either downsize or default.
Forward outlook
- Local home prices are declining (-3.0%/yr); year-one equity from $8k of loan paydown is wiped out by about $33k of value loss. Plan a longer hold.
- Bristol County population projected to shrink 3% by 2050 — rents likely to lag national; underwrite the cash flow, not the appreciation.
Negotiation context
- It's been on market 71 days — a 6% lower offer ($1.03M) is reasonable based on typical stale-listing flexibility.
Risks & watch-outs
- Watch-outs: built in 1900 — expect roof / HVAC / electrical / plumbing capex.
- Climate carrying-cost: severe wind risk, 80% chance of damaging wind over 30y; extreme-heat days projected 7→15/yr by 2055 (HVAC capex compounding) — expect insurance premiums to compound above CPI over the hold.
Questions for the listing agent
- It's been on market 71 days. Have you received any prior offers? Is the seller open to a 6% concession, seller financing, or rate buy-down credit?
- Have any recent inspections been done? Can we get a copy of the seller's disclosures and any deferred-maintenance estimates?
- Built in 1900 — when were the roof, HVAC, electrical panel, plumbing, and water heater last replaced?
- Why hasn't it sold? Are there any deal-killer items the seller is aware of (foundation, flood, title, zoning, code violations)?
- Is there a deadline driving the sale (1031 exchange, divorce, estate, relocation)? That informs how much negotiation room exists.
- Schools are D-rated, which usually means shorter tenancies and higher turnover. Who's the typical renter profile here, and what's been the actual vacancy rate?
- Crime grade is F in this area — have there been break-ins, vandalism, or insurance claims at this property in the last 3 years? What carrier currently insures it and at what premium?
- What's the average days-on-market for RENTAL listings here right now (not sales)? A rising rental-DOM trend means longer vacancies and softer asking-rent achievability than the comps imply.
- What's the recent tenant-quality profile in this submarket — average credit score on applications, eviction rate, late-payment / NSF rate, and stable-employment percentage? A property-management company in the area should have these aggregated.
- How much new apartment / multifamily construction is in the pipeline within 1–3 miles? Heavy new supply (>2% of stock underway) typically softens rents 12–24 months out; light construction supports rent growth.
Investment metrics
- 1% rule
- 1.16% ✓
- Cap rate
- 8.98%
- Cash-on-cash
- 9.61%
- DSCR
- 1.43
- GRM
- 7.2
CMA / ARV
- ARV (median comp)
- $997,660
- List price
- $1,100,000
- Delta
- 10.26%
- Verdict
- OVERPRICED
- Comps
- 20 within 1.0 mi
Show comp detail 4 sales within ~0.75 mi
| Address | Dist | Beds/Ba | Sqft | Sold | Price | $/sf | Match |
|---|---|---|---|---|---|---|---|
| 245 Dwelly St | 0.45mi | 8/3.0 | 7,611 (-3%) | 3mo | $600,000 | $79 | 72 |
| 13 Peck St | 0.16mi | 18/6.0 | 6,720 (-14%) | 21mo | $757,000 | $113 | 52 |
| 21-25 Hamlet St | 0.47mi | 15/6.0 | 6,903 (-12%) | 15mo | $1,000,000 | $145 | 46 |
| 488-494 Ridge St | 0.67mi | 18/9.0 | 7,000 (-10%) | 21mo | $2,200,000 | $314 | 34 |
Match score weights: distance 35% · size 25% · config 20% · recency 20%. Top-matched comps best support the ARV.
Projected returns pro-forma
-3.0% appreciation · 3.0% rent growth · sell at horizon
- IRR
- -1.8%
- Equity multiple
- 0.93×
- Total profit
- $-21,000
- Equity at exit
- $164,014
- IRR
- 7.9%
- Equity multiple
- 1.60×
- Total profit
- $184,728
- Equity at exit
- $95,108
Cash invested: $308,000 (down + closing). Projections, not guarantees.
Landlord ↔ Tenant lean methodology
- Overall (STATE)
- 20 Strongly Tenant-Friendly
- State Massachusetts
- 20 Strongly Tenant-Friendly · D+15
- County
- — inherits STATE
- City
- — inherits STATE
ZIP-level market 02724
- Home prices YoY
- -19.3%
- Active inventory
- 23
- Price-to-rent
- 49.6×
Monthly cashflow live
- Estimated rent
- $12,744 high interval (Pro) →
- Mortgage (P&I)
- −$5,769
- Tax est. 1.5%
- −$1,375 /mo · $16,500/yr
- Insurance
- −$458
- HOA
- −$0
- Vacancy / Maint / Mgmt
- −$2,676
- Net cashflow
- $2,466
Break-even live
7-unit breakdown (identical units grouped — click to expand)
| Units | Beds | Baths | Est. rent |
|---|---|---|---|
| 6× units | 2 | 1 | $11,094 |
| #1 | 2 | 1 | $1,849 |
| #2 | 2 | 1 | $1,849 |
| #3 | 2 | 1 | $1,849 |
| #4 | 2 | 1 | $1,849 |
| #5 | 2 | 1 | $1,849 |
| #6 | 2 | 1 | $1,849 |
| 1× unit | 1 | 1 | $1,649 |
| Total (7 units) | $12,744 | ||
UW: 25.0% down · 7.5% · 30yr · 1.5% tax · 5.0% vac · 8.0% maint · 8.0% mgmt
Financing live
Cash to close
- Down payment
- $275,000
- Closing costs
- $33,000
- Reserves months
- —
- Total cash needed
- —
Loan-product check · same deal, 3 products live
Conventional
25% down · 7.5% · 30yr
- Down + closing
- —
- Monthly P&I
- —
- Monthly cashflow
- —
- DSCR
- —
- Eligible?
- —
Personal DTI + credit; lowest rate.
DSCR
20% down · 8.5% · 30yr
- Down + closing
- —
- Monthly P&I
- —
- Monthly cashflow
- —
- DSCR
- —
- Eligible?
- —
No personal income docs; deal must DSCR.
Hard money
10% down · 12.0% · 12mo
- Down + closing
- —
- Monthly P&I
- —
- Monthly cashflow
- —
- DSCR
- —
- Eligible?
- —
Short-term bridge; refi at stabilization.
Rent comps 2 comps
| Address | Beds | Baths | Sqft | Rent | $/sqft | DOM | Units | Dist |
|---|---|---|---|---|---|---|---|---|
| 1029 Plymouth Ave Apt 1 Fall River, MA | 2.0 | 1.0 | 9999 | $1,800 | $0.18 | 43d | 1 | 0.77mi |
| 71 Branch St Unit 1 Fall River, MA | 1.0 | 1.0 | 9999 | $1,600 | $0.16 | 3d | 1 | 0.99mi |
Listing history 14 events
-
2026-06-18days on market $1,100,000 Active 71 DOM
-
2026-06-17days on market $1,100,000 Active 70 DOM
-
2026-06-16days on market $1,100,000 Active 69 DOM
-
2026-06-15days on market $1,100,000 Active 68 DOM
-
2026-06-13days on market $1,100,000 Active 66 DOM
-
2026-06-09days on market $1,100,000 Active 62 DOM
-
2026-06-08days on market $1,100,000 Active 61 DOM
-
2026-06-07days on market $1,100,000 Active 60 DOM
-
2026-06-05days on market $1,100,000 Active 57 DOM
-
2026-06-03days on market $1,100,000 Active 56 DOM
-
2026-06-02days on market $1,100,000 Active 55 DOM
-
2026-06-01days on market $1,100,000 Active 54 DOM
-
2026-05-31days on market $1,100,000 Active 53 DOM
-
2026-04-08$1,100,000 New 531-char remark
Show marketing remark (531 chars)
Rare mixed-use investment opportunity on a high-visibility corner lot. Property features 7 residential units: six 2-bedroom apartments plus a private studio in a separate rear structure. Strong income potential with a busy corner retail storefront and an additional rented office space. Excellent exposure for commercial tenants with steady traffic. Large corner lot offers potential for curb cut and off-street parking (buyer to perform due diligence). Ideal for investors seeking diversified income streams. Private showings only
ⓘ Source: listings_history table (triggers on properties + properties_extension) + one-shot
backfill from property_details.listing_events for pre-trigger history.
Climate risk First Street
- Flood 1/10 Low FEMA zone X (unshaded) · 0% chance over 30 yrs
- Wildfire 1/10 Low
- Heat 6/10 Major 7 d/yr ≥96°F today · 15 d/yr by 30 yrs out
- Wind 8/10 Severe 80% chance of damaging wind over 30 yrs
- Air quality 2/10 Low 1 unhealthy d/yr today · 2 by 30 yrs out
Nearby sold comps map
Loading sold comps map…
Walkable amenities ~0.75 mi
Loading nearby amenities…
Taxation est. · year 1
- Rental income
- $152,928
- − Mortgage interest
- −$61,617
- − Property taxes
- −$16,500
- − Insurance
- −$5,500
- − Repairs & maintenance
- −$12,234
- − Management
- −$12,234
- − Depreciation
- −$32,000
- Taxable income
- $12,842
- Est. tax owed @ 24.0%
- −$3,082
- After-tax cash flow
- $26,509/yr
For passive investors: Depreciation is non-cash, so a rental often shows a tax loss while cash-flowing — sheltering income. Rental losses are passive: they offset passive income freely, and up to $25,000/yr can offset ordinary (W-2) income if you actively participate and your MAGI is under $100k (phasing out to $0 by $150k); unused losses carry forward. On sale, claimed depreciation is recaptured at up to 25%, and gains may owe capital-gains tax (a 1031 exchange can defer both). Figures are a year-1 estimate at your 24.0% rate — not tax advice; consult a CPA.
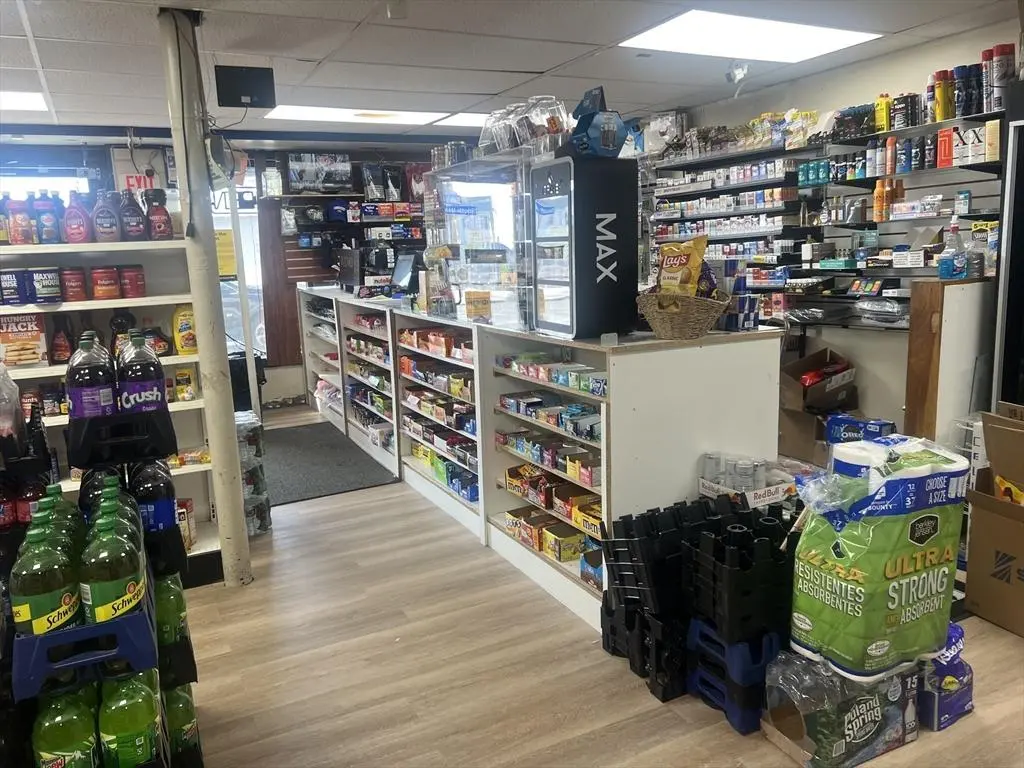
Condition & rehab AI · 7 photos
This mixed-use property presents a moderate rehab opportunity with a busy retail storefront and residential units. Immediate repairs and maintenance are needed to improve the property's condition and value.
Repairs flagged
- Major Kitchen shelves — Cluttered and disorganized
- Major Interior walls — Paint appears worn
Value-add opportunities
- Both Organize shelves — Improves visual appeal and functionality
- Both Paint interior walls — Enhances curb appeal and interior aesthetics
Renovation cost estimate screening
| Repair item | Severity | Est. cost |
|---|---|---|
| Kitchen shelves · Cluttered and disorganized | Major | $15,000–50,000 |
| Interior walls · Paint appears worn | Major | $15,000–50,000 |
| Total estimated repair cost · 2 items | $30,000–100,000 |
Value-add ROI direction
- Both Organize shelves — Improves visual appeal and functionality ↑
- Both Paint interior walls — Enhances curb appeal and interior aesthetics ↑
ⓘ Cost ranges are severity-bucket heuristics (US national rule-of-thumb). Get contractor quotes + a written scope before underwriting a rehab budget.
Schools (NCES district)
- District
- Fall River
- NCES district ID
- 2504830
- Math proficiency
- 17% ▼ -15.00%
- Reading proficiency
- 28% ▼ -6.00%
- Median HH income
- $35,773
- Composite
- 18.59/100
- National rank
- #8905
- State rank
- #288 of 302 in MA
Livability — Fall River
- Score
- 61/100
- State rank
- #221
- US rank
- #18220
Category grades
Schools grade is shown separately in the Schools card above.
Census & demographics
- Census place
- Fall River, MA
- County
- Bristol County · 342,083 people
- City population
- 93,033
- Metro
- Providence-Warwick, RI-MA
- Population (ZIP)
- 18,505
- Household income
- $55,590
- Rent vs Own
- Severe rent burden
- 1445.0
Population outlook (Bristol County) Hauer SSP2
- Today (2025)
- 570,212 people
- By 2030
- 571,181 · +0.2%
- By 2040
- 565,389 · -0.8%
- By 2050
- 552,141 · -3.2%
- By 2075
- 520,923 · -8.6%
- By 2100
- 474,363 · -16.8%
Race, ethnicity, and origin ACS 2023
- Neighborhood character
- Predominantly White (66%)
- Race & ethnicity
- White 66% Hispanic / Latino 16% Two or more races 10% Black 8% Asian 2%
- Hispanic origin (detail)
- Puerto Rican 11%
- Common ancestry
- Russian 31% Lithuanian 12% Estonian 3%
- Foreign-born
- 21% · Canada, China
- Languages at home
- 60% English-only · Other Indo-European 24% Spanish 13% French/Haitian/Cajun 2%
Political lean MEDSL · Bristol
- 2024 margin
- Toss-up / Even · D 49.8% · R 48.5% · Other 1.8%
- 2008→2024 swing
- -21.9pp toward R · 2008: 23.2pp · 2024: 1.3pp
- All cycles
- 2024: D+1.3 2020: D+12.0 2016: D+9.3 2012: D+20.5 2008: D+23.2
Not yet ingested
- Civics
- —
Market trends
- HPI YoY
- ▼ -80.40%
- Current HPI
- 335.9466
- Rent YoY
- —
- Metro
- Providence-Warwick, RI-MA
- State GDP YoY
- ▲ 2.28%
- F500 in state
- 38
Industry mix (Fortune 500 HQ in MA)
| Industry | F500 HQs | Revenue |
|---|---|---|
| Technology | 3 | $17B |
|
||
| Insurance | 2 | $84B |
|
||
| Retail | 2 | $76B |
|
||
| Life Sciences | 1 | $43B |
|
||
| Energy Technology | 1 | $31B |
|
||
| Aerospace / Defense | 1 | $18B |
|
||
Price history
1 event — show timeline
- 2026-04-08 Listed $1,100,000 MLS PIN
Cash-flow waterfall
monthlySold comps — $/sqft
last 12 mo · ≤1 miLoading sold comps…