 Multi-family
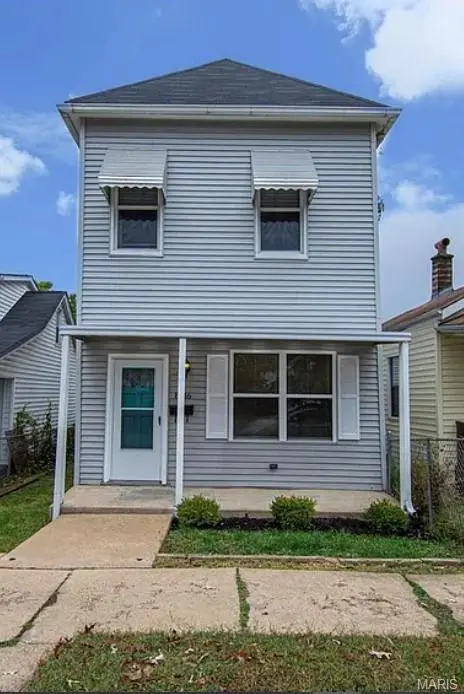
8516 Pennsylvania Ave · St. Louis, MO
Flood risk 1/10 · Minimal
- FEMA flood zone
- X (unshaded)
- Chance of flooding over 30 yrs
- 0.0%
- Est. flood insurance / yr
- $473 – $860
Fire risk 1/10 · Minimal
- Est. fire insurance / yr
- $1,054 – $1,958
Heat risk 6/10 · Moderate
- Hot days now (above 109°F)
- 7 days/yr
- Hot days in 30 yrs
- 21 days/yr
Wind risk 2/10 · Minimal
- Chance of severe wind over 30 yrs
- 1.0%
Air-quality risk 3/10 · Minor
- Unhealthy air days now
- 2 days/yr
- Unhealthy air days in 30 yrs
- 3 days/yr
Risk factors via First Street. Map © Google.
Why this score? — see what drove the B grade
The composite is a weighted blend of 9 inputs, each scored 0–100. Each bar is that input's sub-score; the figure is the points it added to the 100-point composite (weight × sub-score).
- Cash flow +29.0/30.0
- ARV discount +14.6/15.0
- DSCR +10.0/10.0
- 1% rule +7.1/10.0
- Rent growth +3.3/5.0
- Livability +2.5/5.0
- Condition / age +2.5/5.0
- Schools +1.2/10.0
- Appreciation +0.0/10.0
$120,000
🖨 Deal sheet 📄 Offer letter ✓ Due diligence
Multi-family units
County records classify this as Multi-Family (2-4 Unit). Listing-text estimate: 1 unit. estimate disagrees with records
Listing remarks MLS
Turnkey investment opportunity! This inviting two-story home offers three bedrooms and one and a half baths, currently leased and generating income. Featuring hardwood floors throughout, the property blends classic charm with everyday functionality. The main level includes convenient laundry, a spacious living room, separate dining area, and a well-appointed kitchen designed for comfortable city living. Rear off-street private parking adds valuable convenience for tenants. A solid addition to any rental portfolio! Have additional turnkey properties available as well.
Key facts
- Hardwood floors
- 3,423 sq ft lot
- Built 1897
Tags
Neighborhood map
What this means for you Summary
Snapshot
- This is a 3-bed/2.0-bath multifamily listed at $120k.
Deal economics
- At list price, monthly cash flow is $410 ($5k/yr) — positive.
- The deal already cash-flows at list — no discount required.
- Meets the 1% rule at list price ($1k rent vs $120k).
- Recommended offer: $106k (12.0% below list) — sets the bar for market timing.
- Cap rate 10.4% vs local median 5.0% in St. Louis — top-decile yield for the area; either an underpriced asset or a hidden risk that comps aren't pricing in. Stress-test before assuming the spread holds.
Location & tenants
- Location reads: area grade B — affects rentability + tenant quality, not the cash-flow math above.
- St. Louis City (urban): math 10% / reading 18% proficiency, ranked #312 of 324 in MO (top 96%) — low school quality limits family demand, transient renter base, plan for 1-2y turnover; 80% free/reduced lunch — lower-income household profile, screen leases tightly.
- Market conditions: Rents rising (+3.3%/yr); 125 active listings in the ZIP; 14 comparable units currently listed for rent nearby; rentals at typical pace (median 15d on market — plan ~3-4 weeks tenant-placement turnaround); 294 units permitted in St. Louis city in 2024 (227 in 5+ unit buildings).
- This rent runs 37% of the median local income ($47k/yr) — at the standard rent-burdened threshold; future hikes will face affordability resistance.
Forward outlook
- Local home prices are declining (-3.0%/yr); year-one equity from $830 of loan paydown is wiped out by about $4k of value loss. Plan a longer hold.
- St. Louis County population projected to shrink 6% by 2050 — rents likely to lag national; underwrite the cash flow, not the appreciation.
- At projected returns (-3.0% appreciation + 3.3% rent growth), your $34k cash investment doubles in ~8 years — after that, you're playing with house money.
Negotiation context
- It's been on market 124 days — a 12% lower offer ($106k) is reasonable based on typical stale-listing flexibility.
- 2 sale attempts since 6y ago; this cycle's ask has dropped $13k (10%) from the opening price — seller is motivated, your offer sets the floor, not the list.
Risks & watch-outs
- Watch-outs: built in 1897 — expect roof / HVAC / electrical / plumbing capex.
- Climate carrying-cost: extreme-heat days projected 7→21/yr by 2055 (HVAC capex compounding) — expect insurance premiums to compound above CPI over the hold.
Questions for the listing agent
- It's been on market 124 days. Have you received any prior offers? Is the seller open to a 12% concession, seller financing, or rate buy-down credit?
- Built in 1897 — when were the roof, HVAC, electrical panel, plumbing, and water heater last replaced?
- Why hasn't it sold? Are there any deal-killer items the seller is aware of (foundation, flood, title, zoning, code violations)?
- Is there a deadline driving the sale (1031 exchange, divorce, estate, relocation)? That informs how much negotiation room exists.
- What's the average days-on-market for RENTAL listings here right now (not sales)? A rising rental-DOM trend means longer vacancies and softer asking-rent achievability than the comps imply.
- What's the recent tenant-quality profile in this submarket — average credit score on applications, eviction rate, late-payment / NSF rate, and stable-employment percentage? A property-management company in the area should have these aggregated.
- How much new apartment / multifamily construction is in the pipeline within 1–3 miles? Heavy new supply (>2% of stock underway) typically softens rents 12–24 months out; light construction supports rent growth.
Investment metrics
- 1% rule
- 1.21% ✓
- Cap rate
- 10.39%
- Cash-on-cash
- 14.64%
- DSCR
- 1.65
- GRM
- 6.9
CMA / ARV
- ARV (median comp)
- $142,391
- List price
- $120,000
- Delta
- -15.72%
- Verdict
- UNDERPRICED
- Comps
- 20 within 1.0 mi
Show comp detail 1 sale within ~0.75 mi
| Address | Dist | Beds/Ba | Sqft | Sold | Price | $/sf | Match |
|---|---|---|---|---|---|---|---|
| 8635 S Grand Ave | 0.60mi | 4/3.0 (+1) | 1,657 (+8%) | 17mo | $239,000 | $144 | 36 |
Match score weights: distance 35% · size 25% · config 20% · recency 20%. Top-matched comps best support the ARV.
Projected returns pro-forma
-3.0% appreciation · 3.27% rent growth · sell at horizon
- IRR
- 5.4%
- Equity multiple
- 1.21×
- Total profit
- $7,022
- Equity at exit
- $17,892
- IRR
- 15.0%
- Equity multiple
- 2.23×
- Total profit
- $41,228
- Equity at exit
- $10,375
Cash invested: $33,600 (down + closing). Projections, not guarantees.
Landlord ↔ Tenant lean methodology
- Overall (STATE)
- 81 Strongly Landlord-Friendly
- State Missouri
- 81 Strongly Landlord-Friendly · R+10
- County
- — inherits STATE
- City
- — inherits STATE
ZIP-level market 63111
- Rents YoY
- 3.3%
- Active inventory
- 125
- Price-to-rent
- 6.9×
Monthly cashflow live
- Estimated rent
- $1,455 high interval (Pro) →
- Mortgage (P&I)
- −$629
- Tax from tax record
- −$60 /mo · $725/yr
- Insurance
- −$50
- HOA
- −$0
- Vacancy / Maint / Mgmt
- −$306
- Net cashflow
- $410
Break-even live
UW: 25.0% down · 7.5% · 30yr · 1.5% tax · 5.0% vac · 8.0% maint · 8.0% mgmt
Financing live
Cash to close
- Down payment
- $30,000
- Closing costs
- $3,600
- Reserves months
- —
- Total cash needed
- —
Loan-product check · same deal, 3 products live
Conventional
25% down · 7.5% · 30yr
- Down + closing
- —
- Monthly P&I
- —
- Monthly cashflow
- —
- DSCR
- —
- Eligible?
- —
Personal DTI + credit; lowest rate.
DSCR
20% down · 8.5% · 30yr
- Down + closing
- —
- Monthly P&I
- —
- Monthly cashflow
- —
- DSCR
- —
- Eligible?
- —
No personal income docs; deal must DSCR.
Hard money
10% down · 12.0% · 12mo
- Down + closing
- —
- Monthly P&I
- —
- Monthly cashflow
- —
- DSCR
- —
- Eligible?
- —
Short-term bridge; refi at stabilization.
Rent comps 14 comps
| Address | Beds | Baths | Sqft | Rent | $/sqft | DOM | Units | Dist |
|---|---|---|---|---|---|---|---|---|
| 7924 Michigan Ave Unit 2F St. Louis, MO | 3.0 | 2.0 | 1250 | $1,195 | $0.96 | 3d | 1 | 0.40mi |
| 229 Horn Ave Saint Louis, MO | 2.0 | 1.5 | 1301 | $1,871 | $1.44 | 2d | 1 | 0.55mi |
| 304 Bayless Ave Saint Louis, MO | 3.0 | 1.0 | 1104 | $1,950 | $1.77 | 2d | 1 | 0.55mi |
| 336 Lagro Ave Saint Louis, MO | 2.0 | 2.0 | 1340 | $1,250 | $0.93 | 44d | 1 | 0.71mi |
| 349 Lagro Ave Saint Louis, MO | 3.0 | 1.0 | 1184 | $1,500 | $1.27 | 44d | 1 | 0.72mi |
| 7417 Vermont Ave Unit 103 St. Louis, MO | 2.0 | 2.0 | 1069 | $1,500 | $1.40 | 14d | 1 | 0.78mi |
| 7417 Vermont Ave St. Louis, MO | 1.0–2.0 | 1.0–2.0 | 1144 | $1,600 | $1.40 | 2d | 8 | 0.78mi |
| 7024 Pennsylvania Ave Unit F St. Louis, MO | 2.0 | 1.0 | 1081 | $930 | $0.86 | 16d | 1 | 0.97mi |
| 6915 Alabama Ave Unit 1st Floor St. Louis, MO | 2.0 | 1.0 | 1248 | $1,200 | $0.96 | 44d | 1 | 1.09mi |
| 6800 Virginia Ave Unit 1 St. Louis, MO | 3.0 | 1.0 | 1500 | $1,475 | $0.98 | 18d | 1 | 1.16mi |
| 6730 Vermont Ave Saint Louis, MO | 3.0 | 2.0 | 1534 | $1,600 | $1.04 | 14d | 1 | 1.17mi |
| 3945 Crosby Dr Saint Louis, MO | 2.0 | 1.0 | 1100 | $2,083 | $1.89 | 2d | 1 | 1.18mi |
| 3857 Boulevard Heights Ct Saint Louis, MO | 3.0 | 2.5 | 1697 | $2,250 | $1.33 | 2d | 1 | 1.33mi |
| 6436 Idaho Ave Saint Louis, MO | 2.0 | 1.0 | 1050 | $995 | $0.95 | 44d | 1 | 1.37mi |
Listing history 25 events
-
2026-06-18days on market $120,000 Active 124 DOM
-
2026-06-17days on market $120,000 Active 123 DOM
-
2026-06-16days on market $120,000 Active 122 DOM
-
2026-06-16price $120,000 Active 121 DOM
-
2026-06-15days on market $132,000 Active 121 DOM
-
2026-06-13days on market $132,000 Active 119 DOM
-
2026-06-09days on market $132,000 Active 115 DOM
-
2026-06-08days on market $132,000 Active 114 DOM
-
2026-06-08days on market $132,000 Active 113 DOM
-
2026-06-05days on market $132,000 Active 110 DOM
-
2026-06-03days on market $132,000 Active 109 DOM
-
2026-06-02days on market $132,000 Active 108 DOM
-
2026-06-01days on market $132,000 Active 107 DOM
-
2026-05-31days on market $132,000 Active 106 DOM
-
2026-04-15price $132,000 574-char remark
Show marketing remark (574 chars)
Turnkey investment opportunity! This inviting two-story home offers three bedrooms and one and a half baths, currently leased and generating income. Featuring hardwood floors throughout, the property blends classic charm with everyday functionality. The main level includes convenient laundry, a spacious living room, separate dining area, and a well-appointed kitchen designed for comfortable city living. Rear off-street private parking adds valuable convenience for tenants. A solid addition to any rental portfolio! Have additional turnkey properties available as well.
-
2026-02-14$133,000 Active 574-char remark
Show marketing remark (574 chars)
Turnkey investment opportunity! This inviting two-story home offers three bedrooms and one and a half baths, currently leased and generating income. Featuring hardwood floors throughout, the property blends classic charm with everyday functionality. The main level includes convenient laundry, a spacious living room, separate dining area, and a well-appointed kitchen designed for comfortable city living. Rear off-street private parking adds valuable convenience for tenants. A solid addition to any rental portfolio! Have additional turnkey properties available as well.
-
2021-03-17soldstatus $273,028
-
2020-12-21soldstatus $86,000
-
2020-12-14soldstatus Closed 705-char remark
Show marketing remark (705 chars)
Est. 1897 - good sized home in the Patch neighborhood. 3 bedrooms with 1.5 baths and over 1500 square feet of living space! Tall ceilings on the first floor where you have a living room, dining room and eat-in kitchen plus a 1/2 bath laundry room. Upstairs you have 3 good sized bedrooms with a full bath. The backyard is flat and ready for your landscaping features. Its a blank canvas. There is a 2 car parking pad as well. Zoned hvac for your comfort and energy efficiency. Quick access to S Broadway, Lemay Ferry Road and Highway 55. Meet friends on the River des Peres Greenway at Broadway and soon be able to connect to the Mississippi Greenway to travel all the way to Jefferson Barracks Park!
-
2020-11-06status Pending 705-char remark
Show marketing remark (705 chars)
Est. 1897 - good sized home in the Patch neighborhood. 3 bedrooms with 1.5 baths and over 1500 square feet of living space! Tall ceilings on the first floor where you have a living room, dining room and eat-in kitchen plus a 1/2 bath laundry room. Upstairs you have 3 good sized bedrooms with a full bath. The backyard is flat and ready for your landscaping features. Its a blank canvas. There is a 2 car parking pad as well. Zoned hvac for your comfort and energy efficiency. Quick access to S Broadway, Lemay Ferry Road and Highway 55. Meet friends on the River des Peres Greenway at Broadway and soon be able to connect to the Mississippi Greenway to travel all the way to Jefferson Barracks Park!
-
2020-11-02$85,000 Active 705-char remark
Show marketing remark (705 chars)
Est. 1897 - good sized home in the Patch neighborhood. 3 bedrooms with 1.5 baths and over 1500 square feet of living space! Tall ceilings on the first floor where you have a living room, dining room and eat-in kitchen plus a 1/2 bath laundry room. Upstairs you have 3 good sized bedrooms with a full bath. The backyard is flat and ready for your landscaping features. Its a blank canvas. There is a 2 car parking pad as well. Zoned hvac for your comfort and energy efficiency. Quick access to S Broadway, Lemay Ferry Road and Highway 55. Meet friends on the River des Peres Greenway at Broadway and soon be able to connect to the Mississippi Greenway to travel all the way to Jefferson Barracks Park!
-
2020-10-25historical $85,000 705-char remark
Show marketing remark (705 chars)
Est. 1897 - good sized home in the Patch neighborhood. 3 bedrooms with 1.5 baths and over 1500 square feet of living space! Tall ceilings on the first floor where you have a living room, dining room and eat-in kitchen plus a 1/2 bath laundry room. Upstairs you have 3 good sized bedrooms with a full bath. The backyard is flat and ready for your landscaping features. Its a blank canvas. There is a 2 car parking pad as well. Zoned hvac for your comfort and energy efficiency. Quick access to S Broadway, Lemay Ferry Road and Highway 55. Meet friends on the River des Peres Greenway at Broadway and soon be able to connect to the Mississippi Greenway to travel all the way to Jefferson Barracks Park!
-
2006-03-08soldstatus $90,000
-
2003-10-08soldstatus $30,000
-
1997-12-22soldstatus
ⓘ Source: listings_history table (triggers on properties + properties_extension) + one-shot
backfill from property_details.listing_events for pre-trigger history.
Tax reassessment forecast MO · Resets to sale price
- Current annual tax
- $725 · $60/mo
- Projected year-2 tax
- $1,164 · $97/mo
- Expected delta
- +$439/yr (+$37/mo · 60.5%)
ⓘ Screening estimate from a state-policy table — verify with the county assessor before closing.
Climate risk First Street
- Flood 1/10 Low FEMA zone X (unshaded) · 0% chance over 30 yrs
- Wildfire 1/10 Low
- Heat 6/10 Major 7 d/yr ≥109°F today · 21 d/yr by 30 yrs out
- Wind 2/10 Low 100% chance of damaging wind over 30 yrs
- Air quality 3/10 Moderate 2 unhealthy d/yr today · 3 by 30 yrs out
Nearby sold comps map
Loading sold comps map…
Walkable amenities ~0.75 mi
Loading nearby amenities…
Taxation est. · year 1
- Rental income
- $17,462
- − Mortgage interest
- −$6,722
- − Property taxes
- −$725
- − Insurance
- −$600
- − Repairs & maintenance
- −$1,397
- − Management
- −$1,397
- − Depreciation
- −$3,491
- Taxable income
- $3,130
- Est. tax owed @ 24.0%
- −$751
- After-tax cash flow
- $4,167/yr
For passive investors: Depreciation is non-cash, so a rental often shows a tax loss while cash-flowing — sheltering income. Rental losses are passive: they offset passive income freely, and up to $25,000/yr can offset ordinary (W-2) income if you actively participate and your MAGI is under $100k (phasing out to $0 by $150k); unused losses carry forward. On sale, claimed depreciation is recaptured at up to 25%, and gains may owe capital-gains tax (a 1031 exchange can defer both). Figures are a year-1 estimate at your 24.0% rate — not tax advice; consult a CPA.
Schools (NCES district)
- District
- St. Louis City
- NCES district ID
- 2929280
- Math proficiency
- 10% ▼ -6.00%
- Reading proficiency
- 18% ▼ -3.00%
- Median HH income
- $35,685
- Composite
- 11.54/100
- National rank
- #9699
- State rank
- #312 of 324 in MO
Livability — St. Louis
No livability data for this city. (Only ~50 U.S. cities are tracked.)
Census & demographics
- Census place
- St. Louis, MO
- County
- Saint Louis City · 254,015 people
- City population
- 283,259
- Metro
- St. Louis, MO-IL
- Population (ZIP)
- 18,851
- Household income
- $47,039
- Rent vs Own
- Severe rent burden
- 1364.0
Population outlook (St. Louis County) Hauer SSP2
- Today (2025)
- 315,737 people
- By 2030
- 313,865 · -0.6%
- By 2040
- 305,439 · -3.3%
- By 2050
- 296,529 · -6.1%
- By 2075
- 271,028 · -14.2%
- By 2100
- 255,359 · -19.1%
Race, ethnicity, and origin ACS 2023
- Neighborhood character
- Diverse neighborhood (Simpson 0.65)
- Race & ethnicity
- Black 42% White 41% Two or more races 11% Hispanic / Latino 9% Asian 1%
- Hispanic origin (detail)
- Mexican 6%
- Common ancestry
- Lithuanian 3% Slovak 1% Romanian 1%
- Foreign-born
- 7% · Canada, India
- Languages at home
- 90% English-only · Spanish 7% Other Indo-European 1%
Political lean MEDSL · St. Louis
- 2024 margin
- Solid D (+64.7) · D 81.4% · R 16.7% · Other 2.0%
- 2008→2024 swing
- -3.5pp toward R · 2008: 68.2pp · 2024: 64.7pp
- All cycles
- 2024: D+64.7 2020: D+66.2 2016: D+63.7 2012: D+66.6 2008: D+68.2
Not yet ingested
- Civics
- —
Market trends
- HPI YoY
- ▼ -92.80%
- Current HPI
- 169.4644
- Rent YoY
- ▲ 3.27%
- Metro
- St. Louis, MO-IL
- State GDP YoY
- ▲ 1.84%
- F500 in state
- 20
Industry mix (Fortune 500 HQ in MO)
| Industry | F500 HQs | Revenue |
|---|---|---|
| Healthcare | 1 | $163B |
|
||
| Insurance | 1 | $21B |
|
||
| Industrial Technology | 1 | $17B |
|
||
| Retail | 1 | $16B |
|
||
| Industrial Distribution | 1 | $10B |
|
||
| Utilities | 1 | $9B |
|
||
Price history
+340.0% since first listed11 events — show timeline
- 2026-04-15 Price Changed $132,000 MARIS as Distributed by MLS Grid
- 2026-02-14 Listed $133,000 MARIS as Distributed by MLS Grid
- 2021-03-17 Sold (Public Records) $273,028 Public Records
- 2020-12-21 Sold (Public Records) $86,000 Public Records
- 2020-12-14 Sold (MLS) — MARIS as Distributed by MLS Grid
- 2020-11-06 Pending — MARIS as Distributed by MLS Grid
- 2020-11-02 Listed $85,000 MARIS as Distributed by MLS Grid
- 2020-10-25 Coming Soon $85,000 MARIS as Distributed by MLS Grid
- 2006-03-08 Sold (Public Records) $90,000 Public Records
- 2003-10-08 Sold (Public Records) $30,000 Public Records
- 1997-12-22 Sold (Public Records) — Public Records
Property tax history
+7.1%/yrLatest (2023): $725 · +34.2% YoY. Source: county tax records.
Cash-flow waterfall
monthlySold comps — $/sqft
last 12 mo · ≤1 miLoading sold comps…